


1 Introduction
The voicing contrast is among the most frequently investigated issues in phonetics (Fuchs Reference Fuchs2005: 2). This is hardly surprising because there is much more to the voicing contrast than simply adducted, vibrating vocal folds during voiced and abducted vocal folds during voiceless sounds. For example, a consistent finding in the literature is that voicing contrasts are signalled by multiple acoustic cues, of which voicing is just one. There are several interdependent physiological mechanisms that make the voicing issue rather complicated to investigate. Voicing requires a transglottal pressure difference, which is closely related to the shape and size of the supraglottal cavities. The shape and size of the supraglottal cavities are in turn constrained by the place and manner of articulated sounds. Finally, voicing effects are influenced by a range of coarticulatory, prosodic and other communication-related conditions. This means that voicing can be studied at least at two levels of speech production: glottal and supraglottal. In this investigation we are concerned with the latter.
One of the most important features of articulation taking place at the supraglottal level is tongue-to-palate contact, which is most successfully investigated via electropalatography (EPG). To date, supraglottal cues for voicing have been most thoroughly investigated in stops (Fuchs Reference Fuchs2005: 21). Fricatives and affricates have been investigated in this respect somewhat less (Fuchs Reference Fuchs2005: 21; Fuchs, Brunner & Busler Reference Fuchs, Brunner and Busler2007), although recent research is closing this gap (Dagenais, Lorendo & McCutcheon Reference Dagenais, Lorendo and McCutcheon1994, Dixit & Hoffman Reference Dixit and Hoffman2004, McLeod, Roberts & Sita Reference McLeod2006, Fuchs et al. Reference Fuchs, Brunner and Busler2007, Recasens & Espinosa Reference Recasens and Espinosa2007, Liker & Gibbon Reference Liker, Gibbon, Lee and Zee2011, Liker, Horga & Mildner Reference Liker, Horga and Mildner2012). Most EPG studies of the voicing distinction in fricatives have been concerned with static measurements at one moment in time. In contrast, the current study focuses on the dynamic properties of tongue-to-palate contact in voiced and voiceless lingual fricatives for reasons that will be described in more detail in the following sections.
Voicing and frication require opposite production strategies. In order to maintain voicing, there needs to be a transglottal pressure difference, with the supraglottal pressure lower than the subglottal. At the same time, in order to produce frication, supraglottal pressure needs to increase so that turbulence can be successfully achieved. Therefore, the air stream must be carefully managed by coordinating respiratory, laryngeal and articulatory mechanisms. In contrast, voiceless fricatives have no such contradictory demands on the articulatory mechanism because supraglottal pressure can be freely increased in order to produce a high-pressure air stream. A high amount of air flow is facilitated by an abducted glottis in voiceless fricatives (Ohala & Solé Reference Ohala, Solé, Fuchs, Toda and Zygis2010). The difference in laryngeal–supralaryngeal coordination that is required for the production of voiced and voiceless fricatives is associated with differences in oral articulatory characteristics that are also conditioned by voicing.
Several oral articulatory characteristics are considered essential for the production of anterior lingual fricatives; a narrow midline groove is the most commonly mentioned characteristic (Gibbon & Hardcastle Reference Hardcastle, Gibbon, Ball and Code1997, Hardcastle & Edwards Reference Hardcastle, Edwards and Kent1992, McLeod et al. Reference McLeod, Roberts and Sita2006). In order to maintain the characteristic fricative groove, a precise relationship between the active (tongue tip/lamina) and the passive articulators (incisors/alveolar ridge/prepalatal zone) needs to be established. Apart from the midline groove, placement characteristics and the amount of contact are most frequently analysed when investigating differences in lingual fricatives conditioned by voicing (Dagenais et al. Reference Dagenais, Lorendo and McCutcheon1994, Dixit & Hoffman Reference Dixit and Hoffman2004, McLeod et al. Reference McLeod, Roberts and Sita2006, Fuchs et al. Reference Fuchs, Brunner and Busler2007, Recasens & Espinosa Reference Recasens and Espinosa2007, Liker & Gibbon Reference Liker, Gibbon, Lee and Zee2011, Liker et al. Reference Liker, Horga and Mildner2012). All these articulatory characteristics can be studied by means of electropalatography (EPG), which is the only instrumental technique that is able to provide a detailed record of tongue-to-palate contact during speech.
EPG research into the supralaryngeal differences between voiced and voiceless fricatives has mostly shown increased anterior contact and smaller groove width in voiced fricatives (Dagenais et al. Reference Dagenais, Lorendo and McCutcheon1994, Dixit & Hoffman Reference Dixit and Hoffman2004, McLeod et al. Reference McLeod, Roberts and Sita2006, Liker & Gibbon Reference Liker, Gibbon, Lee and Zee2011, Liker et al. Reference Liker, Horga and Mildner2012). These differences are explained by aerodynamic factors in the production of voiced as opposed to voiceless fricatives, whereby the air pressure during a voiceless fricative is so high that it pushes out the lateral edges of the tongue, thus creating a wider midline groove and less tongue-to-palate contact. A somewhat more complex difference between voiced and voiceless fricatives was found in Croatian (Liker & Gibbon Reference Liker, Gibbon, Lee and Zee2011). These authors found that in voiced and voiceless postalveolar fricatives /ʃ/ and /ʒ/, the anterior groove width and posterior groove width had opposite tendencies. The authors found that the anterior width was slightly wider in the voiceless than in the voiced fricatives, while the voiced fricatives were produced with a wider posterior groove than the voiceless fricatives. They suggested that a slightly wider posterior groove in the voiced fricatives supported claims that constriction size behind the place of articulation might be manipulated by speakers in order to facilitate voicing in fricatives (see also Fletcher & Newman Reference Fletcher and Newman1991).
Most EPG studies that have reported differences in supralaryngeal characteristics of voicing in fricatives have provided static measures taken at a single temporal point in fricative production, most commonly at the maximum contact point (e.g. McLeod et al. Reference McLeod, Roberts and Sita2006), or averaged across the whole fricative duration (e.g. Fuchs et al. Reference Fuchs, Brunner and Busler2007). However, differences in the peak lingual palatal contact pressure between voiced and voiceless fricatives can be expected, because voiced fricatives need a stable and carefully controlled air stream to produce both frication and voicing, while voiceless fricatives have abducted vocal folds to facilitate a fast increase in air stream. It is still largely uninvestigated whether such differences have an effect on the timing of tongue-to-palate contact throughout the duration of voiced and voiceless fricatives.
Interesting tongue pressure results have been reported for Japanese stops, where the difference between voiced and voiceless stops was not found in maximum tongue pressure, but in the timing of the peak tongue pressure (Matsumura et al.1994, cited in Fuchs Reference Fuchs2005: 75). The authors measured tongue-to-palate contact pressure and patterns during consonant productions using a force sensor mounted palatal plate. For that purpose they developed an artificial palate with strain gauges along the palate midline. During the production of the voiceless stop /t/ the maximal tongue-to-palate pressure occurred about 100 ms prior to the stop burst, while in /d/ the peak pressure and the stop burst occurred closer to each other. If a comparable process occurs in fricatives, it remains to be investigated whether it has any repercussions on the timing of maximum contact point, minimum groove width point or placement in voiced and voiceless fricatives. Furthermore, the presence of relatively stable turbulent noise during fricative production does not necessarily mean that there are stable tongue-to-palate contact patterns, because frication can begin before the maximum constriction is reached and can continue during the period of separation of the active and the passive articulator (Docherty Reference Docherty1992: 9). In order to investigate the timing factor, it is important to measure the dynamics of tongue-to-palate contact throughout the duration of the fricative period, and not at just one single point in time.
In an extensive acoustic study of Croatian sounds, Bakran (Reference Bakran1996) showed that voiced fricatives in Croatian need to maintain full voicing throughout their duration. Therefore, supralaryngeal requirements for the production of frication and voicing need to be carefully maintained from the beginning to the end of voiced fricatives. It would be reasonable to hypothesise that tongue-to-palate contact for voiced fricatives would be less variable compared to their voiceless counterparts. Voiced fricatives would also require a narrower midline groove and more tongue-to-palate contact than voiceless fricatives, in order to enable frication in a low pressure air stream environment. Evidence of a narrower midline groove and increased contact at the place of articulation was found in voiced Croatian fricatives at a maximum contact point, but less variability was not confirmed (Liker & Gibbon Reference Liker, Gibbon, Lee and Zee2011, Liker et al. Reference Liker, Horga and Mildner2012). The authors explained the similar levels of variability between the voiced and the voiceless fricatives by a low overall level of variability, reflecting high coarticulatory resistance in all fricatives.
In this study we investigate the difference in the timing of tongue-to-palate contact patterns between voiced and voiceless lingual fricatives in Croatian. We aim to do this by comparing the dynamic characteristics of place of articulation, fricative groove width and the amount of contact during voiced and voiceless fricatives.
2 Method
2.1 Speakers
There were three female (F1, F2, F3) and three male (M1, M2, M3) participants in this study with no self-reported history of speech or hearing impairments. All of the participants were adult speakers of Croatian, aged between 26 and 35 years, with a mean age of 30.8 years. Each speaker had an artificial palate constructed individually, to fit against the hard palate (the Articulate Palate, Wrench Reference Wrench2007).
2.2 Speech material
Speech material was extracted from the CROELCO database – the Croatian acoustic and electropalatographic corpus (Liker et al. Reference Liker, Horga and Mildner2012). The material consisted of symmetrical nonsense VCV sequences in which V represented three corner vowel positions: /i/, /u/ and /a/, while C represented the consonants /s z ʃ ʒ/. Each speaker repeated the 12 sequences six times, resulting in a total of 432 items. All items were produced with a short-falling accent placed on the first syllable, which made the VCV sequences phonotactically comparable to real Croatian words (e.g. /mǎsa/ “mass”, /bǎːza/ “base”, /t
![]() ʃiː/ “quieter”, /n
ʃiː/ “quieter”, /n
![]() ʒiː/ “shorter”).
ʒiː/ “shorter”).
2.3 Procedure
Speech data were recorded using the WinEPG system. EPG data were sampled at 100 Hz. Acoustic data were recorded simultaneously using M-Audio MobilePre external USB sound card/pre-amplifier with the sampling rate of 22050 Hz. Annotation, segmentation and data preparation were performed in Articulate Assistant (Wrench et al. Reference Wrench, Gibbon, McNeill, Wood, Hansen and Pellom2002). MS Excel was used for statistical analysis and data visualization. All participants underwent a desensitization period in two phases. The first phase consisted of five days with two-hour palate-wearing sessions each day. The second phase of the desensitization procedure was prior to the recording and lasted for a maximum of one hour. The recording procedure began only when the speaker's articulation was rated as acceptable by two trained phoneticians.
2.4 Data analysis
Annotation and segmentation of fricatives were performed according to acoustic criteria. The beginning of a fricative was the start of high-frequency noise and/or the absence of second formant in the preceding vowel on the spectrogram. The presence of a clearly visible second formant and/or the absence of high-frequency noise was the acoustic cue for the end of the fricative. Four EPG measurements, detailed below, were taken from the fricatives and analysed at a predetermined number of equally spaced sample points (nsp). The nsp for each speaker and each fricative pair was determined by the formula
 $nsp = \frac{t}{{10}}$
, where t is the duration of the shortest fricative in each speaker in milliseconds and 10 represents the distance between each EPG sample determined by the EPG sampling frequency (100 Hz). The shortest fricative in each speaker and each fricative pair was chosen in order to prevent over-sampling (multiple sampling of the same EPG frame). Selecting discrete points throughout the friction period in this way made it possible to compare measurement values throughout the fricatives which were of variable durations. Results for each fricative were analysed for all vowel contexts cumulatively. Coarticulatory processes in voiced and voiceless fricatives were outside the scope of this paper, so vowel effects on fricative dynamics were not analysed here. The following EPG measures were as described in the remainder of this section.
$nsp = \frac{t}{{10}}$
, where t is the duration of the shortest fricative in each speaker in milliseconds and 10 represents the distance between each EPG sample determined by the EPG sampling frequency (100 Hz). The shortest fricative in each speaker and each fricative pair was chosen in order to prevent over-sampling (multiple sampling of the same EPG frame). Selecting discrete points throughout the friction period in this way made it possible to compare measurement values throughout the fricatives which were of variable durations. Results for each fricative were analysed for all vowel contexts cumulatively. Coarticulatory processes in voiced and voiceless fricatives were outside the scope of this paper, so vowel effects on fricative dynamics were not analysed here. The following EPG measures were as described in the remainder of this section.
-
1. Placement dynamics was estimated using the centre of gravity (CoG) index (Hardcastle, Gibbon & Nicolaidis Reference Hardcastle, Gibbon and Nicolaidis1991), which measures the location of the highest concentration of contacted electrodes. Centre of gravity is a frequently used measure of place of articulation taken from EPG data (Gibbon, Hardcastle & Nicolaidis 1993, Mair, Scully & Shadle 1996, Fuchs & Perrier Reference Fuchs, Perrier, Solé, Recasens and Romero2003, Gibbon et al. Reference Gibbon, McNeill, Wood and Watson2003, Gibbon & Wood Reference Gibbon and Wood2003, Simonsen & Moen Reference Simonsen and Moen2004, McLeod Reference McLeod2006, Cheng et al. Reference Cheng, Murdoch, Goozee and Scott2007). For visualization purposes CoG values were multiplied by eight. A higher CoG value indicates a more anterior articulation, while a lower value means a more posterior articulation. EPG contact variability is also measured. This measure is available in the Articulate Assistant software (Wrench et al. Reference Wrench, Gibbon, McNeill, Wood, Hansen and Pellom2002). Variability of EPG contact patterns is calculated across all contacts during the production of each fricative. The index calculates the per cent of activation for each electrode throughout the fricative. For each contact, 100% and 0% activation frequency represents invariance and is assigned a variance index of 0. The variability index increases as contact frequency approaches 50%, which is assigned a maximum index of 50 (Wrench Reference Wrench2008).
-
2. Midline groove dynamics was obtained by the mean lateral measure available in the Articulate Assistant software (Wrench et al. Reference Wrench, Gibbon, McNeill, Wood, Hansen and Pellom2002). This index measures whether there is more contact at the midline of the palate or towards the lateral sides. A higher index number indicates greater groove width (Wrench Reference Wrench2008).
-
3. Target acquisition lag measure (TAL) was devised as a new measure to determine the onset of stable target tongue configuration during the fricative. This measure was calculated in the following way:
-
(i) First, the amount of contact indices were calculated for the sample points in each fricative: the amount of contact in the first four rows of electrodes (the first four rows were chosen because that is the region of the palate where the characteristic shape is the most critical in anterior lingual fricatives) for each sample point recorded by the EPG. The number of sample points (nsp) was determined as explained earlier.
-
(ii) The target configuration for each fricative was found by calculating the mode (the sequence of amount of contact indices which occurs most frequently). The beginning of the target configuration was the first EPG frame of the mode (EPG frame at the beginning of the sequence of frames with the most frequent amount of contact index).
-
(iii) The duration between the start of the annotation and the beginning of the target configuration (determined by the mode) was defined as the TAL.
-
(iv) The TAL was expressed as a percentage of the total duration of the annotation (see Figure 1).
-
-
4. Visualisation of the TAL measure was also performed. The amount of contact dynamics as measured by the total measure was used to visualise the difference in TAL. The total measures all the contacted electrodes and divides that number by the total number of electrodes on the palate (Wrench Reference Wrench2008). The total was multiplied by 100 to express it as a percentage. The amount of contact was measured for each row of electrodes at a predetermined number of equidistant sample points. The number of sample points was determined by the duration of the shortest fricative. In order to find out the difference between the voiced and voiceless counterparts, data for each electrode in each row and at each sample point for the voiceless fricative were subtracted from the data for each electrode in each row and at each sample point for the voiced fricative. This was calculated for each speaker. The result is a detailed visualisation of the differences in contact dynamics between voiced and voiceless fricatives throughout their duration. In this paper we use this measure only to visualise the difference captured by the TAL measure. The calculation can be visualised as shown in Figure 2.

Figure 1 An illustration of the target acquisition lag (TAL) measure. In this example the TAL is 40 milliseconds, or 20%, of the total duration of the fricative (200 milliseconds).

Figure 2 A visualisation of the target acquisition lag (TAL) measure. The figure shows the difference in the amount of contact between the voiced and the voiceless postalveolar fricatives across the whole of the palate throughout their duration.
Differences in placement and midline groove dynamics between voiced and voiceless fricatives at each sample point were tested statistically within speakers by means of unequal variance t-test (alpha = .05). All other differences were tested across speakers by means of two-way ANOVA with replication (alpha = .05).
3 Results
3.1 Placement dynamics
The results showed differences (described in the next sections) in placement dynamics between voiced and voiceless fricatives. A general finding was that similar tendencies occurred in alveolar and postalveolar fricatives.
3.1.1 Alveolar fricatives /s/ and /z/
Figure 3 shows average CoG values for /s/ and /z/ over the time course of the fricatives. The comparison of the CoG trendlines at each sample point shows that for each speaker, the voiced and voiceless fricatives had near-identical place of articulation throughout the mid-portion of the fricative. This is indicated by a stable plateau of CoG values throughout most of the duration of the fricative. However, differences can be observed at the periphery of the fricative, that is, at the start and end points. Here there were consistently lower average CoG values for the voiceless compared to the voiced fricative. An illustration of this difference can be seen in Figure 4. Lower CoG values occurred in all voiceless cases, and reached statistical significance in four out of six speakers (F1, F2, M1, M3) at the start of frication and in two out of six speakers (M1, M3) at the end. In speaker F1, two initial points were statistically significantly different (point 1: t(18) = 2.1009, p < .001; point 2: t(24) = 2.0639, p < .001), in speaker F2 two initial sample points showed significant difference (point 1: t(20) = 2.0859, p < .01; point 2: t(34) = 2.0322, p < .05), in speaker M1 three initial (point 1: t(25) = 2.0560, p < .001; point 2: t(33) = 2.0345, p < .001; point 3: t(34) = 2.0322, p < .01) and the final sample point were significantly different (point 8: t(34) = 2.0322, p < .001), and in speaker M3 two initial (point 1: t(22) = 2.0739, p < .001; point 2: t(33) = 2.0345, p < .01) and the final sample point were significantly different (point 7: t(34) = 2.0322, p < .001).
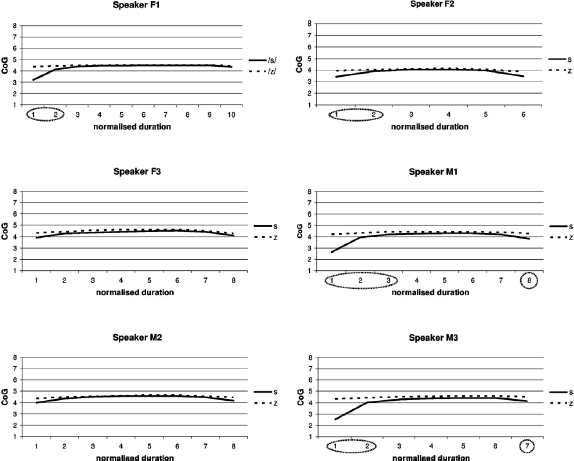
Figure 3 Average CoG values measured at equally spaced sample points during alveolar fricative productions in each speaker (F1, F2, F3, M1, M2, M3). Solid line represents voiceless fricative /s/ and dashed line represents voiced fricative /z/. Encircled are data points at which statistically significant differences were found between the voiced and the voiceless.

Figure 4 EPG printouts of palatograms and waveforms for alveolar fricative /s/ (upper panel A) and /z/ (lower panel B) in the context of vowel /a/ for speaker F1. The figure illustrates that the voiceless fricative reaches a stable period in terms of tongue placement and groove configuration later than the voiced fricative.
3.1.2 Postalveolar fricatives /ʃ/ and /ʒ/
As expected, CoG values for all speakers were lower for postalveolar fricatives compared to their own values for alveolar fricatives. Average placement at the maximum contact point in the postalveolar fricatives was more posterior (average CoG in /ʃ/ is 3.36, SD = 0.34; average CoG in /ʒ/ is 3.47, SD = 0.29) than in alveolar fricatives (average CoG in /s/ is 4.17, SD = 0.16; average CoG in /z/ is 4.31, SD = 0.14). These differences were statistically significant (/s/–/ʃ/: F(1,5) = 337.99, p < .001; /z/–/ʒ/: F(1,5) = 337.39, p < .001). This is because alveolar fricatives have a more fronted place of articulation than postalveolar fricatives.
The results of the placement dynamics in postalveolar fricatives show tendencies very similar to those described for the alveolar fricatives. During the middle of the fricative there were almost identical CoG values for the voiced and voiceless productions. Voiceless fricatives had lower average CoG values at the edges of their duration in all cases, when compared to voiced fricatives (Figure 5). The difference at the beginning of the fricatives reached statistical significance in speakers F1, F3, M1 and M3, while at the end of the fricatives the difference was significant in M1 and M3. In speaker F1 two initial sample points were statistically significantly different in voiced and voiceless productions (point 1: t(27) = 2.0518, p < .001; point 2: t(34) = 2.0322, p < .01), in speaker F3 the initial point showed a significant difference (point 1: t(32) = 2.0369, p < .01), in speaker M1 the difference was in the initial (point 1: t(21) = 2.0976, p < .001) and in the final points (point 7: t(29) = 2.0452, p < .01) and in speaker M3 the difference was significant in two initial points (point 1: t(31) = 2.0395, p < .001; point 2: t(33) = 2.0345, p < .001) and in the final sample point (point 6: t(34) = 2.0322, p < .01).

Figure 5 Average CoG values measured at equally spaced sample points during postalveolar fricative productions in each speaker (F1, F2, F3, M1, M2, M3). Solid line represents voiceless fricative /ʃ/ and dashed line represents voiced fricative /ʒ/. Encircled are data points at which statistically significant differences were found between the voiced and the voiceless.
The difference in the timing of reaching the target tongue configuration for fricatives was also reflected in the EPG variability data, which showed that voiceless fricatives were more variable (/s/ = 4.03, SD = 0.27; /ʃ/ = 3.42, SD = 0.25) than voiced fricatives (/z/ = 1.97, SD = 0.39; /ʒ/ = 2.08, SD = 0.22) in each speaker across vowel contexts. The differences in EPG variability were statistically significant (/s/–/z/: F(1,5) = 38.07, p < .001; ./ʃ/–/ʒ/: F(1,5) = 16.28, p < .001).
3.2 Midline groove dynamics
The results of the midline groove dynamics show that alveolar voiced and voiceless fricatives had similar characteristics during the mid-portion of frication. However, differences between the voiced and the voiceless were similar to those seen in placement data and can be observed at the beginnings and ends of the fricative stretches. Figure 6 shows that the voiced fricative /z/ forms the target groove width right from the beginning, while in the voiceless fricative /s/ there is a slight lag in reaching the target position. This trend was statistically significant in four speakers (F1, M1, M2, M3). In speaker F1 the initial sample point showed a significant difference (point 1: t(23) = 2.0687, p < .01), in speaker M1 differences were significant in three initial sample points (point 1: t(29) = 2.0452, p < .05; point 2: t(29) = 2.0452, p < .05; point 3: t(33) = 2.0345, p < .05) and in the final sample point (point 8: t(28) = 2.0484, p < .05), in speaker M2 the differences were statistically significant in the initial point (point 1: t(30) = 2.0422, p < .05) and in the final sample point (point 8: t(34) = 2.0322, p < .01). In speaker M3 differences between the voiced and the voiceless fricatives were statistically significant at all EPG sample points (point 1: t(28) = 2.0484, p < .01; point.2: t(29) = 2.0452, p < .001; point 3: t(34) = 2.0322, p < .001; point 4: t(34) = 2.0322, p < .001; point 5: t(34) = 2.0322, p < .001; point 6: t(34) = 2.0322, p < .01; point 7: t(24) = 2.0639, p < .001).

Figure 6 Average lateral values measured at equally spaced sample points during postalveolar fricative productions in each speaker (F1, F2, F3, M1, M2, M3). Full line represents voiceless fricative /s/ and dashed line represents voiced fricative /z/. Encircled are data points at which statistically significant differences were found between the voiced and the voiceless.
The midline groove trendlines in the postalveolar voiced fricative were identical to the trendlines in the postalveolar voiceless fricative. No notable differences between the voiced and the voiceless postalveolar fricatives were observed at any sample point, so only data for alveolars are presented here.
3.3 Target acquisition lag
The TAL measure shows that the delay in the tongue reaching its target position is longer in voiceless (/s/: 21%, SD = 0.06; /ʃ/: 31%, SD = 0.08) than in voiced fricatives (/z/: 12%, SD = 0.04; /ʒ/: 13%, SD = 0.02). This difference was observed in each speaker (Figures 7 and 8) and was statistically significant in alveolar (F(1,5) = 19.45, p < .001) as well as in postalveolar fricatives (F(1,5) = 84.15, p < .001) when tested across speakers. Postalveolar fricatives exhibited greater TAL differences (18% difference) than alveolar fricatives (9% difference).

Figure 7 Average target acquisition lag (TAL) measures for alveolar fricatives for each speaker.

Figure 8 Average target acquisition lag (TAL) measures for postalveolar fricatives for each speaker.
The difference in TAL between the voiced and the voiceless fricatives can be attributed to a slower increase of contacts in voiceless fricatives at the beginning of their duration in the front of the palate when compared to voiced fricatives. This slower increase was observable at the front of the palate, while at the back of the palate the increase in contacts was similar to the increase in voiced fricatives. An illustration of this difference can be seen in Figure 9. The data also show that in some speakers the voiceless fricatives had a slightly earlier decrease of contacts at the end of their duration also in the front of the palate.

Figure 9 Difference in the target acquisition lag (TAL) measure visualised by the amount of contact in voiced and voiceless fricatives. Amount of contact difference (vertical axis) between /s/ and /z/ (left chart) and /ʃ/ and /ʒ/ (right chart) in speaker F1 in each row of electrodes (horizontal axis) throughout fricative duration (z-axis). Positive values indicate greater contact in the voiced, while negative values indicate greater amount of contact in the voiceless.
4 Discussion and conclusions
The results of this study have revealed some previously unreported differences in the articulatory dynamics of voiced and voiceless fricatives. The differences were located at the periphery of the fricative, primarily at the start of the frication. More specifically, voiceless fricatives reached their target position in terms of articulatory placement and groove configuration later in the frication than voiced fricatives. In other words, the voiced fricative reached its target position at the start of frication, whereas the voiceless fricative reached its target approximately 20% into the fricative. This tendency was more pronounced in alveolar than in postalveolar fricatives and there was no difference in midline groove width dynamics between postalveolar fricatives. The results of the CoG and the midline groove dynamics were supported by the TAL measure, which showed that it took the voiceless alveolar fricative nearly 10% more time to reach the target contact configuration compared to the voiced fricative. The TAL measure also showed that the voiceless postalveolar fricative took nearly 20% longer than its voiced counterpart to reach its target EPG configuration. The dynamic data revealed that voiceless fricatives increased anterior contact more slowly than voiced fricatives, while posterior contact increased at a similar rate in the voiced and voiceless fricatives. The results showed that voiceless fricatives first increased contact and formed the groove behind the place of articulation and only then increased contact in the front of the palate (at the place of articulation). Voiced fricatives, on the other hand, increased contact more evenly across the palate, when compared to the voiceless fricatives.
The findings from the current study are in agreement with some well-established facts about frication and voicing. In order to maintain voicing, there needs to be a transglottal pressure difference, with the supraglottal pressure lower than the subglottal. At the same time, in order to produce frication, supraglottal pressure needs to increase so that turbulence can be successfully maintained. Previous EPG studies have shown that these aerodynamic processes were associated with increased EPG contact and a narrower midline groove in voiced fricatives (Dixit & Hoffman Reference Dixit and Hoffman2004, McLeod et al. Reference McLeod, Roberts and Sita2006, Fuchs et al. Reference Fuchs, Brunner and Busler2007, Recasens & Espinosa Reference Recasens and Espinosa2007). However, most measurements in previous studies were taken from only one time point during the fricative, so EPG characteristics of tongue-to-palate contact over the whole time course of voiced as opposed to voiceless fricatives have not yet been investigated. The novelty of the present research is that it has shown consistent differences in the timing of tongue-to-palate contact patterns between voiced and voiceless fricatives at specific time points (beginning and end of frication) and in a specific region of the palate (anterior region).
Results from this paper generally support previously reported findings about pharyngeal articulation of voiced and voiceless fricatives (Proctor, Shadle & Iskarous Reference Proctor, Shadle and Iskarous2010). Proctor et al. (Reference Proctor, Shadle and Iskarous2010) found that voiced fricatives were produced with a larger pharyngeal cavity than their voiceless counterparts. The enlargement strategy was expected in stops, but it was surprising in fricatives. It was shown that enlargement was mainly due to a forward displacement of the tongue dorsum, which caused the upper oropharynx to enlarge. Furthermore, the authors argued that voiceless fricatives were produced with the back of the tongue closer to the rear pharyngeal wall, thus creating an air-pressure control mechanism. The results from the current study showing that there is a delay in the tongue reaching its target configuration in voiceless fricatives could be explained by the existence of such pharyngeal air-pressure control mechanism, which could give more time to the tongue tip to reach its optimum position. This is another mechanism which facilitates the back of the tongue to contact the palate first in voiceless fricatives. Only after the lateral lock is firmly secured in the back (and the strong air stream is directed towards the front of the oral cavity) does the front of the tongue contact the palate and create a narrow groove in the front. However, the pharyngeal data from the Proctor et al. study were produced by average MRI scans of the vocal tract during the sustained fricative productions, while speakers were instructed to maintain a stable articulatory position, so the analysis did not offer insight into the timing of pharyngeal control mechanism. The findings from the present study are also consistent with a previous investigation of Croatian fricatives (Liker & Gibbon Reference Liker, Gibbon, Lee and Zee2011), which showed that the voiceless postalveolar fricative was produced with a narrower posterior groove width than the voiced one, indicating an increased constriction in the posterior oral cavity at the maximum contact point.
The results of the EPG contact dynamics in this study have provided further support for the claim that voiced fricatives employ a cavity enlargement strategy. The data revealed that voiceless fricatives slowly increased contact at the alveolar place of articulation (the anterior four rows) and had a long TAL. In contrast, the voiced fricatives increased contact more evenly across the whole palate and had a shorter TAL. Voiced fricatives seem to employ a type of cavity enlargement strategy in which the larynx is lowered, which in turn lowers the back of the tongue. This prevents the back of the tongue from raising and making contact with the palate before the front of the tongue raises during voiced fricative production. This is unlike the strategy used for voiceless fricatives, where the back of the tongue is raised first to achieve a secure lateral lock. This lock is required before a high-pressure, high-velocity air stream can be directed towards the narrow anterior groove.
Other studies have also shown evidence of cavity enlargement strategies in voiced fricatives (Narayanan, Alwan & Haker Reference Narayanan, Alwan and Haker1995). These findings are in agreement with EPG data on Japanese alveolar fricatives (Yoshioka Reference Yoshioka2008). Yoshioka (Reference Yoshioka2008) investigated voicing differences in whispered speech and found that EPG contact patterns during /s/ were less stable than those during /z/. The author concluded that vocal fold vibrations were essential for producing a voicing distinction, but that some of the supralaryngeal mechanisms were exaggerated in order to maintain this distinction when vocal fold vibrations were not present. This could also mean that a proportional relation between the presence of voicing and tongue-to-palate contact stability might not have been conditioned by just biomechanical properties, but that it could have been the result of a planned, actively controlled process. This is only speculation and the issue should be investigated further.
The results of this study support aerodynamic evidence, which has shown that voiced and voiceless fricatives differ in the onset and the offset of turbulence (Scully Reference Scully1971). However, Scully (Reference Scully1971) did not find any evidence of the difference in tongue movements, and concluded that the only significant difference in the articulation of /s/ and /z/ was in glottal adjustment and not in muscular tension or breath force. The findings from this study do not support this view and are in agreement with later studies that present evidence for the existence of articulatory control of aerodynamic conditions (e.g. Fuchs & Koenig Reference Fuchs and Koenig2009).
Aside from cavity enlargement strategy in voiced fricatives, there is an alternative explanation for the results presented in this study. In the speech material used for this investigation, voiced fricatives were situated in a favourable assimilated voicing context (VCV), whereas their voiceless counterparts were not. As a result, voiceless fricatives first increased posterior contact at the start of friction in order to decrease the size of the supra-laryngeal cavity and thus stop voicing. Voiced fricatives only needed to continue voicing from the previous vowel, so they were free to increase contact more evenly across the whole of the palate right from the start of friction.
The finding from the current study of similar midline groove dynamics during voiced and voiceless postalveolar fricatives was unexpected. We predicted that differences in the place of articulation throughout the fricative would have consequences for midline groove dynamics. One possible explanation for the similar groove dynamics could be that the tip of the tongue does not touch the palate at all at the beginning of the postalveolar voiceless fricatives, and once it does, it immediately forms the groove. This would account for the difference in the placement dynamics and the absence of a difference in midline groove dynamics. However, this is only speculation and the issue needs further investigation. The use of imaging techniques, such as ultrasound, alongside EPG, might provide additional insights because EPG cannot capture the tongue's activity when it is not in contact with the palate.
Although the data in this investigation were recorded from Croatian speakers, the results are congruent with the body of research carried out in other languages. Therefore, the results reported here for Croatian voiced and voiceless anterior lingual fricatives are predicted to apply to similar sounds in other languages. Nevertheless, this remains to be investigated. Also, when making generalisations based on these results, it is important to keep in mind that the speech material consisted of nonsense sequences. Although the non-words used in this investigation met the phonotactic and accent distribution rules of Croatian, it remains to be seen whether similar results will be obtained from real words.
This study has shown that differences in the articulation of voiced and the voiceless fricatives are not fully captured using static measurements alone. Important phonetic features are revealed by analysing the timing of tongue-to-palate contact patterns during the whole frication period.
The results from the present investigation are relevant for phonetic and phonological theory, because they add to the growing literature showing that there is a dependency relationship between the glottal and supraglottal mechanisms. These interdependent mechanisms indicate that laryngeal and supralaryngeal features cannot be represented by different branches in phonology (see Ohala & Solé Reference Ohala, Solé, Fuchs, Toda and Zygis2010).
The results of this study are also relevant for clinical practice. The complexity of the voicing contrast in fricatives is reflected in their late acquisition in typically developing children (Grunwell Reference Grunwell1987, Smit et al. Reference Smit, Hand, Frelinger, Bernthal and Bird1990, Grigos, Saxman & Gordon Reference Grigos, Saxman and Gordon2005) and voicing errors occur frequently in children and adults with speech disorders (Ansel & Kent Reference Ansel and Kent1992, Bunton & Weismer Reference Bunton and Weismer2002, Bernthal, Bankson & Flipsen Reference Bernthal, Bankson and Flipsen2009). The differences in the timing of tongue-to-palate contacts between voiced and voiceless fricatives reported in this study can be used to improve the diagnosis and treatment of fricatives. The results show that the dynamics of EPG patterns during fricative production should be taken into account, and not just static measurements, when diagnosing and treating abnormal voiced and voiceless fricative productions.
Acknowledgements
This research was supported by the grant 130-0000000-0785 of the Ministry of Science, Education and Sports of the Republic of Croatia. The authors would like to thank the three anonymous reviewers and Adrian Simpson for their helpful comments on an earlier version of the manuscript.


