1 Introduction
Forensic speaker comparison is a task carried out by phoneticians that entails comparing a voice in a questioned (usually criminal) recording with that of a known suspect in order to assist a court in determining identity or non-identity of speakers (Rose Reference Rose2002, Morrison Reference Morrison2009, Foulkes & French Reference Foulkes, French, Solan and Tiersma2012, French & Stevens Reference French, Stevens, Jones and Knight2013). The methods used in undertaking such comparisons are subject to variation both within and between jurisdictions. However, a recent survey of international practices conducted by two of the present authors (Gold & French Reference Gold and French2011) indicated that the predominant approach involves a combination of auditory-phonetic and acoustic analysis.Footnote 1 An optimal inventory of features that are examined within this approach is provided in French et al. (Reference French, Nolan, Foulkes, Harrison and McDougall2010) and Foulkes & French (Reference Foulkes, French, Solan and Tiersma2012). In addition to the many linguistic features listed in those sources, one finds ‘non-linguistic features characteristic of the speaker, for example patterns of audible breathing, throat-clearing, tongue clicking, and both filled and silent hesitation phenomena’ (French et al. Reference French, Nolan, Foulkes, Harrison and McDougall2010: 147, emphasis added). In respect of tongue clicking, Gold & French (Reference Gold and French2011) found that 57% of the practitioners they questioned examined recordings for the presence of velaric ingressive stops, and 18% considered them to be a highly discriminant feature. By ‘highly discriminant’ is meant a feature which is subject to a great deal of inter-speaker variation and little intra-speaker variation, and therefore one on which some reliance can be placed when it comes to differentiating between speakers.
2 Clicks in English
The paralinguistic function of clicks in English as conveyors of affective and attitudinal states has been widely recognized, if not empirically studied. For example, their role in indicating annoyance is noted in passing by Abercrombie (Reference Abercrombie1967: 31) and Ball (Reference Ball1989: 10). Their sympathy-conveying function is mentioned by Gimson (Reference Gimson1970: 34) and their role in expressing disapproval by Crystal (Reference Crystal1987: 126). More recently, research undertaken within a conversation analysis framework has focused on their role in the management of topic and turn-taking. Wright (Reference Wright2007, Reference Wright2011a, Reference Wrightb) provides a detailed and convincing analysis of the use of clicks in marking (i) the beginning of a new sequence or speaking turn, (ii) the disjunctive nature of talk that follows, and (iii) that a speaker is engaged in searching for a word.Footnote 2
In investigating clicks in respect of their speaker-discriminating potential we begin with the assumption that for any aspect of affect or interaction management there is no homological function–form relationship. For example, while one can signal annoyance, disapproval or sympathy by use of clicks, there are many other ways of signaling these states to interlocutors. Similarly, although clicks may be used to signal disjunction of conversational topic or the fact that one is having difficulty finding a word, other forms – semantically empty sounds or lexical expressions – can also fulfil these functions. In other words, there is an element of speaker choice in the selection of clicks over other possibilities in conveying emotive and attitudinal meaning as well as in respect of topic organization and conversational turn management. Given that this is so, one might reasonably expect there to be variability across speakers in terms of whether clicks or other forms are their preferred option. The possibility of such individual preferences provides a plausible theoretical motivation for the observation by the forensic practitioners surveyed by Gold & French (Reference Gold and French2011) that clicks have high value as speaker discriminants. However, while the proposition is credible and is no doubt based on practitioners’ casework experience, it has not to date been subject to formal, empirical testing. The present study is an attempt to establish the speaker discriminant value of one aspect of clicking behavior, namely frequency of clicking, by such testing.
3 Data
The recordings analyzed were of 100 male speakers of SSBE aged 18–25 years from the Dynamic Variability in Speech (DyViS) corpus (Nolan et al. Reference Nolan, McDougall, de Jong and Hudson2009). Two datasets were used, each of unscripted speech from a simulation of a forensically-relevant situation. One (Task 1) was a mock police interview. Each of the 100 speakers played the role of a criminal suspect and was interrogated by one of two project interviewers (Int2 and Int3), who played the role of a police officer investigating their supposed involvement in a crime. The second set of recordings (Task 2) was of the subjects telephoning an ‘accomplice’ and explaining what had occurred in the police interview. The role of the accomplice in this dataset was played by the same project interviewer (Int1) throughout. Although these were telephone conversations, the recordings used for analysis were made at the subjects’ end of the line, i.e. they were of studio rather than telephone quality.
4 Method
For a feature to function as a good speaker discriminant, it must meet two criteria: (i) it must vary widely across speakers, and (ii) it must be relatively stable within the speech production practices of individuals. In this section we outline the methods employed to test the intra- and inter-speaker variability of click rates. We begin with the Task 2 recordings, where each subject conversed with a single interlocutor, Int1.
The first two minutes of each recording were ignored to allow for speakers settling into the interaction. All subsequent speech from each subject up to a maximum of five minutes net – i.e. excluding long pauses and the speech of the interlocutor – was then extracted and divided into one-minute intervals (a combined total of 499 minutes). Of the 100 speakers, 99 produced enough speech to meet the five-minute target. One speaker (speaker 012) fell just short of this, and we therefore based our analysis on just four minutes of his speech. The extracted speech was examined auditorily by the first author during two listening sessions in Sony Sound Forge (version 10.0) and Praat (Boersma & Weenik Reference Boersma and Weenink2012) for instances of clicks. Any sounds that resembled clicks but were not apparently produced on a velaric ingressive airstream were excluded from the analysis. This resulted in the exclusion of 293 candidate sounds that were judged to be purely percussive. At the end of this process we were left with a total of 454 clicks. A sample of 15% of these was examined, checked and agreed by the second author for phonetic classification (i.e. the selection of the sample did not involve a ‘blind’ check and only items that were clearly clicks were selected).
Each click was assigned to a functional category – either conveying affective meaning, or to one of the interactional functions identified by Wright (Reference Wright2007, Reference Wright2011a, Reference Wrightb), i.e. initiating a new speaking turn, indicating topical disjunction or signalling that the speaker is searching for a word. Illustrations of these interactional functions are provided in the following transcribed excerpts from the recordings (clicks are indicated by symbol !):
(1)
(2)
(3)
5 Results
Before addressing our central questions of inter- and intra-speaker variability, we first present some general findings on phonetic and functional aspects of the clicks.
5.1 Phonetic properties of the clicks
The scope of the present study did not extend to a detailed analysis of the phonetic and acoustic properties of the clicks. However, in terms of place of articulation, approximately 95% were judged to be apical. With regard to the passive articulator, they ranged from dental to alveolar, to post-alveolar. The dental clicks are characterized by a longer and less well-defined release phase and by a higher frequency centre of gravity and lower level of intensity than the other variants. At the other extreme, palatal clicks are the highest in intensity, have a relatively short release and a greater concentration of energy at the lower frequencies. Without wishing to prejudge the outcome of further work we are undertaking on these data, we can say that, at this stage at least, place of articulation is proving very difficult to classify more finely, and that no individual speaker clearly stands out from the others in respect of this dimension.
5.2 Functional aspects of the clicks
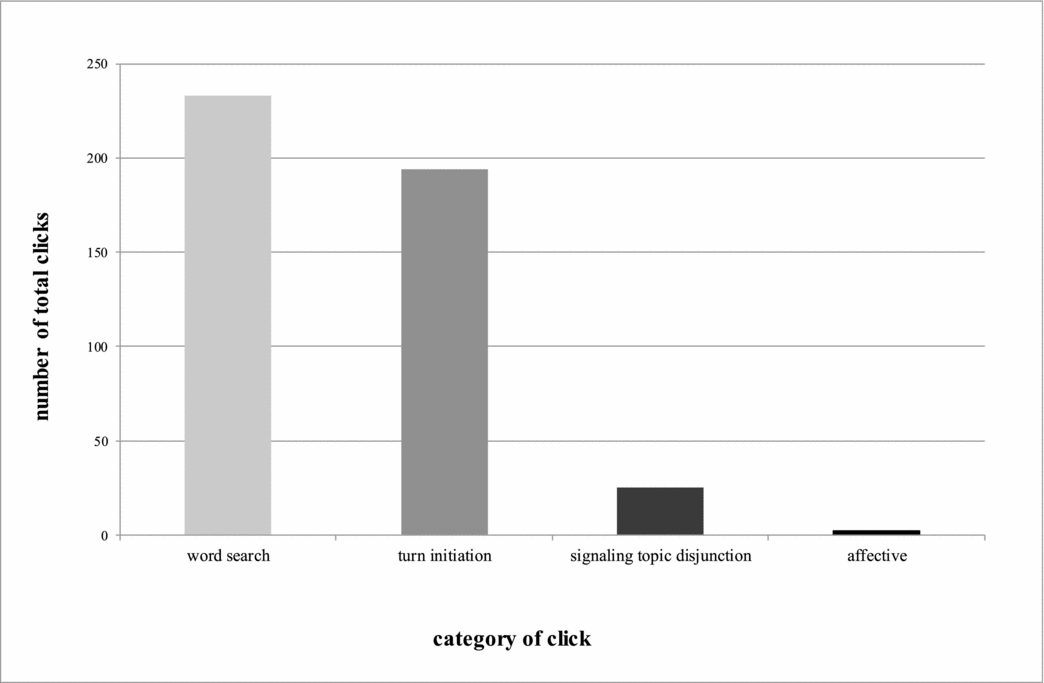
The distributions of clicks against affective function and the three interactional functions are represented in Figure 1.

Figure 1 Distribution of click occurrences by functional category.
Of the 454 clicks that occur in the combined 499 minutes of speech examined, word search indication makes up just over half of all clicks (51.32%). Taken together, turn initiation and signaling disjunction represent a proportion (48.24%) similar to those used to indicate word search. Affective use represents the smallest category with only two examples (0.44%). While this may to some extent be accounted for by the fact that the attitudinal stances that clicks are used to convey (pity, disapproval) seldom arise in the type of conversation represented in the DyViS recordings, it is nevertheless of interest that the least frequently occurring function in these data is the one that is most frequently mentioned in the phonetic literature.
5.3 Results: Inter-speaker variability
We turn now to inter-speaker variability in click production, first comparing clickers and non-clickers. As seen in Table 1, if one considers each sample in its entirety, the proportion of clickers to non-clickers is around 3:1 (74:25).
Table 1 Number of speakers that are clickers versus non-clickers over varying speech sample lengths.
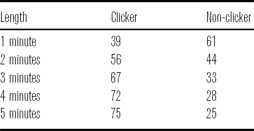
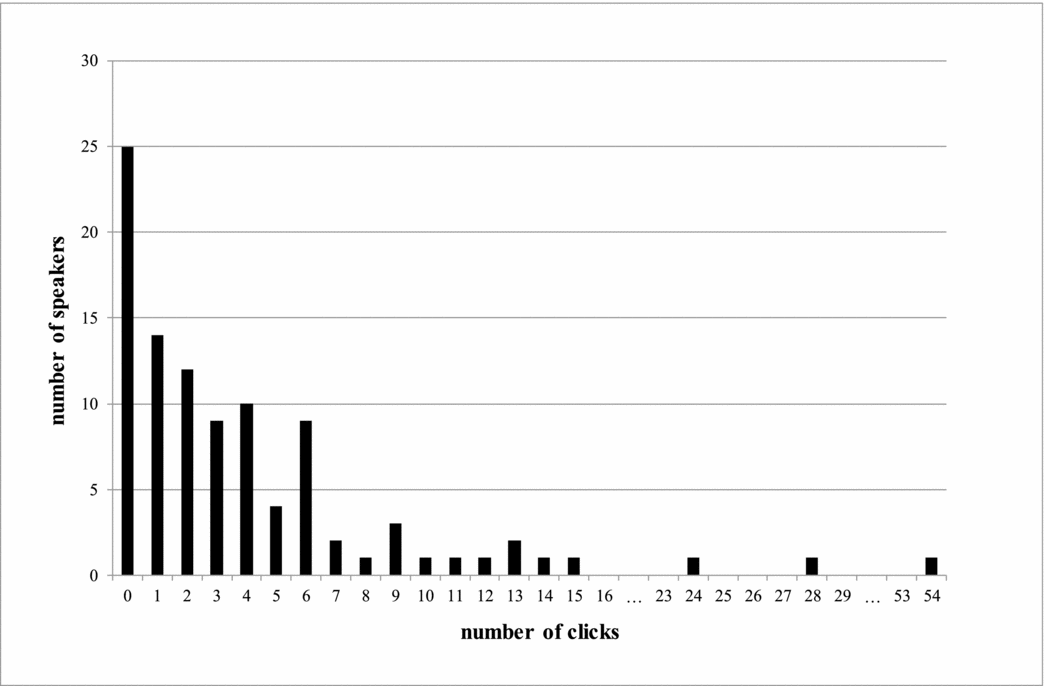
However, this proportion could not be arrived at by examining a shorter sample, as the number of non-clickers decreases with sample length owing to the fact that so many of the speakers click very infrequently. This can be seen from Figure 2, where it is apparent that 74% click five times or fewer over the five minute period, i.e. have a click rate of one per minute or less.

Figure 2 Distribution of click totals over five minutes of speech.
Approximately 50% of speakers click only once, twice or not at all. And while the mean number of clicks for the group as a whole is 4.26, this is highly skewed by three speakers with a very high numbers of clicks (24, 28, and 54). The mean number of clicks per speaker drops to 3.40 when the three most extreme outliers are removed.
Clicking as a measure, then, is highly sensitive to sample length, and it is not possible to specify a threshold duration for determining click rate, as this is dependent upon frequency of clicking. For example, to determine that someone has a click rate of, say, 0.2 clicks per minute, it would be necessary to have a sample of five minutes, during which time the speaker only clicks once. However, to establish that someone had a click rate of, say, 10 per minute, all one would need is one minute of speech or – indeed – less. This assumes, of course, that the clicks would be evenly distributed across time. And, as we see in the section below, such an assumption of intra-speaker stability is not supported by the data. For the present, however, we note that the low number of click totals for the majority of speakers makes discrimination difficult. Nevertheless, there is potential for clicks to be a good discriminant for the handful of speakers who produce high click totals, if they are relatively stable and consistent in their clicking behavior.
5.4 Results: Intra-speaker variability within an interaction
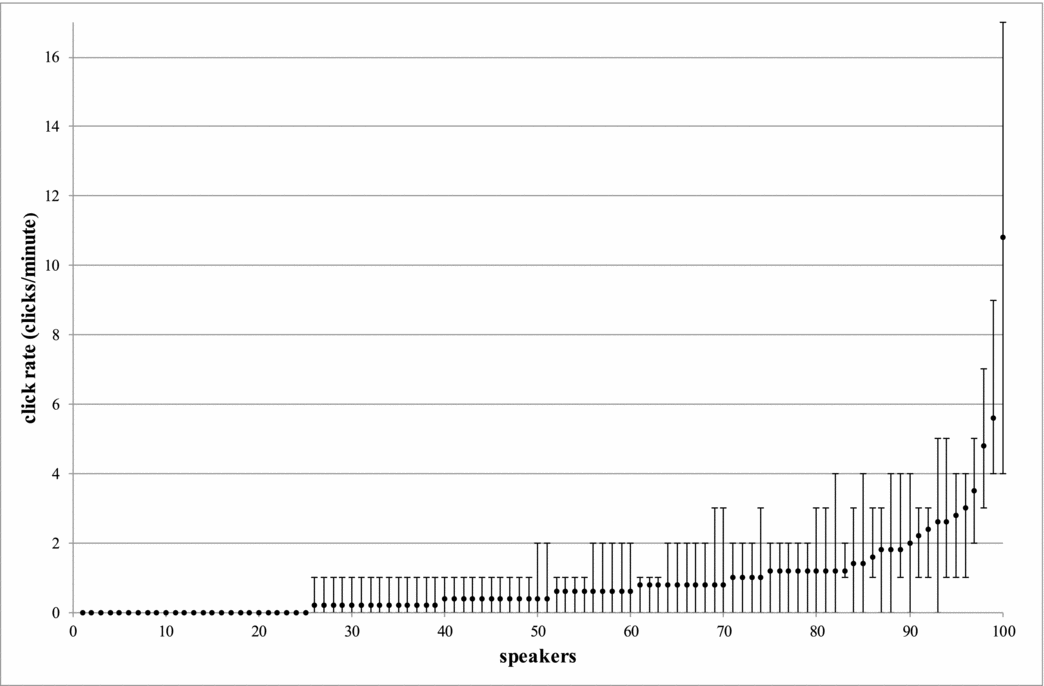
The results for intra-speaker variability are presented in Figure 3. Speakers are represented on the x-axis and the click rates (clicks per minute) on the y-axis. A speaker's mean click rate is represented by a black dot, and the vertical bars indicate the range between the minimum and the maximum click rates they attained in any individual minute of speech.

Figure 3 Click rate mean and range for all speakers.
It is clear from Figure 3 that intra-speaker stability generally decreases with mean click rate, such that the higher rate clickers have a greater range of variability across the individual minute blocks. Thus, even for those speakers for whom clicks might serve as a potentially discriminant feature, the clicks tend to occur in localized clusters rather than being evenly spread throughout the sample. This effectively means that in order to establish that someone has a high click rate, the analyst would need a relatively large amount of speech from them. In the forensic context questioned recordings containing one minute of net speech from the target speaker are usual. Five minutes of net speech is much less usual.Footnote 3 Thus, the possibility for using clicks as a discriminant feature in forensic casework, even for high rate clickers, is quite limited.
The sporadic distribution of clicks could be accounted for by the clustering of click opportunities. There is no reason to assume that the need to express the affective meanings and perform the interaction management functions that clicks can fulfill should be evenly spread across time. A more detailed analysis might therefore address the question of the occurrence of clicks as a proportion of ‘click opportunities’. Clustering of click opportunities can, of course, occur across interactions as well as within them, i.e. some types of conversation may well present more instances than others. For the present, however, we turn to another aspect of intra-speaker variability in clicking, namely possible accommodation effects.
5.5 Results: Intra-speaker variability across different interactions
Accommodation, the tendency for speakers to adjust their speech towards that of their interlocutor, has been well documented in respect of a range of linguistic features (see Giles Reference Giles1973, Trudgill Reference Trudgill, Hendrick, Mase and Miller1981, Shepard, Giles & LePoire Reference Shepard, Giles, LePoire, Robinson and Giles2001, Giles & Ogay Reference Giles, Ogay, Whaley and Samter2007).
The click data considered so far were all drawn from the Task 2 recordings of the DyViS dataset, where each of the 100 subjects conversed with the same interlocutor, Int1. The recorded interviews that make up the Task 1 recordings involved two different interlocutors, Int2 and Int3, conversing with the 100 subjects. The further work reported in this section was triggered by the informal observation that the subjects appeared to be clicking more frequently in the Task 1 recordings when speaking with Int2 and Int3 than in the Task 2 recordings when speaking with Int1. This observation prompted us to undertake two further analyses: (i) to establish subjects’ actual click rates in the Task 1 recordings relative to the Task 2 recordings, and (ii) to examine the click rates of Int2 and Int3 relative to Int1. The latter was undertaken with a view to determining whether any increase in subjects’ clicking behavior might be accounted for by an interlocutor accommodation effect.
Fifty subjects were selected at random from the Task 1 recordings, 25 speaking with Int2 and 25 speaking with Int3. As with the Task 2 sampling procedure, the first two minutes of the conversations were excluded from the analysis to allow for settling in time. Three minutes of net speech was extracted for each subject for comparison with an equivalent three-minute sample from the Task 2 recordings. Click rates were then compared across the two tasks. The comparisons showed that, although there was no statistically significant difference between the numbers of clickers and non-clickers (using a chi-squared test, where p = .7401 (Int1 to Int2) and p = .0880 (Int1 to Int3)), clickers did show a marked increase in click rate when speaking to Int2 and Int3 over Int1. The results are summarized in Table 2.
Table 2 Summary of speakers’ mean and median click rates – Int1 vs. Int2 and Int3.
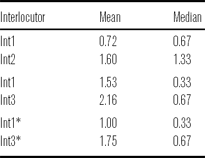
* Denotes rates with outlier excluded.
The increase across Int1 and Int2 is significant at the 1% level (using a Wilcoxon signed rank test, p = .0034 and n = 25). The increase across Int1 and Int3 falls just short of significance at this level (1%), but achieves it if one speaker whose high click rate (speaker 07's click rate is 14.33 clicks/min for Task 1 and 12 clicks/min for Task 2) is excluded as an outlier (Wilcoxon signed rank test, p = .0076 and n = 24).
The actual changes – mean, minimum and maximum – for speakers in the transition from Int1 to Int2 and Int1 to Int3 are represented in Tables 3 and 4.
Table 3 Changes in click rate across speakers for Int1 vs. Int2.

Table 4 Changes in click rate across speakers for Int1 vs. Int3.

In attempting to account for the increases in click rates when subjects speak to Int2 and Int3, click rates for Int2 and Int3 were calculated from three randomly selected Task 1 recordings. The sampling procedure entailed extracting three minutes of net speech after the settling-in period, thus providing a total net sample of nine minutes for each interlocutor. For Int1 we extracted an equivalent portion of post-settling in speech from the Task 2 recordings with the same three subjects selected for Int2 and Int3, thereby providing a total net sample of 18 minutes. The mean click rates for the three are set out in Table 5.
Table 5 Mean click rates of the three interlocutors.

Given the click rates established for subjects from the Task 2 recordings, Int1 might be seen as a relatively average clicker. However, Int2 and Int3 would be considered relatively high rate clickers. In view of this, and given the authority associated with the project workers in conducting the interactions, a plausible explanation of the increased click rates of the subjects when conversing with Int2 and Int3 would be that they are accommodating their clicking behavior towards that of their interlocutors.Footnote 4 An alternative, or indeed additional, explanation of the differences might be that the Task 1 interactions embed more clicking opportunities, there being mock police interviews where the subjects are asked questions that might well have them searching for words in answering. However, this would not account for the relatively high click rates of Int2 and Int3, and although we currently have no formal findings to present on this, the clear impression is that there is no obvious click opportunity differential.
6 Conclusion
While it would be dangerous to generalize beyond the variety of English analyzed in this study, the view of those forensic practitioners surveyed by Gold & French (Reference Gold and French2011) who considered tongue clicking to be a highly discriminant feature of speaker behavior is largely unsupported by the present data from younger male speakers of SSBE. First, there is insufficient variation across the majority of speakers analyzed for the variable to provide a reliable index of speaker individuality. Secondly, even for the high rate clickers who stand apart from the majority, there is within-conversation instability to the extent that one would need speech samples of a length seldom encountered in questioned forensic recordings in order to reliably establish an overall click rate. Thirdly, intra-speaker variability also occurs across interactions, apparently as a result of accommodation towards the clicking behavior of interlocutors. This suggests that rate of clicking, rather than being solely a property of an individual's speech production practices, might usefully be viewed as resulting from an interaction between speaker and interlocutor. The question remains, then, of whether it is worth considering clicking at all when conducting speaker comparison casework. Despite our findings, we would suggest that, in certain cases, it may well be. Studies such as those of Wright (Reference Wright2007, Reference Wright2011a, Reference Wrightb) and Ogden (Reference Ogden2013) on the interactional functions of clicks, as well as the general observations of phoneticians on their functions in conveying attitudinal and affective meanings, provide normative data and descriptions that would allow forensic practitioners to assess the speech samples they examine for the occurrence of non-normative, i.e. idiosyncratic, usage. Such occurrences may be of assistance in the comparison task, and in this respect forensic phoneticians are indebted to their non-forensic counterparts for providing valuable resources.Footnote 5 However, unless it were to transpire that patterns of clicking behavior are different for other varieties of English or differ in accordance with speaker age or gender – and we have found nothing in the sociolinguistic literature on English to support that view – the mere comparison of click rates across samples is in the overwhelming majority of cases unlikely to advance the speaker comparison task for the reasons outlined above.
Acknowledgements
This project is part of the Bayesian Biometrics for Forensics (BBfor2) Network and funded by Marie Curie Actions EC Grant Agreement No. PITN-GA-2009-238803. The views represented in this paper reflect those of the authors and are not necessarily held by the European Commission. Thanks go to Adrian Simpson for putting this special issue of JIPA together. As well as a big thank you to Louisa Stevens and three anonymous reviewers for their helpful and insightful comments on this article.


