


INTRODUCTION
Measurement of Cognitive Decline
The Uniform Dataset (UDS) neuropsychological battery from the National Alzheimer’s Coordinating Center is in its third revision (Weintraub et al., Reference Weintraub, Besser, Dodge, Teylan, Ferris, Goldstein, Giordani, Kramer, Loewenstein, Marson, Mungas, Salmon, Welsh-Bohmer, Zhou, Shirk, Atri, Kukull, Phelps and Morris2018) and has already generated considerable clinical research interest. It has been cross-validated with existing measures (Monsell et al., Reference Monsell, Dodge, Zhou, Bu, Besser, Mock, Hawes, Kukull and Weintraub2016) and normative data on over 3000 healthy older adults (Weintraub et al., Reference Weintraub, Besser, Dodge, Teylan, Ferris, Goldstein, Giordani, Kramer, Loewenstein, Marson, Mungas, Salmon, Welsh-Bohmer, Zhou, Shirk, Atri, Kukull, Phelps and Morris2018) have been published. Additionally, discrepancy scores and derived measures have been created (Devora, Beevers, Kiselica, & Benge, Reference Devora, Beevers, Kiselica and Benge2019). A critical next step toward the promulgation of this battery is addressing core psychometric questions pertinent to its interpretation and use.
Factor analytic studies in particular are critical to address these questions and provide evidence for construct validity. Construct validity is established by an accumulation of findings that a measure captures a phenomenon of interest, most commonly by testing whether measures function as predicted by theory (Cronbach & Meehl, Reference Cronbach and Meehl1955). Factor analysis assesses the extent to which directly observed variables load onto latent factors, as well as the relationships among those factors. Thus, it provides direct evidence for construct validity and is now considered a standard practice in measure validation (Thompson & Daniel, Reference Thompson and Daniel1996). Ethical guidelines and professional standards emphasize the need to utilize tests with empirical evidence of construct validity, such that factor analytic studies are necessary if the UDS neuropsychological battery is to be implemented in practice [American Educational Research Association, American Psychological Association, National Council on Measurement in Education, & Joint Committee on Standards for Educational and Psychological Testing (2014)].
In addition, factor analysis allows for data reduction. The UDS 3.0 neuropsychological battery (UDS3NB) includes 21 individual cognitive scores in its published normative calculator, as well as a host of available item-level data and derived or discrepancy indices that can be calculated from the core tests (Devora et al., Reference Devora, Beevers, Kiselica and Benge2019; Weintraub et al., Reference Weintraub, Besser, Dodge, Teylan, Ferris, Goldstein, Giordani, Kramer, Loewenstein, Marson, Mungas, Salmon, Welsh-Bohmer, Zhou, Shirk, Atri, Kukull, Phelps and Morris2018). These observed scores likely tap shared and overlapping constructs of interest to clinical researchers (e.g., memory as a single value as opposed to five scores that could be used to assess this construct in the battery). Factor analytic processes allow for exploration of the variance common across observed measures and the extraction of indices less impacted by measurement error that constitute fairly pure representations of domains of interest (Thompson, Reference Thompson2004). Factor scores thus may allow for fewer variables to be employed across studies, increasing the power to detect findings and allowing a common language of cognitive factors to be utilized.
Applying a Latent Variable Approach to the UDS Battery
Factor analytic methods have been applied to past versions of the UDS. For instance, Hayden and colleagues (Reference Hayden, Jones, Zimmer, Plassman, Browndyke, Pieper, Warren and Welsh-Bohmer2011) conducted an exploratory factor analysis of the UDS 2.0 neuropsychological test battery, followed by a series confirmatory factor analyses (CFAs). They found evidence for a four-factor structure, including memory, attention, executive functioning, and language domains. Subsequently, this group found evidence that patterns of performance on these factor scores predicted conversion to dementia in the UDS sample; that is, individuals with poor performance across all factors were at greater risk for developing dementia than those who performed well across cognitive domains (Hayden et al., Reference Hayden, Kuchibhatla, Romero, Plassman, Burke, Browndyke and Welsh-Bohmer2014).
Since this work, the UDS neuropsychological battery has been updated in several important ways for the release of version 3.0 (Monsell et al., Reference Monsell, Dodge, Zhou, Bu, Besser, Mock, Hawes, Kukull and Weintraub2016; Weintraub et al., Reference Weintraub, Salmon, Mercaldo, Ferris, Graff-Radford, Chui, Cummings, DeCarli, Foster, Galasko, Peskind, Dietrich, Beekly, Kukull and Morris2009, Reference Weintraub, Besser, Dodge, Teylan, Ferris, Goldstein, Giordani, Kramer, Loewenstein, Marson, Mungas, Salmon, Welsh-Bohmer, Zhou, Shirk, Atri, Kukull, Phelps and Morris2018). First, the Wechsler Memory Scales-Revised Logical Memory and Digit Span (Wechsler, Reference Wechsler1987) subtests have been replaced with the Craft Story (Craft et al., Reference Craft, Newcomer, Kanne, Dagogo-Jack, Cryer, Sheline, Luby, Dagogo-Jack and Alderson1996) and Number Span tests, respectively. Second, the Boston Naming Test (Goodglass, Kaplan, & Barresi, Reference Goodglass, Kaplan and Barresi2000) has been replaced with the Multilingual Naming Test (MINT) (Ivanova, Salmon, & Gollan, Reference Ivanova, Salmon and Gollan2013). Third, a measure of visuoconstruction and visuospatial recall, the Benson Figure (Possin, Laluz, Alcantar, Miller, & Kramer, Reference Possin, Laluz, Alcantar, Miller and Kramer2011), and a letter fluency task have been added. Fourth, the psychomotor coding task has been removed. These changes necessitate reconsideration of the factors that are measured by the revised battery.
In addition, alternative, and as yet untested, conceptualizations of the UDS factor structure require examination. For example, higher order models of cognition, including a general cognitive factor, may be more accurate models of neuropsychological functioning. (Jensen, Reference Jensen1998; Wechsler, Reference Wechsler2008). Indeed, one study indicated that the UDS 2.0 neuropsychological measures covary highly and tend to load on a unitary factor (Gavett et al., Reference Gavett, Vudy, Jeffrey, John, Gurnani and Adams2015). This finding suggests that both unitary and multi-factor models of the UDS 3.0 need to be explored. Additionally, it will be important to examine the most commonly supported model of cognition, the higher order model, which includes a superordinate general factor and subordinate specific factors (Reeve & Blacksmith, Reference Reeve and Blacksmith2009; Schneider & McGrew, Reference Schneider, McGrew, Flanagan and McDonough2018).
The Importance of Normative Factor Scores
Establishing the factor structure of the UDS3NB is important to provide evidence of construct validity and allow for data reduction. However, this knowledge is of limited utility if factor scores cannot be extracted and interpreted. Thus, another important step toward making the UDS3NB a user-friendly clinical and research tool will consist of establishing a method for deriving factor scores and understanding what they mean for individuals. This goal is particularly important when considering the increased focus on identifying individuals in pre-clinical or prodromal stages of cognitive decline (Jack et al., Reference Jack, Bennett, Blennow, Carrillo, Dunn, Haeberlein, Holtzman, Jagust, Jessen, Karlawish, Liu, Molinuevo, Montine, Phelps, Rankin, Rowe, Scheltens, Siemers, Snyder, Sperling, Elliott, Masliah, Ryan and Silverberg2018). Indeed, many current clinical trials are specifically recruiting individuals in these early stages of neurodegenerative disease (Cummings, Lee, Ritter, Sabbagh, & Zhong, Reference Cummings, Lee, Ritter, Sabbagh and Zhong2019) where frank cognitive impairments are lacking, though subtle transitional cognitive declines may exist (Jack et al., Reference Jack, Bennett, Blennow, Carrillo, Dunn, Haeberlein, Holtzman, Jagust, Jessen, Karlawish, Liu, Molinuevo, Montine, Phelps, Rankin, Rowe, Scheltens, Siemers, Snyder, Sperling, Elliott, Masliah, Ryan and Silverberg2018; Kiselica, Kaser, & Benge, Reference Kiselica, Kaser and Bengein preparation; Kiselica, Webber, & Benge, Reference Kiselica, Webber and Bengeunder review). The development of normative data for factor scores will allow comparison of individual test performances, such that expected versus abnormal scores can be delineated in the earliest stages of neurodegenerative disease. It is also essential to establish that factor scores can be utilized with varied populations within the normative sample by establishing measurement invariance to ensure wide applicability of these metrics.
Current Study
There were three main goals of the current study:
(1) Identify the underlying factor structure of the UDS3NB in sample of cognitively intact individuals. Our a priori hypothesis is that four lower order factors (memory, attention, visual/executive, and language) would emerge, as well as a higher-level general cognitive abilities factor.
(2) Establish metric invariance of factor scores across demographic groups (i.e., age, sex, and education) and over time to provide evidence that factor scores can be extracted and applied uniformly in these populations over serial evaluations.
(3) Use a regression-based technique to extract factor scores from the sample, and present a calculator to allow researchers and clinicians to calculate demographically corrected factor scores in their own samples, similar to prior work with the UDS (Devora et al., Reference Devora, Beevers, Kiselica and Benge2019; Shirk et al., Reference Shirk, Mitchell, Shaughnessy, Sherman, Locascio, Weintraub and Atri2011; Weintraub et al., Reference Weintraub, Besser, Dodge, Teylan, Ferris, Goldstein, Giordani, Kramer, Loewenstein, Marson, Mungas, Salmon, Welsh-Bohmer, Zhou, Shirk, Atri, Kukull, Phelps and Morris2018).
METHODS
Sample
We requested all available UDS data through the National Alzheimer's Coordinating Center (NACC) portal on 29 January 2019. Data included 39,412 participants from 39 Alzheimer’s Disease Research Centers. Data were collected under the auspices of the Institutional Review Board (IRB) at the respective institutions and were provided in a deidentified format. This study was exempt from IRB review, given that it consisted of secondary analyses of deidentified data. The research was completed in accordance with the Helsinki declaration.
The sample was restricted to English speaking individuals (n = 36,134) given that several measures used for analyses were language-based. Next, the sample was reduced to individuals who received the UDS 3.0 at their initial visit (n = 6042), which included data collected from March 2015 through December 2018, because this study focused specifically on the factor structure of the UDS 3.0. The dataset was then reduced to those individuals diagnosed as cognitively normal (n = 2520) in keeping with prior research using the UDS (Devora et al., Reference Devora, Beevers, Kiselica and Benge2019; Shirk et al., Reference Shirk, Mitchell, Shaughnessy, Sherman, Locascio, Weintraub and Atri2011; Weintraub et al., Reference Weintraub, Besser, Dodge, Teylan, Ferris, Goldstein, Giordani, Kramer, Loewenstein, Marson, Mungas, Salmon, Welsh-Bohmer, Zhou, Shirk, Atri, Kukull, Phelps and Morris2018), as well as common practice in publishing normative data (e.g., Wechsler, Reference Wechsler2008).
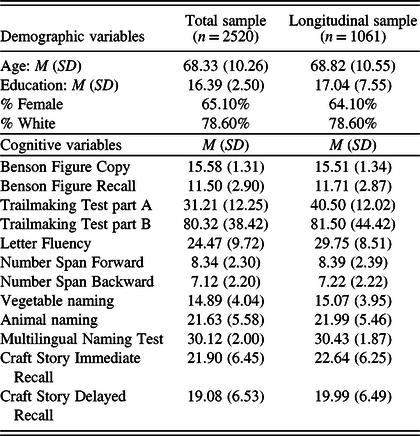
Classification of cognitive status was based on UDS consensus decision, as well as the Clinical Dementia Rating (CDR) Dementia Staging Instrument ®, a reliable and valid clinical interview for staging the severity of cognitive and functional declines among individuals with neurodegenerative diseases (Fillenbaum, Peterson, & Morris, Reference Fillenbaum, Peterson and Morris1996; Morris, Reference Morris1993, Reference Morris1997). The CDR has a global rating scale that divides patients into cognitively normal (0), MCI/mild dementia (.5), and dementia (>.5) stages. Thus, individuals needed a CDR score of zero to be included in the analyses. Finally, we utilized a subset of these participants with available 1-year follow-up data to investigate invariance of the UDS3NB factor structure over time (n = 1061). Descriptive statistics for these samples are provided in Table 1.
Table 1. Descriptive statistics for raw scores of study variables for the total and longitudinal samples
Measures
Measures in the UDS 3.0 battery are described in detail elsewhere (Besser et al., Reference Besser, Kukull, Knopman, Chui, Galasko, Weintraub, Jicha, Carlsson, Burns, Quinn, Sweet, Rascovsky, Teylan, Beekly, Thomas, Bollenbeck, Monsell, Mock, Zhou, Thomas, Robichaud, Dean, Hubbard, Jacka, Schwabe-Fry, Wu, Phelps and Morris2018; Weintraub et al., Reference Weintraub, Besser, Dodge, Teylan, Ferris, Goldstein, Giordani, Kramer, Loewenstein, Marson, Mungas, Salmon, Welsh-Bohmer, Zhou, Shirk, Atri, Kukull, Phelps and Morris2018). In brief, the UDS 3.0 includes (1) the Craft Story (Craft et al., Reference Craft, Newcomer, Kanne, Dagogo-Jack, Cryer, Sheline, Luby, Dagogo-Jack and Alderson1996), a measure of immediate and delayed recall of orally presented story information (though both verbatim recall and thematic unit scores can be calculated, verbatim recall points were used for the current study); (2) the Benson Figure, which includes a figure copy trial and a delayed figure recall trial (Possin et al., Reference Possin, Laluz, Alcantar, Miller and Kramer2011); (3) Number Span Forwards and Backwards (total score used for the current study); (4) the MINT, a confrontation naming test (Gollan, Weissberger, Runnqvist, Montoya, & Cera, Reference Gollan, Weissberger, Runnqvist, Montoya and Cera2012; Ivanova et al., Reference Ivanova, Salmon and Gollan2013); (5) letter (F- and L-words) and semantic fluency (animals and vegetables) tasks; and (6) Trailmaking Test parts A and B, which evaluate simple number sequencing and letter-number sequencing, respectively (Partington & Leiter, Reference Partington and Leiter1949).
Analyses
Confirmatory factor analyses
The Lavaan program (Rosseel, Reference Rosseel2012) in R (RStudio Team, 2015) was used to conduct CFAs. All cognitive variables were Z-scored before model entry. Global model fit was examined using the χ2, comparative fit index (CFI), Tucker-Lewis Index (TLI), root mean square error of approximation (RMSEA), and the standardized root mean residual (SRMR). Improved model fit is suggested by a lower (and ideally non-significant) χ2 value, CFI and TLI values closer to one (>.90 for acceptable fit and >.95 for good fit), and RMSEA and SRMR values closer to zero (<.08 for acceptable fit and <.05 for good fit, respectively; Hooper, Coughlan, & Mullen, Reference Hooper, Coughlan and Mullen2008; Hu & Bentler, Reference Hu and Bentler1999). Changes in CFI (>.01; Cheung & Rensvold, Reference Cheung and Rensvold2002), RMSEA (>.015; Chen, Reference Chen2007), TLI (>.05; Little, Reference Little1997), and SRMR (>.03; Chen, Reference Chen2007) indicated superior fit when evaluating fit between models.
Three potential models were examined:
(1) A unitary model, wherein all cognitive variables loaded onto a single factor, and residual covariances were allowed between Trailmaking parts A and B, as well as between animal and vegetable fluency, to account for method variance.
(2) A four-factor correlated model that included memory, attention, processing speed/executive functioning, and language domains, consistent with previous findings with the UDS 2.0 (Hayden et al., Reference Hayden, Jones, Zimmer, Plassman, Browndyke, Pieper, Warren and Welsh-Bohmer2011). The memory factor was composed of Craft Story immediate and delayed recall scores, as well as the Benson Figure delayed recall score. Next, the attention factor included the two Number Span variables. The executive functioning variable included Trailmaking parts A and B, as in the Hayden and colleagues paper (Reference Hayden, Jones, Zimmer, Plassman, Browndyke, Pieper, Warren and Welsh-Bohmer2011). Additionally, the Benson Figure copy was added to this factor, given research suggesting that complex visuoconstruction tasks involve executive skills, such as planning and organization (Possin et al., Reference Possin, Laluz, Alcantar, Miller and Kramer2011; Shin, Park, Park, Seol, & Kwon, Reference Shin, Park, Park, Seol and Kwon2006). Another executive task, letter fluency (Henry & Crawford, Reference Henry and Crawford2004; Lezak, Howieson, & Loring, Reference Lezak, Howieson and Loring2012; Varjacic, Mantini, Demeyere, & Gillebert, Reference Varjacic, Mantini, Demeyere and Gillebert2018), was also modeled on the processing speed/executive functioning factor. Finally, the latent language variable was comprised of the two semantic fluency scores, as well as the MINT score. Again, residual covariances were allowed between Trailmaking parts A and B, as well as between animal and vegetable fluency, to account for method variance.
(3) A higher order model that included the above four first-order factors (specified as orthogonal), as well as a superordinate general cognitive ability factor, composed of the four first-order factors.
After examination of global fit indices, models were respecified to improve fit based upon review of the local pattern of factor loadings and modification indices (Kline, Reference Kline2011).
Measurement invariance
Measurement invariance was assessed using the Lavaan program (Rosseel, Reference Rosseel2012) in R (RStudio Team, 2015) following the procedures of van de Schoot, Lugtig, and Hox (Reference van de Schoot, Lugtig and Hox2012). First, the best-fitting model was specified across groups to assure that the basic structure of the CFA was held and established configural invariance. Second, the factor structure and factor loadings were held constant across groups to test for metric invariance. This was considered the minimum level of invariance required to establish that factor scores could be extracted uniformly for the normative calculator. Third, the factor structure, loadings, and intercepts were held constant across groups to test for scalar invariance. Finally, the factor structure, loadings, intercepts, and residual variances were fixed to be equal across groups to test for strict invariance.
Each increasingly restrictive model is compared against the previous model to evaluate for changes in fit. Measurement invariance was considered established at the most restrictive level (i.e., configural, metric, scalar, or strict), wherein an unacceptable decrement in fit did not occur when adding additional constraints. Evaluation of invariance was completed by using the RMSEA and CFI rules for interpretation of change in fit described in the previous section. We completed invariance testing for several demographic variables, including sex, age (participants divided into <60, 60–79, and ≥80 age groups), and education (participants divided into groups with ≤12, 13–15, ≥16 years of education). Additionally, measurement invariance for a subsample of participants with 1-year follow-up data available (n = 1061) was evaluated to ensure the stability of the factor structure across serial assessments.
Demographic influences and normative calculator
Once the factor structure of the UDS3NB was established and determined to demonstrate metric invariance, we created a calculator for estimating demographically adjusted scores based on the normative sample. Examination of demographic influences followed the procedures of previous normative evaluations of the UDS 3.0 (Devora et al., Reference Devora, Beevers, Kiselica and Benge2019; Shirk et al., Reference Shirk, Mitchell, Shaughnessy, Sherman, Locascio, Weintraub and Atri2011; Weintraub et al., Reference Weintraub, Besser, Dodge, Teylan, Ferris, Goldstein, Giordani, Kramer, Loewenstein, Marson, Mungas, Salmon, Welsh-Bohmer, Zhou, Shirk, Atri, Kukull, Phelps and Morris2018). Specifically, each factor score was regressed on age, education, and sex (entered as a block) using SPSS 25.0 (IBM Corp., 2017). Regression coefficients from this analysis were then used to create formulas for demographically adjusted scaled scores. These formulas were then employed in Microsoft Excel to create a user-friendly calculator that would convert raw test data from the UDS 3.0 to a series of normative factor scaled scores for application in research and applied settings. This calculator is available in the online supplementary material.
RESULTS
Confirmatory Factor Analyses
Results of CFA analyses are presented in Table 2. The unitary model was a poor fit to the data. The four-factor correlated model yielded an improvement in fit; however, the overall model fit was inadequate, and there were weak to very strong correlations between the factors (.28 ≤ r ≤ 1.00). Consequently, a higher order structure that captured the common variance across these factors was explored. This higher order model fit the data similarly to the four-factor model, and the difference in model fit fell below recommended thresholds for meaningful change. Given that the higher order model of cognition has long been supported by theory and empirical work and captures meaningful variance among specific factors (Gavett et al., Reference Gavett, Vudy, Jeffrey, John, Gurnani and Adams2015; Reeve & Blacksmith, Reference Reeve and Blacksmith2009; Schneider & McGrew, Reference Schneider, McGrew, Flanagan and McDonough2018), this model was chosen for respecification.
Table 2. Model fit statistics for confirmatory factor analyses

The loadings for the two Benson Figure variables were low (.21 for the figure copy variable loading onto the Speed/Executive factor and .28 for the figure recall variable loading onto the Memory factor). Consequently, the model was respecified to include a separate first-order visual factor. This step resulted in a substantial improvement in model fit (see the Modified Higher Order Model column of Table 2) and guided selection of this model as the optimal factor model (see Figure 1 for a visual representation).

Fig. 1. The best-fitting model for factor structure of cognitive measures in the UDS 3.0 neuropsychological battery. Standardized factor loadings for each variable are presented to the left of the relevant arrows. All loadings were significant at the p < .001 level.
Measurement Invariance
Results of measurement invariance testing are presented in Table 3. The overall model provided a good fit for both men and women, and there was not a substantial decrease in fit when factor structure and loadings were held constant. However, fit declined to unacceptable levels when factor structure, loadings, and intercepts were held constant based on the change in the CFI and RMSEA (ΔCFI = .025, ΔRMSEA = .025). Thus, there was evidence for metric invariance across sexes.
Table 3. Model fit results for invariance testing

Note: Bolded rows indicate the highest level of measurement invariance evidenced by the data.
The overall model also provided a good fit across age groups, and fit remained similar when factor structure and loadings were constrained to be equal across age categories. However, a meaningful decrement in fit was found when factor structure, loadings, and intercepts were held equal based on the CFI (ΔCFI = .023). Therefore, there was evidence for metric invariance across age groups.
The overall model fit well across education categories with no clear decrease in fit when factor structure, loadings, and intercepts were held constant across education groups. However, an unacceptable decrease in fit was noted when residual variances were also held constant. Thus, there was evidence for scalar invariance across education groups.
Finally, we assessed measurement invariance across baseline and 1-year follow-up visits. The model fit well across time with no decrement in fit when factor structure, loadings, intercepts, and residual variances were constrained to be equal across evaluation points. Hence, there was evidence for strict invariance of the model over time.
Demographic Influences and Normative Calculator
Scores from the general, processing speed/executive, visual, memory, and attention factors were extracted using the regression-based method. Next, each factor score was regressed onto age, sex, and education. As can be seen in Table 4, age demonstrated a significant negative relationship with all cognitive factor scores, whereas education was significantly positively related to all scores. Female sex was significantly associated with better cognitive performance on the general, speed/executive, memory, and language factors. However, sex was not a significant predictor of performance on the visual and attention factors. The impact of demographic variables on cognitive factor scores ranged from small (in the case of attention and memory) to moderate or large (in the case of general abilities, processing speed/executive, visual abilities, and language abilities). The factor score calculator derived from these analyses is found in the online supplementary materials.
Table 4. Results of linear regression of cognitive variables on demographic variables

Note: Male coded as 1, female coded as 2. **p < .01, ***p < .001.
DISCUSSION
The goals of the current study were to examine the factor structure of the UDS3NB, establish at least metric invariance of the UDS3NB measures across demographic groups and time, and extract demographically adjusted factor scores to create a user-friendly Excel calculator.
Factor Structure of the UDS3NB
In contrast research with the UDS2NB, which did not include tests of higher order factor models (Hayden et al., Reference Hayden, Jones, Zimmer, Plassman, Browndyke, Pieper, Warren and Welsh-Bohmer2011), we found evidence for a higher order model of cognition when using UDS3NB data in a large national sample, consisting of lower order attention, visual, processing speed/executive, memory, and language factors, as well as a higher order general cognitive factor. This finding fits with a wealth of previous research, which suggests that a higher order model of cognition represents the best conceptualization of cognitive abilities (Reeve & Blacksmith, Reference Reeve and Blacksmith2009; Schneider & McGrew, Reference Schneider, McGrew, Flanagan and McDonough2018). Notably, the addition of a visuoconstruction and recall task in the UDS3NB battery resulted in evidence for an additional visual factor not found in the UDS2NB (Hayden et al., Reference Hayden, Jones, Zimmer, Plassman, Browndyke, Pieper, Warren and Welsh-Bohmer2011).
Measurement Invariance
Once this best-fitting structure of cognition was established, we investigated measurement invariance across demographic groups and time. Importantly, at least metric invariance was established for all variables, suggesting that factor scores can be extracted uniformly across sexes, ages, and education levels and in the context of 1-year repeated evaluations. However, the level of measurement invariance differed, depending on the variable.
Findings regarding education and time were consistent with past research. Regarding education, we found evidence for scalar invariance. This result suggests that that factor structure, loadings, and intercepts are equivalent across individuals of varying levels of formal education and conforms with the results reported by Rawlings et al. (Reference Rawlings, Bandeen-Roche, Gross, Gottesman, Coker, Penman, Sharrett and Mosley2016). Similarly, we reported evidence for strict invariance over time, replicating the findings of Hayden et al. (Reference Hayden, Jones, Zimmer, Plassman, Browndyke, Pieper, Warren and Welsh-Bohmer2011) with the UDS2NB. Thus, the measurement characteristics of the UDS3NB variables do not change in serial evaluation over a 1-year time span in unimpaired older adults.
Past research on measurement invariance across sexes and age groups among older adults has been mixed, likely due to differences in the batteries administered and the recruitment criteria used to select participants. For instance, past studies found evidence for scalar (Dowling, Hermann, La Rue, & Sager, Reference Dowling, Hermann, La Rue and Sager2010), strict (Rawlings et al., Reference Rawlings, Bandeen-Roche, Gross, Gottesman, Coker, Penman, Sharrett and Mosley2016), or partial strict invariance (Niileksela, Reynolds, & Kaufman, Reference Niileksela, Reynolds and Kaufman2013) across age groups. We did not replicate any of these findings, instead finding evidence for metric invariance, suggesting that loadings were equivalent across age groups but intercepts and residual variances differed. Variables most impacted by age included the memory indicators and memory factor, though allowing these intercepts to vary across demographic groups did not improve the fit of the scalar model: χ2(171) = 743.28, p < .001, CFI = .931, and RMSEA = .064.
For sex, there was evidence for metric invariance, suggesting that the factor structure and loadings of the UDS3NB were equivalent for men and women, while intercepts and residual variances differed. Similar results were found in a sample of older adults administered the Atherosclerosis Risk in Communities Neurocognitive Study neuropsychological battery (Rawlings et al., Reference Rawlings, Bandeen-Roche, Gross, Gottesman, Coker, Penman, Sharrett and Mosley2016), though other authors have reported strict invariance of cognitive batteries by sex (Blankson & McArdle, Reference Blankson and McArdle2015). Post-hoc examination of group differences in intercepts revealed that the largest difference occurred on the vegetable naming variable, with the intercept for women being higher than men.Footnote 1 This finding may reflect gender role differences in involvement in activities requiring knowledge of vegetable names, such as meal planning, grocery shopping, and meal preparation, which have historically been completed more often by women (Harnack, Story, Martinson, Neumark-Sztainer, & Stang, Reference Harnack, Story, Martinson, Neumark-Sztainer and Stang1998).
Extracted Factor Scores
After demonstrating at least metric invariance across time and demographic groups, we extracted factor scores using a regression-based approach. Extracted factor scores were associated with demographic variables in a manner consistent with prior research. Indeed, cognitive abilities are expected to decline with age (Salthouse, Reference Salthouse2010), and all cognitive factor scores were significantly negatively related to age in the normative sample. Similarly, research consistently finds a positive correlation between years of education and cognitive performance (Lenehan, Summers, Saunders, Summers, & Vickers, Reference Lenehan, Summers, Saunders, Summers and Vickers2015), and such a relationship emerged as significant for all cognitive factor scores in the normative sample.
Sex differences also emerged on the cognitive factors with female sex being associated with improved performance on the general, speed/executive, memory, and language factors. Consistent with our findings, research on sex differences in cognition tends to support the notion that women perform better than men on verbal memory tests (Ferreira, Santos-Galduróz, Ferri, & Galduróz, Reference Ferreira, Santos-Galduróz, Ferri and Galduróz2014). However, examination of other cognitive domains has yielded mixed results (Duff, Schoenberg, Mold, Scott, & Adams, Reference Duff, Schoenberg, Mold, Scott and Adams2011; Kaplan et al., Reference Kaplan, Cohen, Moscufo, Guttmann, Chasman, Buttaro, Hall and Wolfson2009; Li & Hsu, Reference Li and Hsu2015; Munro et al., Reference Munro, Winicki, Schretlen, Gower, Turano, Muñoz, Keay, Bandeen-Roche and West2012; Proust- Lima et al., Reference Proust-Lima, Amieva, Letenneur, Orgogozo, Jacqmin-Gadda and Dartigues2008; Tripathi, Kumar, Bharath, Marimuthu, & Varghese, Reference Tripathi, Kumar, Bharath, Marimuthu and Varghese2014), likely due to cultural differences, variations in statistical control, and sample selection factors. Future research using large cross-cultural samples with adequate statistical controls will lead to improved understanding of sex differences in cognitive performance.
An interesting finding regarding demographic impacts on factor scores was that the percentage of variance explained in cognitive performance was higher in our study than in past work using the UDS (Devora et al., Reference Devora, Beevers, Kiselica and Benge2019). This difference is likely due to the use of factor scores in the current research, which tend to have reduced error variance than raw scores (Thompson, Reference Thompson2004), allowing for improved predictive accuracy.
Importantly, the means of calculating these factor scores for individual patients has been made readily accessible through a user-friendly Excel calculator (available in the online supplementary material). This tool could reduce subjectivity in interpreting UDS3NB data in practice, though it remains to be determined whether factor scores are superior to their constituent scores for assessing cognitive decline. Additionally, given that current research criteria for defining declines prior to mild cognitive impairment suggest accounting for demographics (Jack et al., Reference Jack, Bennett, Blennow, Carrillo, Dunn, Haeberlein, Holtzman, Jagust, Jessen, Karlawish, Liu, Molinuevo, Montine, Phelps, Rankin, Rowe, Scheltens, Siemers, Snyder, Sperling, Elliott, Masliah, Ryan and Silverberg2018), the scoring spreadsheet represents an important tool for the research community. Future research may replicate this method with past versions of the UDS to ensure continuity across the batteries and associated datasets.
LIMITATIONS
Findings are interpreted in the context of the study’s limitations. One difficulty in calculating factor scores concerns the method of factor extraction. We used a regression-based approach for several reasons. First, the regression-based method is superior to coarse factor score methods, such as summing scaled scores or averaging test scores (DiStefano, Zhu, & Mindrila, Reference DiStefano, Zhu and Mindrila2009; Grice, Reference Grice2001). Second, this factor score calculation method can be easily understood without advanced statistical knowledge. And third, the regression-based approach can be readily transferred to a user-friendly Excel calculator. This feature eliminates the need for complex and/or expensive statistical software and increases the likelihood of adoption by a broad base of professionals. However, it must be acknowledged that the regression-based method has some disadvantages (e.g., it may fail to replicate orthogonal relationships specified in the original model), such that future research may fruitfully explore alternative means of factor extraction.
A second limitation concerns the variables used to diagnose individuals as cognitively normal in the study. Indeed, while the CDR provides a diagnosis of cognitively normal based on interview data, it is recognized that individuals rated as normal on this scale occasionally demonstrate subtle cognitive impairments on formal testing. This concern is somewhat ameliorated by the simultaneous use of a second criterion to define normality, the UDS consensus diagnosis. Of course, this method has its own limitations, including the possibility of criterion contamination, given that consensus diagnoses in the UDS are based in part on the UDS3NB data. Two important points reduce the concern for criterion contamination. First, consensus raters also based their conclusions on a host of other available information, including patient demographic background, medical history, known dementia risk factors, and data gathered at the clinical interviews with the patients and caregivers. Second, raters did not have access to the factor score data utilized in the current analysis. Still, it will be important to replicate the current findings in an independent sample, in which diagnoses are not based on neuropsychological data.
On a related note, researchers and clinicians are cautioned against utilizing the factor scores in populations with known cognitive impairments. Indeed, concern has been raised in past research about our ability to generalize factor models from normal to clinical populations, as measurement properties may change in these different groups (Delis, Jacobson, Bondi, Hamilton, & Salmon, Reference Delis, Jacobson, Bondi, Hamilton and Salmon2003; Jacobson, Delis, Hamilton, Bondi, & Salmon, Reference Jacobson, Delis, Hamilton, Bondi and Salmon2004). Future research will examine the factor structure of the UDS3NB in clinical samples, as well as the utility of factor scores in these groups.
A final limitation of this research concerns the UDS sample characteristics. Given that the sample includes primarily older, white participants, factor scores may not be as applicable to younger adults and individuals of minority backgrounds. Regarding age, the UDS3NB is simply not designed for data collection in a younger population at this time. It may be modified in the future as attempts to capture the very earliest cognitive signs of neurodegenerative disease emerge, while efforts to expand the diversity of data collection with at Alzheimer’s Disease Research Centers are ongoing.
CONCLUSIONS
These limitations are balanced by many strength of the manuscripts, including use of a large national sample to investigate the factor structure of the UDS3NB, comprehensive invariance testing across demographic groups and time, and creation of a user-friendly Excel calculator for deriving demographically adjusted factor scores. Our findings provide evidence for a higher order factor structure of the UDS3NB and demonstrate an easily accessible means of extracting and demographically correcting factor scores for use in research and applied settings. Future studies will replicate these findings in clinical samples and provide evidence for the psychometric properties of factor scores.
ACKNOWLEDGEMENTS
The NACC database is funded by NIA/NIH Grant U01 AG016976. NACC data are contributed by the NIA-funded ADCs: P30 AG019610 (PI Eric Reiman, MD), P30 AG013846 (PI Neil Kowall, MD), P50 AG008702 (PI Scott Small, MD), P50 AG025688 (PI Allan Levey, MD, PhD), P50 AG047266 (PI Todd Golde, MD, PhD), P30 AG010133 (PI Andrew Saykin, PsyD), P50 AG005146 (PI Marilyn Albert, PhD), P50 AG005134 (PI Bradley Hyman, MD, PhD), P50 AG016574 (PI Ronald Petersen, MD, PhD), P50 AG005138 (PI Mary Sano, PhD), P30 AG008051 (PI Thomas Wisniewski, MD), P30 AG013854 (PI Robert Vassar, PhD), P30 AG008017 (PI Jeffrey Kaye, MD), P30 AG010161 (PI David Bennett, MD), P50 AG047366 (PI Victor Henderson, MD, MS), P30 AG010129 (PI Charles DeCarli, MD), P50 AG016573 (PI Frank LaFerla, PhD), P50 AG005131 (PI James Brewer, MD, PhD), P50 AG023501 (PI Bruce Miller, MD), P30 AG035982 (PI Russell Swerdlow, MD), P30 AG028383 (PI Linda Van Eldik, PhD), P30 AG053760 (PI Henry Paulson, MD, PhD), P30 AG010124 (PI John Trojanowski, MD, PhD), P50 AG005133 (PI Oscar Lopez, MD), P50 AG005142 (PI Helena Chui, MD), P30 AG012300 (PI Roger Rosenberg, MD), P30 AG049638 (PI Suzanne Craft, PhD), P50 AG005136 (PI Thomas Grabowski, MD), P50 AG033514 (PI Sanjay Asthana, MD, FRCP), P50 AG005681 (PI John Morris, MD), P50 AG047270 (PI Stephen Strittmatter, MD, PhD). This work was supported by an Alzheimer’s Association Research Fellowship (2019-AARF-641693 PI Andrew Kiselica, PhD) and the 2019–2020 National Academy of Neuropsychology Clinical Research Grant (PI Andrew Kiselica, PhD).
CONFLICTS OF INTEREST
The authors have no conflicts of interest to disclose.
SUPPLEMENTARY MATERIAL
To view supplementary material for this article, please visit https://doi.org/10.1017/S135561772000003X


