


Introduction
Although most children with Attention Deficit/Hyperactivity Disorder (ADHD) are clinically described as impulsive and fast to respond, their performance in cognitive tasks is surprisingly slow, given that they generally report significantly higher mean response times (RTs) compared to a control group, regardless of the specific ability under examination (e.g., Klein, Wendling, Huettner, Ruder, & Peper, Reference Klein, Wendling, Huettner, Ruder and Peper2006; Nigg, Willcutt, Doyle, & Sonuga-Barke, Reference Nigg, Willcutt, Doyle and Sonuga-Barke2005; Willcutt, Doyle, Nigg, Faraone, & Pennington, Reference Willcutt, Doyle, Nigg, Faraone and Pennington2005). This apparent divergence has recently been accounted for through finer-grained analyses of RTs during the execution of computerized tasks requiring repeated responses. In fact, when examining the trial-by-trial distribution of RTs collected during a task, children with ADHD typically show both extremely fast and extremely slow responses (for a review, see Castellanos, Sonuga-Barke, Milham, & Tannock, Reference Castellanos, Sonuga-Barke, Milham and Tannock2006), thus presenting a high intra-individual variability (IIV). Therefore, higher mean RTs have been hypothesized to be the result of a periodic fluctuation in response times rather than a general slowing of responses.
Remarkably, high IIV in ADHD can consistently be observed in a number of studies (Epstein, Langberg, et al., Reference Epstein, Brinkman, Froehlich, Langberg, Narad, Antonini and Altaye2011), and it has been suggested that high IIV should not be considered as simply a reflection of error variance, but as one of the core features of ADHD, and one which can be regarded as a reliable clinical index because it correlates with ADHD diagnosis (Castellanos et al., Reference Castellanos, Sonuga-Barke, Scheres, Di Martino, Hyde and Walters2005; Epstein et al., Reference Epstein, Erkanli, Conners, Klaric, Costello and Angold2003; Leth-Steensen, Elbaz, & Douglas, Reference Leth-Steensen, Elbaz and Douglas2000). Crucially, stimulant medication (e.g., methylphenidate) has been found to attenuate individual RT variability in children with ADHD (Castellanos et al., Reference Castellanos, Sonuga-Barke, Scheres, Di Martino, Hyde and Walters2005; Epstein et al., Reference Epstein, Conners, Hervey, Tonev, Arnold, Abikoff and Wigal2006; Epstein, Brinkman, et al., Reference Epstein, Brinkman, Froehlich, Langberg, Narad, Antonini and Altaye2011; Spencer et al., Reference Spencer, Hawk, Richards, Shiels, Pelham and Waxmonsky2009; Tannock, Schachar, & Logan, Reference Tannock, Schachar and Logan1995; Teicher, Lowen, Polcari, Foley, & McGreenery, Reference Teicher, Lowen, Polcari, Foley and McGreenery2004). Studies have analyzed the frequency of extremely long responses in time series RT data by means of Fast Fourier Transform (FFT), and have found that they have a characteristic periodicity in children with ADHD, namely they occur at a frequency of 0.05 Hz (i.e., approximately every 20 s; Castellanos et al., Reference Castellanos, Sonuga-Barke, Scheres, Di Martino, Hyde and Walters2005). Later findings support the existence of a low frequency periodicity for long RTs (in the range of 0.03–0.07 Hz) in a variety of tasks, such as the Sustained Attention to Response Task (SART; Johnson et al., Reference Johnson, Kelly, Bellgrove, Barry, Cox, Gill and Robertson2007), the Ericksen Flanker Task (Di Martino et al., Reference Di Martino, Ghaffari, Curchack, Reiss, Hyde, Vannucci and Castellanos2008), and the Go/NoGo Task (Vaurio, Simmonds, & Mostofsky, Reference Vaurio, Simmonds and Mostofsky2009).
Therefore, a considerable body of research has recently been developed to understand the nature of the IIV of RTs in ADHD. It has been thought to reflect moment-to-moment fluctuations in attention (Castellanos & Tannock, Reference Castellanos and Tannock2002; Douglas, Reference Douglas1999), lack of top-down control (Bellgrove, Hester, & Garavan, Reference Bellgrove, Hester and Garavan2004; Castellanos et al., Reference Castellanos, Sonuga-Barke, Scheres, Di Martino, Hyde and Walters2005), failure of response inhibition (Ridderinkhof, Reference Ridderinkhof2002), or state regulation (Geurts et al., Reference Geurts, Grasman, Verte, Ooserlaan, Roeyers, van Kammen and Sergeant2008; Kuntsi, Oosterlaan, & Stevenson, Reference Kuntsi, Oosterlaan and Stevenson2001; Sergeant, Reference Sergeant2005; Sergeant, Geurts, Huijbregts, Scheres, & Oosterlaan, Reference Sergeant, Geurts, Huijbregts, Scheres and Oosterlaan2003). The exact nature of such phenomena, however, is still a matter of debate.
When analyzing RTs one needs to take into account that individual RTs are not adequately described by conventional measures of central tendency, such as total mean and standard deviation (SD; Hockley & Corballis, Reference Hockley and Corballis1982; Ratcliff & Murdock, Reference Ratcliff and Murdock1976). In both typically developing controls and clinical populations, the RT distribution does not present a normal shape but is positively skewed (Luce, Reference Luce1986). Specifically, the distribution of RTs has been demonstrated to fit optimally with an ex-Gaussian probability density function resulting from the convolution of a Gaussian and an exponential curve (Burbeck & Luce, Reference Burbeck and Luce1982). Three parameters describe the ex-Gaussian fit: mu (μ), sigma (σ), and tau (τ) (Heathcote, Popiel, & Mewhort, Reference Heathcote, Popiel and Mewhort1991; Ratcliff & Murdock, Reference Ratcliff and Murdock1976). The mu and the sigma parameters represent the normally distributed components of the curve. The tau parameter represents the exponentially distributed component, which accounts for the positive skew of the RT distribution. The mean of the ex-Gaussian distribution corresponds to the sum of mu and tau. The standard deviation of the distribution corresponds to the sum of tau and sigma. Notably, according to the ex-Gaussian approach, extremely high RT values are not treated as outliers but are included in the analysis as they contribute both to the calculation of the mean response time and the size of the variance, and consequently lead to higher values of global mean and standard deviation. Therefore, a child showing higher mu values and low tau values likely has generalized slowing response times, whereas a child showing lower mu values and higher tau values likely has generally fast responses intermixed with extremely slow responses.
Decomposing response times recorded during computerized tasks into ex-Gaussian parameters has been shown to be an efficient approach for providing a more sensitive and specific measure of variability in patients with ADHD (e.g., Borella, de Ribaupierre, Cornoldi, & Chicherio, Reference Borella, de Ribaupierre, Cornoldi and Chicherio2012; Buzy, Medoff, & Schweitzer, Reference Buzy, Medoff and Schweitzer2009; Epstein, Langberg, et al., Reference Epstein, Langberg, Rosen, Graham, Narad, Antonini and Altaye2011; Hervey et al., Reference Hervey, Epstein, Curry, Tonev, Arnold, Conners and Hechtman2006; Leth-Steensen et al., Reference Leth-Steensen, Elbaz and Douglas2000; Vaurio et al., Reference Vaurio, Simmonds and Mostofsky2009). In a foreperiod task, for example, Leth-Steensen et al. (Reference Leth-Steensen, Elbaz and Douglas2000) found that the RT distribution in children (9–13 years old) with ADHD was characterized by significantly higher values of the exponential tau parameter when compared to an age-matched control group, but had similar values for mu and sigma parameters. Furthermore, the authors showed that mu and sigma values were significantly higher in younger control children (7 years old) compared to the ADHD group. On the one hand, these results indicated that the RTs of children with ADHD differed from the non-clinical sample because of the presence of a larger number of excessively long RTs (i.e., beyond the individual mean), and on the other hand that ex-Gaussian parameters were differentially affected by individual variables, such as age. In a Continuous Performance Task (the Conners’ CPT-II), Hervey et al. (Reference Hervey, Epstein, Curry, Tonev, Arnold, Conners and Hechtman2006) found that while traditional RT analyses showed significantly slower and more variable RTs in children with ADHD, ex-Gaussian analyses revealed lower mu (i.e., faster RTs) and higher sigma values. Notably, the largest group difference was reported in the tau values, which significantly increased as the inter-stimulus interval (ISI) duration increased, especially in the ADHD group. This result strongly suggested the presence of an inefficient phasic attention, which in turn affected response preparation. In two Go/NoGo tasks, Vaurio et al. (Reference Vaurio, Simmonds and Mostofsky2009) found that children with ADHD presented significantly higher values of both the normal (sigma) and the exponential (tau) components of variability, regardless of the working memory load.
To date, the IIV of RTs in ADHD has been investigated by taking into account only the overall performance or the effect of ISI. In the present study, we overcome such limitation by exploring how IIV fluctuates over the course of a CPT in children with ADHD and a control group. To this end, we compared error rates and IIV in RTs across the six blocks of the CPT; RTs were analyzed separately for each block using both a conventional and an ex-Gaussian approach. We expected to find an increasing trend of tau values (reflecting abnormally long RTs) across blocks in children with ADHD, significantly higher than in the control group. A different ex-Gaussian pattern emerging from the two groups would demonstrate that managing sustained attention resources over the course of a task is one of the core abilities impaired in ADHD.
Method
Participants
A total of 30 children with a diagnosis of ADHD, aged 8–13 years (M = 11.48; SD = 1.73; male = 26), were enrolled at a local Clinical Service (“Centro Phoenix di Psicologia, Neuropsicologia, Psicoterapia”, Bassano del Grappa, Italy). A diagnosis of ADHD was established by qualified neuropsychologists on the basis of DSM-IV-TR criteria (APA, 2000), using a clinical interview and by asking parents to complete two behavioral checklists, standardized for the Italian population, for assessing hyperactivity and inattentive behaviors (SDAG; Cornoldi, Gardinale, Masi, & Pettenò, Reference Cornoldi, Gardinale, Masi and Pettenò1996), and the Child Behavior Checklist (CBCL; Achenbach, Reference Achenbach1991). The clinical interviews with parents assessed whether the child met DSM-IV-TR criteria for ADHD, both for inattention and hyperactivity/impulsivity, namely the presence of six symptoms displayed at home and at school. The SDAG scale contains 18 items investigating all DSM-IV-TR symptoms, which are divided into two subscales: one for inattention and one for hyperactivity–impulsivity behaviors. Parents are required to evaluate the frequency of each behavior on a four-point Likert scale, ranging from “almost never” (0) to “very often” (3). The cutoff for considering a child for a possible diagnosis of ADHD was a total score of 14 in either one of the two subscales (Marzocchi, Re, & Cornoldi, Reference Marzocchi, Re and Cornoldi2010). In the ADHD group, the mean SDAG score on the inattention scale was 18.5 (SD = 2.70), and on the hyperactivity–impulsivity scale was 15.8 (SD = 3.50). A total of three (10.00%) children obtained scores above the clinical cutoff on the internalizing scale of the CBCL (Frigerio et al., Reference Frigerio, Cattaneo, Cataldo, Schiatti, Molteni and Battaglia2004), and a total of four (13.33%) children obtained scores higher than the clinical cutoff on the externalizing scale. On the basis of both the clinical evaluation and the scores derived from the questionnaires, the following percentages relating to ADHD subtypes were identified: 8 (26.66%) predominantly inattentive, 3 (10.00%) predominantly hyperactive/impulsive, and 16 (63.33%) combined subtype. All the children included in the study obtained full-scale IQ scores above 85 (M = 102.73; SD = 11.53), assessed by the Wechsler Intelligence Scale for Children (WISC-III; Orsini & Picone, Reference Orsini and Picone2006; Wechsler, Reference Wechsler1991). Based on reading, writing, and calculation tests, none of them presented learning disabilities. Reading abilities were assessed by means of words and non-words lists (Sartori, Job, & Tressoldi, Reference Sartori, Job and Tressoldi2009) and text reading (Cornoldi & Colpo, Reference Cornoldi and Colpo1998); writing skills were assessed by means of a sentence writing test (Sartori et al., Reference Sartori, Job and Tressoldi2009) and a praxis (Tressoldi & Cornoldi, Reference Tressoldi and Cornoldi1991) test; mathematical abilities were assessed by means of a battery of tests (Biancardi & Nicoletti, Reference Biancardi and Nicoletti2004). Learning disabilities were defined if children scored below the 10th percentile in at least two measures for each domain.
A total of 30 age and sex-matched children were included in the control group (age range = 8–13 years; M = 11.30; SD = 1.26; male = 26). The two groups did not differ in age (p = .642). Control participants were recruited at schools in the same geographical area (a region in northeast Italy) as the ADHD group, and came from the same socioeconomic background. Children were included in the control group if their IQ scores were above 85, if teachers reported neither cognitive or behavioral deficits nor learning disabilities, and if their parents scored lower than the cutoff in both the two subscales included in the SDAG questionnaire. The mean full IQ in the control group (M = 107.56; SD = 10.43) did not differ from the mean IQ in the ADHD group (p = .104). The mean SDAG scores of the control group on the inattention scale was 9.80 (SD = 3.70); the mean SDAG score on the hyperactivity–impulsivity scale was 7.20 (SD = 3.20). The SDAG scores of the ADHD group were significantly lower than the control group (p = .020, and p < .001, respectively).
None of participants had a history of seizures, brain injury or other neurological damage, uncorrected visual, auditory or speech deficits, pervasive developmental disorders, or medical conditions that may mimic ADHD. All children with ADHD were medication-naïve. The study was conducted according to the principles stated in the Declaration of Helsinki and parents were informed about the general experimental procedures and provided written consent.
Procedure and Task
All children performed the Conners’ Continuous Performance Test (CPT-II; Conners, Reference Conners and MHS2000) within the standard neuropsychological assessment session. The task takes approximately 14 min to be completed. With respect to other previously investigated tasks (5.5 min, Johnson et al., Reference Johnson, Kelly, Bellgrove, Barry, Cox, Gill and Robertson2007; 8 min, Vaurio et al., Reference Vaurio, Simmonds and Mostofsky2009), this is an optimal duration for observing potential deficits related to sustained attention. The task was presented individually to each child using a laptop computer. Children were instructed to press the spacebar whenever a letter appeared on the screen (Go trials), except for the letter “X” (NoGo trials). The task included a total of 360 letters consecutively presented at the center of the screen, each for 250 ms. The 360 trials were divided into six blocks, each consisting of 60 trials. The blocks were divided into three randomly presented sub-blocks, one for each ISI (1, 2, or 4s): the three levels of ISI were randomized across trials. The appearance of the NoGo stimulus (“X”) was rare (10%: 36 times) and RTs were measured from the onset of the letter appearing on the screen.
Data Analysis
Two types of error were recorded: omissions (no response to the target letters) and commissions (response to the Xs). The ex-Gaussian parameters (mu, sigma, and tau) of the probability distribution were calculated using the egfit MATLAB function (Lacouture & Cousineau, Reference Lacouture and Cousineau2008). This function computes an iterative search process to fit the ex-Gaussian probability density function to the frequency distribution, and generates the three parameters from which the observed RTs are most likely to be sampled. Anticipated responses (RTs < 100 ms) were excluded from the analysis. A total of 1.62 (SD = 2.08) anticipations in the ADHD group and 0.73 (SD = 1.34) in the control group was found. On average, the RT distribution did not fit the ex-Gaussian function but instead approximated to an exponential function (i.e., sigma values were lower than 1) in 7.3% of the blocks in the ADHD group and in 4% of the blocks in the control group. In these cases, estimated values of mu, sigma, and tau were not included in the analysis but were replaced by the average value of the sample. Notably, the Kolmogorov-Smirnov normality test conducted on each individual block did not yield statistically significant results.
To examine the effect of group and block on these measures, separate 2 × 6 mixed model analyses of covariance (ANCOVAs) were conducted, in which Group (ADHD vs. control) was entered as the between-subject factor, Block number as the within-subject factor, and Age as covariate. Since the focus of the study was to examine whether the time-on-task effect and the number of trials at each ISI is equally distributed across blocks, we collapsed different ISIs; by doing so, we obtained several trials for a reliable estimate of ex-Gaussian parameters.
An alpha level of .050 was considered for statistical significance. To control for multiple testing (i.e., seven different outcomes for the same task), a false discovery rate correction (FDR) was applied to p values (Benjamini & Hochberg Reference Benjamini and Hochberg1995). Within each ANCOVA model, the Bonferroni correction was applied in post hoc analyses. Effect sizes were calculated in terms of partial eta squares (ηp2). The relationship between age and error rates or RT parameters, as well as the association between error rates and RT parameters, was further examined by calculating Spearman's correlation coefficients (rho) between errors, Gaussian and ex-Gaussian measures.
Results
Errors
The ANCOVA revealed that the overall number of omissions was significantly higher in the ADHD group in comparison with the control group (F(1,57) = 30.112; p < .001; ηp2 = .346). A main effect of Block was found (F(5,53) = 2.864; p = .035; ηp2 = .048). Importantly, the Group × Block interaction was also significant (F(5,53) = 4.313; p = .003; ηp2 = .070), showing that the block number (order) only had a significant effect on the number of omissions in children with ADHD. The post hoc analysis of the interaction revealed that while omissions did not differ across blocks in the control group, children with ADHD made significantly more omission errors in blocks 4, 5, and 6 compared to block 1 (all ps < .003), and in blocks 5 and 6 compared to block 2 (both ps = .004). Figure 1a shows the distribution of the mean omission errors across the six blocks in the two groups, corrected for age.

Fig. 1 Mean number of (a) Omission and (b) Commission errors plotted according to six blocks of the Conners’ Continuous Performance Task (CPT) and to group (black line: attention deficit/hyperactivity disorder [ADHD], gray line: control). Data are age-corrected. Bars represent standard errors.
No differences were found in the mean number of commissions between the two groups (F(1,57) = 0.172; p = .680; ηp2 = .003). As illustrated in Figure 1b, the total number of commission errors was high in the ADHD group as well as in the control group (the maximum number of possible commission errors is six).
Age did not influence commission but significantly interacted with block number on the number of omissions (F(1,53) = 2.760; p = .040; ηp2 = .046). In particular, age negatively correlated with the mean number of omissions in block 3 (rho = -.361; p = .005).
Gaussian RT Parameters
As expected, overall mean RTs were significantly higher in the ADHD group (F(1,57) = 17.977; p < .001; ηp2 = .243). The ADHD group showed significantly higher mean RTs compared to the control group in all blocks (all ps < .016). Both groups showed a steep increase in mean RTs after the first block of trials; subsequently this remained relatively stable throughout the entire task (see Figure 2a). The ANCOVA did not yield a significant Block (F(5,53) = 0.706; p = .619; ηp2 = .012) or Group × Block interaction (F(5,53) = 1.511; p = .187; ηp2 = .026).
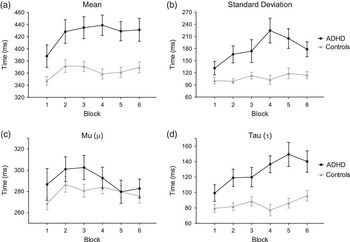
Fig. 2 Response times expressed in terms of Gaussian parameters: (a) mean, (b) standard deviation; and ex-Gaussian parameters: (c) mu (μ) and (d) tau (τ). Data are plotted according to the six blocks of the Conners’ Continuous Performance Task (CPT) and to group (black line: attention deficit/hyperactivity disorder [ADHD]; gray line: control). Data are age-corrected. Bars represent standard errors.
Overall, children with ADHD showed significantly more variability than children in the control group, as revealed by analyzing the mean RT standard deviation (F(1,57) = 21.221; p < .001; ηp2 = .275). As shown in Figure 2b, the mean RT standard deviation of children with ADHD rose in the last three blocks of the task, whereas it remained stable in the control group. The ADHD group showed significantly higher SD than the control group in all blocks except the first and last ones. The Block (F(5,53) = 1.416; p = .219; ηp2 = .025) or interaction effect (F(5,53) = 2.263; p = .064; ηp2 = .039) did not reach statistical significance.
In all children, age significantly affected mean RTs (F(1,57) = 14.48; p = .001; ηp2 = .243) and mean RT standard deviation (F(1,57) = 9.94; p = .009, ηp2 = .151). The correlation analysis between mean RTs and age confirmed that, regardless of block, as age increased mean RTs and mean RT standard deviation significantly diminished (rho = −.371; p = .004 and rho = −.278; p < .033, respectively).
Ex-Gaussian RT Parameters
As shown in Figure 2c, mean mu values increased from the first to the second block in both groups, a pattern similar to that observed in mean RTs calculated according to the Gaussian distribution (cf., Figure 2a). After the second block, however, mean mu values demonstrated a different pattern, in that they decreased in the ADHD group while they remained approximately stable in the control group. A main effect of Block was found (F(5,53) = 2.606; p = .049; ηp2 = .044). The post hoc comparisons showed that mean mu values in block 2 were significantly higher than in block 5 and 6 (both ps = .026). Notably, mu values did not significantly differ between the two groups in any block (F(1,57) = 2.012; p = .162; ηp2 = .035).
The ex-Gaussian parameter sigma was significantly higher in the ADHD group in all task blocks (F(1,57) = 18.420; p < .001; ηp2 = .248). There was no significant main effect for Block (F(5,53) = 1.299; p = .264; ηp2 = .023) or Group × Block interaction effect (F(5,53) = 1.668; p = .142; ηp2 = .029).
The most interesting results were related to the tau parameter, which presented an evident increase from block 1 to block 6 in the ADHD group, as shown in Figure 2d. Overall, mean tau values were higher in the ADHD group (F(1,57) = 28.268; p < .001; ηp2 = .335). Moreover, the ANCOVA yielded a significant main effect of Block (F(5,53) = 3.562; p = .012; ηp2 = .060) and Group × Block interaction (F(5,53) = 2.638; p = .048; ηp2 = .045). Bonferroni post hoc analyses showed that tau values in the ADHD group were significantly higher in blocks 2, 4, 5, and 6 compared to block 1 (all ps < .033), in blocks 5 and 6 compared to block 2 (all ps < .047), and in block 5 compared to block 3 (p = .025). Mean tau values were significantly higher in the ADHD group compared to the control group in all blocks except the first one (all ps < .014).
The across-block pattern of the tau was explored in detail by fitting a linear regression equation, separately for the ADHD and the control group. The mean slope significantly differed from zero only in the ADHD group (β = 8.926 ± 1.914; 95% confidence interval [CI] = 3.613–14.240), not in the control group (β = 2.358 ± 1.378; 95% CI = −1.477–6.186). Furthermore, the two linear regression were significantly different (F(1,8) = 7.749; p = .023).
Remarkably, the fact that in both groups the across-block trend of tau values mirrored the pattern observed for the normally distributed RT standard deviation (Figure 2b) suggests that intra-individual RT variability in ADHD children is mostly related to extremely slow responses.
Age significantly affected mean mu (F(1,57) = 7.719; p = .021; ηp2 = .121), sigma (F(1,57) = 21.51; p < .001; ηp2 = .248), and tau (F(1,57) = 15.762; p = .001; ηp2 =.220) values, namely they significantly decreased with age. Furthermore, age significantly interacted with Block in influencing mu (F(5,53) = 2.935; p = .035; ηp2 = .050) and tau (F(5,53) = 2.908; p < .035; ηp2 = .049). Correlation analyses showed that age negatively correlated with mu values in blocks 1, 4, and 6 (rho<−.273; p < .037); whereas it negatively correlated with tau in all but the first block (rho<−.270; p < .038).
Correlations between Measures
Table 1 shows the results of correlation analyses between omission and commission errors with Gaussian and ex-Gaussian parameters. As illustrated in the table, in the ADHD group omission errors were significantly and positively correlated with the sigma parameter, while commission errors were negatively correlated with the mu parameter. Importantly, in the ADHD group, RT standard deviation was significantly correlated only with the tau parameter, while in the control group, it correlated with the tau and the sigma parameters. This confirms that the RT variability in ADHD is principally due to extremely long RTs.
Table 1 Non parametric correlation coefficients (rho) between errors, Gaussian and ex-Gaussian measures. Lower diagonal values refer to ADHD group, upper diagonal values refer to control group.

*p < .05, **p < .01, ***p < .001.
Discussion
The aim of the study was to examine intra-individual variability during a sustained attention task in children with ADHD by investigating their block-by-block fluctuation in responses, in terms of variations of errors (omission, commission), conventional RT measures (mean RT and standard deviation), and ex-Gaussian RT parameters (mu, sigma, and tau). To this end, these measures were compared across the six blocks of a CPT lasting 14 min (CPT-II; Conners, Reference Conners and MHS2000), based on a sample of children with ADHD and a control group.
The results revealed that omission errors progressively increased after the first block of trials (i.e., at approximately 2.5 min from the beginning of the task) in the ADHD group but not in the control group. As expected, the conventional Gaussian analysis showed a significant main effect of group on mean RTs. In addition, it revealed the presence of a similar across-block trend between the two groups, namely RTs significantly increased after the first block and remained steady afterward. In contrast, the ex-Gaussian analysis revealed no actual differences between the two groups in terms of the normally distributed RT parameter mu. On the other hand, mean mu values showed a completely different across-block pattern from that of the Gaussian values (Figure 2a and 2c): they significantly decreased in the last two blocks. Importantly, the tau trend across blocks differed between the two groups: the ADHD group showed a significant increase, namely tau values steeply and progressively increased from the first block to block 6, whereas the control group they remained steady until the end of the task. These findings clearly suggest that the higher omission rates and mean RTs observed in children with ADHD were mostly due to the exponential component of RTs (i.e., to extremely long RTs), which significantly increased as the task proceeded. In addition, the fact that tau values did not differ between groups in the first block but differed in all following blocks suggests that intra-individual variability increases with time-on-task demands.
The across-block variation in intra-individual variability was consistent with that reported by Klein et al. (Reference Klein, Wendling, Huettner, Ruder and Peper2006). Indeed, in a similar Go/NoGo task, these authors found a significant increase of RT standard deviation across the 15 blocks of a CPT in a group of children with ADHD. Our study further extended these findings by demonstrating that intra-individual variability of RTs in children with ADHD was mostly caused by abnormally long responses, as suggested by the tau parameter distribution. The present findings are in agreement with previous studies showing the tau parameter to be a sensitive marker of ADHD-related between-groups differences, based on CPT (Hervey et al., Reference Hervey, Epstein, Curry, Tonev, Arnold, Conners and Hechtman2006), choice discrimination (Leth-Steensen et al., Reference Leth-Steensen, Elbaz and Douglas2000), and Go/NoGo (Epstein, Langberg, et al., Reference Epstein, Brinkman, Froehlich, Langberg, Narad, Antonini and Altaye2011; Vaurio et al., Reference Vaurio, Simmonds and Mostofsky2009) tasks. Furthermore, our results support previous evidence which shows significant low frequency fluctuations throughout a task in individuals with ADHD (Castellanos et al., Reference Castellanos, Sonuga-Barke, Scheres, Di Martino, Hyde and Walters2005; Di Martino et al., Reference Di Martino, Ghaffari, Curchack, Reiss, Hyde, Vannucci and Castellanos2008; Helps, Broyd, Bitsakou, & Sonuga-Barke, Reference Helps, Broyd, Bitsakou and Sonuga-Barke2011; Johnson et al., Reference Johnson, Kelly, Bellgrove, Barry, Cox, Gill and Robertson2007; Vaurio et al., Reference Vaurio, Simmonds and Mostofsky2009). Indeed, it is possible that the prolonged RTs are related to abnormally slow spontaneous oscillations in brain activity.
Particularly important is the finding that children with ADHD showed a steep increase of intra-individual variability after few minutes from the commencement of the task (i.e., after the first block), while the control group did not show any relevant across-block variation in errors, Gaussian, and ex-Gaussian measures.
Unlike the Gaussian mean RT, the fact that overall the mu parameter (i.e., the normally distributed component of mean RTs) did not significantly differ between the two groups confirmed previous findings that children with ADHD are generally no slower than children in control groups (Hervey et al., Reference Hervey, Epstein, Curry, Tonev, Arnold, Conners and Hechtman2006; Leth-Steensen et al., Reference Leth-Steensen, Elbaz and Douglas2000). Furthermore, the fact that mu values in the ADHD group decreased after the third block while RT standard deviation simultaneously increased corroborates the idea the time-on-task demands affect intra-individual variability not the overall response time speed.
The normally distributed sigma parameter was overall higher in the ADHD group, which is consistent with previous reports (Hervey et al., Reference Hervey, Epstein, Curry, Tonev, Arnold, Conners and Hechtman2006; Vaurio et al., Reference Vaurio, Simmonds and Mostofsky2009). In addition, overall mean tau values were positively correlated with sigma values only in the control group, suggesting that phasic and tonic attention are subject to covariation.
Commission errors did not differ between groups, given that the rate of NoGo trials was very low (10%); not surprisingly, the children in the control group also found it very difficult to inhibit their motor response. Similarly, previous investigations using the Conners CPT observed no differences in the total number of commission errors between the ADHD and control group (Epstein et al., Reference Epstein, Hwang, Antonini, Langberg, Altaye and Arnold2010; Hervey et al., Reference Hervey, Epstein, Curry, Tonev, Arnold, Conners and Hechtman2006).
Of interest, overall omission rates were positively correlated with the exponential component of mean RTs (tau) in both groups, meaning that both phenomena reflect a common process. On the other hand, the negative correlation between commission errors and the Gaussian component of mean RTs (mu) reveals that children who failed more often were those with overall faster overall RTs. The positive correlation between omission rates and tau, together with the negative correlation between commission rates and mu, may also reflect the effect of a speed-accuracy trade-off in both groups. Furthermore, the positive correlation between omissions and tau, together with the negative correlation between omissions and mu, in children with ADHD, may partially be explained by the presence of pre- and post-error slowing (Epstein et al., Reference Epstein, Hwang, Antonini, Langberg, Altaye and Arnold2010). These results suggest that tau and mu parameters are likely linked to two independent processes, namely, lapses of attention (Castellanos & Tannock, Reference Castellanos and Tannock2002; Douglas, Reference Douglas1999) and failures of response inhibition (Ridderinkhof, Reference Ridderinkhof2002).
The findings presented here support the hypotheses of the presence of either a deficit of top-down control (Barkley, Reference Barkley1997; Bellgrove et al., Reference Bellgrove, Hester and Garavan2004) or sub-cortical state regulation (Geurts et al., Reference Geurts, Grasman, Verte, Ooserlaan, Roeyers, van Kammen and Sergeant2008; Kuntsi et al., Reference Kuntsi, Oosterlaan and Stevenson2001; Sergeant et al., Reference Sergeant, Geurts, Huijbregts, Scheres and Oosterlaan2003) in ADHD. From a neural perspective, the increase in excessively long RTs and in error rates over the course of the task might reflect an inefficient suppression of activity in those brain areas involved in the default network, such as the medial prefrontal cortex (Fassbender et al., Reference Fassbender, Zhang, Buzy, Cortes, Mizuiri, Beckett and Schweitzer2009; Kelly et al., Reference Kelly, Hester, Murphy, Javitt, Foxe and Garavan2004; Sonuga-Barke & Castellanos, Reference Sonuga-Barke and Castellanos2007; Weissman, Roberts, Visscher, & Woldorff, Reference Weissman, Roberts, Visscher and Woldorff2006). Furthermore, the activation of frontal brain areas might be involved as the task demands sustained attention (e.g., Manly et al., Reference Manly, Owen, McAvinue, Datta, Lewis, Scott and Robertson2003; Stuss, Murphy, Binns, & Alexander, Reference Stuss, Murphy, Binns and Alexander2003; Wilkins, Shallice, & McCarthy, Reference Wilkins, Shallice and McCarthy1987). Specifically, dorsolateral prefrontal regions have been found to be associated with increased over-time variability and inter-trial fluctuations, even in easy choice RT tasks (Bellgrove et al., Reference Bellgrove, Hester and Garavan2004; Stuss et al., Reference Stuss, Murphy, Binns and Alexander2003); these regions are also considered to be dysfunctional in individuals with ADHD (for reviews, see Bush, Reference Bush2010, Reference Bush2011).
Strength of this study is that, in addition to having confirmed the IIV potential as a biomarker of ADHD, we demonstrated that an increased time-to-task demand is closely associated with increasing IIV and error rates in ADHD. Based on these observations, IIV in cognitive tests can no longer be considered “statistical noise”, and theories that stem from such a perspective should be dismissed (e.g., Castellanos et al., Reference Castellanos, Sonuga-Barke, Milham and Tannock2006).
Moreover, our study extended previous investigations on sustained attention deficit in ADHD, by showing that variations in individual performance across a task in children with ADHD are associated with difficulties in sustaining attention. We interpreted such results as a consequence of an inability to distribute attentional resources strategically over time, which in turns leads to off-task behaviors. Importantly, the analysis of the ex-Gaussian tau parameter allows the detection of an ADHD-related deficit in sustained attention even in the first few blocks of the task. These findings are relevant given that although the existence of sustained attention deficit in ADHD is a well-known phenomenon, it has been surprisingly poorly investigated and still remains controversial (Johnson et al., Reference Johnson, Kelly, Bellgrove, Barry, Cox, Gill and Robertson2007; Klein et al., Reference Klein, Wendling, Huettner, Ruder and Peper2006; van der Meere, Shalev, Borger, & Gross-Tsur, Reference van der Meere, Shalev, Borger and Gross-Tsur1995; van der Meere, Wekking, & Sergeant, Reference van der Meere, Wekking and Sergeant1991).
Some limitations of the study should be considered when interpreting the findings. First, the diagnostic interview with parents and teachers that aimed to identify behavioral and emotional disorders was not standardized; therefore, the inclusion of some children with such comorbid disorders in the ADHD group as well as in the control group could not be completely ruled out. Moreover, the control group was not systematically assessed for learning disabilities. Although the control group was recruited from schools in the same geographical area and is assumed to have similar socioeconomic background as the ADHD group, no data were available to confirm this. Given the relatively small sample size, the present results should be replicated by future studies; nevertheless, it is worth noting that the results are consistent with previous findings.
In conclusion, the block-by-block analysis of variations in errors and RTs unveiled the presence of a marked increase in errors and abnormally slow responses in children with ADHD as the task progressed. Of interest, there was no difference in the distribution of RTs across blocks between the two groups in terms of normal mean, a difference was found in extremely long responses. These results suggested that intra-individual variability of children with ADHD over the course of a sustained attention task should be regarded as a crucial aspect when evaluating these patients.
Acknowledgments
The information in this manuscript and the manuscript itself has never been published either electronically or in print. There are no financial or other relationships that could be interpreted as a conflict of interest affecting this manuscript. This research received no specific grant from any funding agency, commercial or not-for-profit sectors. The authors thank Majla Trovato and all neuropsychologists of the Centro Phoenix di Psicologia, Neuropsicologia, Psicoterapia (Bassano del Grappa, Italy) for helping in collecting data. The authors thank the Associate Editor, the anonymous reviewers and Dr. Erika Borella for their precious comments.


