


INTRODUCTION
The clinical interest in predicting progression of cognitive impairment to dementia (particularly Alzheimer’s disease, AD) has led to the definition of a transition period between normal cognitive function and dementia. This period has been defined using various clinical syndromal terms such as mild cognitive impairment (MCI) (Petersen et al., Reference Petersen, Smith, Waring, Ivnik, Tangalos and Kokmen1999), prodromal AD (Dubois et al., Reference Dubois, Feldman, Jacova, Cummings, Dekosky, Barberger-Gateau and Scheltens2010, Reference Dubois, Feldman, Jacova, Dekosky, Barberger-Gateau, Cummings and Scheltens2007), and “MCI due to AD” (Albert et al., Reference Albert, DeKosky, Dickson, Dubois, Feldman, Fox and Phelps2011).
In addition to the expected episodic memory deficit, other brain systems may be altered in the preclinical (predementia) phases of AD, including visual function. Distinct forms of visual impairment have been extensively reported in AD, ranging from contrast sensitivity and color perception deficits to impairments in higher-order visual functions, including object and face perception and visual attention, as well as visual memory and learning (Butter, Trobe, Foster, & Berent, Reference Butter, Trobe, Foster and Berent1996; Duffy, Tetewsky, & O’Brien, Reference Duffy, Tetewsky and O’Brien2000; Rizzo, Anderson, Dawson, & Nawrot, Reference Rizzo, Anderson, Dawson and Nawrot2000). The prevalence of visual deficits is high in AD, with impairments found in a wide range of visual functions, suggesting a high vulnerability of pattern vision (52–59%), moderate vulnerability of spatial vision (20–33%), and low vulnerability (≤7%) of motion and flicker perception in AD (Mendola, Cronin-Golomb, Corkin, & Growdon, Reference Mendola, Cronin-Golomb, Corkin and Growdon1995).
These findings suggest a dual compromise of the ventral visual pathway (Cronin-Golomb, Reference Cronin-Golomb2004; Rizzo et al., Reference Rizzo, Anderson, Dawson and Nawrot2000) and the dorsal stream (Bokde et al., Reference Bokde, Lopez-Bayo, Born, Ewers, Meindl, Teipel and Hampel2010; Kavcic, Vaughn, & Duffy, Reference Kavcic, Vaughn and Duffy2011; Lemos, Figueiredo, Santana, Simoes, & Castelo-Branco, Reference Lemos, Figueiredo, Santana, Simoes and Castelo-Branco2012) in AD. Research of visual function in MCI has mostly addressed high-level visual functions, showing in particular impairment in attentional and visual search tasks (Levinoff, Saumier, & Chertkow, Reference Levinoff, Saumier and Chertkow2005; Perry & Hodges, Reference Perry and Hodges2003; Tales, Haworth, Nelson, Snowden, & Wilcock, Reference Tales, Haworth, Nelson, Snowden and Wilcock2005). The literature available on low-level visual functions is scarce. However, Risacher et al. (Reference Risacher, Wudunn, Pepin, MaGee, McDonald, Flashman and Saykin2013) proved an early deficit in contrast sensitivity to be present in amnestic MCI patients, while Mapstone, Steffenella, and Duffy (Reference Mapstone, Steffenella and Duffy2003) showed an impairment of radial motion detection in MCI subjects.
Most of the evidence concerning object perception in MCI comes from neuroimaging studies, showing in general patterns of decreased activation rather than directly measuring behavioral performance. Nevertheless, in a previous study, we found a selective deficit regarding integration of local motion cues into three-dimensional (3D) objects [structure-from-motion (SFM) stimuli] in a MCI group (Lemos et al., Reference Lemos, Figueiredo, Santana, Simoes and Castelo-Branco2012). This study suggested a reorganization of ventral visual processing.
Motion processing involves multiple hierarchical steps, ranging from the magnocellular pathway, sensitive to high temporal frequency modulations, to subsequent motion integration within the visual cortical dorsal stream. To address motion processing, stimuli related to the perception of coherent two-dimensional (2D) patterns or 3D object structures derived from motion cues have been designed. The integration of the local motion cues to extract the 3D global configuration enables the perception of SFM stimuli. Thus, the standard stimuli used in SFM paradigms consist of physically coherent motion on a screen that produces a vivid illusion of a 3D object moving/rotating in depth.
Motion coherence paradigms have classically been used to address dorsal stream function, as validated by single unit studies in monkeys as well as functional imaging in humans (Braddick, O’Brien, Wattam-Bell, Atkinson, & Turner, Reference Braddick, O’Brien, Wattam-Bell, Atkinson and Turner2000; Castelo-Branco et al., Reference Castelo-Branco, Formisano, Backes, Zanella, Neuenschwander, Singer and Goebel2002, Reference Castelo-Branco, Mendes, Silva, Massano, Januario, Januario and Freire2009; Orban, Sunaert, Todd, Van Hecke, & Marchal, Reference Orban, Sunaert, Todd, Van Hecke and Marchal1999). These studies indicate that detection of motion coherence relies, at least partially, on a dedicated brain area in the dorsal stream [MT (middle temporal) in monkeys, and area V5 in humans] independently of earlier level magnocellular processing (Castelo-Branco et al., Reference Castelo-Branco, Mendes, Silva, Massano, Januario, Januario and Freire2009). Early evidence from primate studies reported strong tuning in visual area MT for motion gradient selective neurons (Xiao, Marcar, Raiguel, & Orban, Reference Xiao, Marcar, Raiguel and Orban1997), suggesting that the center-surround structure may support 3D slant and curvature perception. Mysore, Vogels, Raiguel, Todd, and Orban (Reference Mysore, Vogels, Raiguel, Todd and Orban2010) showed the selectivity of neurons of the fundus of the superior temporal sulcus (FST) for stimuli depicting specific shapes, coding motion-defined 3D shape fragments and underscoring the central role of FST in processing 3D-SFM. Moreover, although V5/MT lies along the dorsal stream, it has extensive connections with the ventral stream, which is consistent with the notion that motion processing involves multiple distributed pathways (Castelo-Branco et al., Reference Castelo-Branco, Mendes, Silva, Januario, Machado, Pinto and Freire2006; Mendes et al., Reference Mendes, Silva, Simoes, Jorge, Saraiva and Castelo-Branco2005).
Accordingly, the neural correlates of SFM perception involve the integration of two main visual cortical pathways: the ventral stream underlying the recognition of object shape properties and the dorsal pathway involved in spatial vision and motion perception (Farivar, Blanke, & Chaudhuri, Reference Farivar, Blanke and Chaudhuri2009; Konen & Kastner, Reference Konen and Kastner2008; Milner & Goodale, Reference Milner and Goodale2008).
Of interest, the neural substrates of SFM perception in MCI patients were found to predominantly relate to aberrant patterns of activation in fusiform face area/occipital face area (FFA/OFA) in the presence of normal recruitment of motion selective areas, suggesting the activation pattern within the ventral visual stream as a putative biomarker for MCI (Graewe et al., Reference Graewe, Lemos, Ferreira, Santana, Farivar, De Weerd and Castelo-Branco2013). The study of visuospatial perception in the MCI group using an experimental paradigm requiring integration of dorsal and ventral processing may be important to clarify the role of these two visual pathways in the prediction of AD and better understand its pathophysiology, in addition to medial temporal lobe areas already known to be affected in this disorder (Jacobs et al., Reference Jacobs, Gronenschild, Evers, Ramakers, Hofman, Backes and Van Boxtel2012; McKee et al., Reference McKee, Au, Cabral, Kowall, Seshadri, Kubilus and Wolf2006; Villain, Chetelat, Desgranges, & Eustache, Reference Villain, Chetelat, Desgranges and Eustache2010; Villain, Fouquet, et al., Reference Villain, Fouquet, Baron, Mezenge, Landeau, de La Sayette and Chételat2010).
Previous functional magnetic resonance imaging (fMRI) studies suggested that reorganization may occur in both streams (Bokde et al., Reference Bokde, Lopez-Bayo, Meindl, Pechler, Born, Faltraco and Hampel2006; Prvulovic et al., Reference Prvulovic, Hubl, Sack, Melillo, Maurer, Frolich and Dierks2002; Teipel et al., Reference Teipel, Bokde, Born, Meindl, Reiser, Möller and Hampel2007; Vannini, Almkvist, Dierks, Lehmann, & Wahlund, Reference Vannini, Almkvist, Dierks, Lehmann and Wahlund2007; Yamasaki, Muranaka, Kaseda, Mimori, & Tobimatsu, Reference Yamasaki, Muranaka, Kaseda, Mimori and Tobimatsu2012).
The main goal of this study was to identify the structural correlates of the previously observed (Graewe et al., Reference Graewe, Lemos, Ferreira, Santana, Farivar, De Weerd and Castelo-Branco2013; Lemos et al., Reference Lemos, Figueiredo, Santana, Simoes and Castelo-Branco2012) deficits in complex face and object recognition, in MCI patients, and explore the contribution of both ventral and dorsal visual areas as putative biomarker of AD symptomatology. Our approach included a behavioral experimental paradigm with 3D SFM defined faces and objects and morphometric analysis comprising the computation of cortical thickness maps and hippocampal volumetry using MRI. We used SFM stimuli in which motion integration mechanisms in the dorsal stream form the basis for object recognition in the ventral stream. These stimuli, apart from probing dorsal–ventral integration provide an additional window on temporal lobe processes related to face perception in MCI (Graewe et al., Reference Graewe, Lemos, Ferreira, Santana, Farivar, De Weerd and Castelo-Branco2013). In sum, this study aimed to investigate visual cortical structure-function relationships in 3D motion integration tasks, with a focus on changes in dorsal versus visual ventral pathways.
METHODS
Subjects
MCI patients (n=30) were recruited from the Neurology Department of the Coimbra University Hospital. Diagnosis was reached through gold standard neurological and neuropsychological assessment following published classification criteria for MCI (Albert et al., Reference Albert, DeKosky, Dickson, Dubois, Feldman, Fox and Phelps2011; Petersen, Reference Petersen2004). All patients were of the amnestic “single domain” MCI type (at high risk for AD). Diagnostic investigation included a standard clinical evaluation, a staging assessment as well as laboratory tests including apolipoprotein E allele genotyping and imaging studies [MRI and single photon emission computed tomography/computed tomography (CT)].
The neuropsychological evaluation included a comprehensive diagnostic battery: (1) Cognitive instruments as the Mini-Mental State Examination (MMSE) (Folstein, Folstein, & McHugh, Reference Folstein, Folstein and McHugh1975) Portuguese version (Guerreiro, Silva, et al., Reference Guerreiro, Silva, Botelho, Leitão, Castro-Caldas and Garcia2008), the Alzheimer Disease Assessment Scale-Cognitive (ADAS-Cog) (Mohs, Rosen, & Davis, Reference Mohs, Rosen and Davis1983) Portuguese version (Guerreiro, Fonseca, Barreto, & Garcia, Reference Guerreiro, Fonseca, Barreto and Garcia2008), and a comprehensive neuropsychological battery with normative data for the Portuguese population (BLAD) (Guerreiro, Reference Guerreiro1998) exploring learning and memory (Wechsler Memory Scale-R sub-tests: logical memory, verbal paired associative learning, and visual memory) and other cognitive domains: attention (cancelation task); verbal, motor, and graphomotor initiatives (verbal semantic fluency, motor and graphomotor initiative – Luria sequences); verbal comprehension (modified version of the Token test); sentences repetition; verbal and non-verbal abstraction (interpretation of proverbs and the Raven Progressive Matrices); visuoconstructional abilities; calculation (basic written calculation); immediate memory (Digit Span forward); working memory (Digit Span backward); right–left orientation and praxis (data not shown); (2) The Clinical Dementia Rating (CDR) (Morris, Reference Morris1993) Portuguese version (Garrett et al., Reference Garrett, Santos, Tracana, Barreto, Sobral and Fonseca2008) was used for global staging.
The inclusion criteria for MCI were those proposed by Petersen for MCI (Petersen, Reference Petersen2004; Petersen et al., Reference Petersen, Doody, Kurz, Mohs, Morris, Rabins and Winblad2001) and were operationalized as follows: (1) A subjective complaint of memory decline (reported by the subject or an informant); (2) An objective memory impairment (considered when scores on standard Wechsler memory tests were 1.5 standard deviation (SD) below age/education adjusted norms); (3) Normal general cognition suggested by normal scores in the MMSE and ADAS-Cog using the Portuguese cutoff scores (Guerreiro, Fonseca, et al., Reference Guerreiro, Fonseca, Barreto and Garcia2008; Guerreiro, Silva, et al., Reference Guerreiro, Silva, Botelho, Leitão, Castro-Caldas and Garcia2008); (4) Largely normal daily life activities; (5) Absence of dementia, indicated by a CDR rating of 0.5 (Morris, Reference Morris1993).
Patients were excluded if they had other psychiatric or neurological conditions than MCI; CT or MRI demonstration of significant vascular burden (Roman et al., Reference Roman, Tatemichi, Erkinjuntti, Cummings, Masdeu, Garcia and Hofman1993) (large cortico-subcortical infarction; extensive subcortical white matter lesions superior to 25%; uni- or bilateral thalamic lacunae; lacunae in head of caudate nucleus; more than two lacunae). Furthermore, the exclusion of patients with significant vascular burden allowed us to ensure that our findings are due to AD pathology rather than vascular dementia.
Control participants (n=25) were recruited among the patients’ spouses, and age-matched hospital or university staff’s relatives; with no relevant history of neurological or psychiatric conditions. All control participants had normal MMSE scores (mean 29.3; range, 27–30), absence of cognitive complaints and were independently functioning members of the community.
All participants had no history of abnormal ophthalmological conditions and had normal or corrected-to-normal vision.
Informed consent was obtained from all participants, and the study was conducted in accordance with the tenets of the Declaration of Helsinki, with the approval of our local ethics committee.
The two groups were matched for age [t(53) =−1.149; p=.256; d=0.310], education levels [U=302; p=.204; η2=.029], and sex [χ2(1)=.039; p=.843; φ=0.027]. As expected MCI patients scored significantly lower on the MMSE than controls [U=257; p=.039; η2=.078]. Demographical and clinical characteristics of the population are shown in Table 1.
Table 1 Demographical and clinical characteristics of the population

Note. Data are expressed as mean (SEM).
MCI = mild cognitive impairment; MMSE = Mini-Mental State Examination; CDR = Clinical Dementia Rating; d = Cohen’s d effect size; φ = Phi effect size; r = Pearson r effect size for Mann-Whitney’s U test.
a DNA was isolated from whole blood using a commercial kit (Roche Diagnostics GmbH, Manheim, Germany), as described by the manufacturer. ApoE genotype was determined by polymerase chain reaction-restriction fragment length polymorphisms (PCR-FLP) assay. No differences were found between ApoE ε4 carriers and non-carriers [χ2(1)=2.133, p=.144].
b Among the group of ApoE ε4 carriers, 73% of subjects have a positive family history.
*p < .05.
Stimuli
The paradigm used in this study is based on the study of Graewe et al. (Reference Graewe, Lemos, Ferreira, Santana, Farivar, De Weerd and Castelo-Branco2013), in which participants had to discriminate between 3D SFM defined faces and scrambled shapes that were shown at three different durations (980 ms, 160 ms, and 100 ms). Nevertheless, in our study, only the intermediate duration condition (160 ms) was used as it was the only one capable of discriminating MCI patients from healthy elderly controls. Videos of 3D SFM defined faces (for details see Farivar et al., Reference Farivar, Blanke and Chaudhuri2009), scrambled faces, chairs, and scrambled chairs were used as stimuli.
The face stimulus consisted of one laser-scanned facial surface taken from the Max-Planck Face Database (Troje & Bulthoff, Reference Troje and Bulthoff1996). The surfaces were rendered into a volumetric texture map to ensure uniform texture density, a process analogous to carving a surface out of a stone block. Shadows and shading were removed from the rendering. The faces were rendered against a similarly textured random-dot background. During the animation, the face rotated from −22.5 degrees to 22.5 degrees, centered at the frontal plan, in one cycle (Fig. 1a).

Fig. 1 Stimuli and paradigm (adapted from Graewe et al., Reference Graewe, Lemos, Ferreira, Santana, Farivar, De Weerd and Castelo-Branco2013) (a) SFM faces rotated from left to right in one cycle and were shown during 160 ms. Object perception is rendered possible by integration of the moving dot pattern, the object being physically absent when the rotation/motion is absent; (b) The depth modulation resulted in SFM stimulus conditions with variable depth levels parameterized in terms of anterior–posterior range; (c) Stimuli were presented randomly at one of the three depth levels, separated by a fixation period during which the participants had unlimited time for response. The images of the heads included in the figure just illustrate the structure in the SFM stimuli and do not represent (because they are physically absent and not visible in static images) the exact percept constructed during the movies’ presentation.
In the present study, we also included the chair stimulus which was obtained from a chair model database and was rendered in exactly the same manner as the face stimulus. Scrambled versions of the two stimuli were constructed by cutting the rendered whole object (face or chair) videos on the horizontal plane into 10 blocks and scrambling their local curvatures/positions. The resulting scrambled stimuli share many of the low-level features of the original videos and are recognized as unfamiliar objects. It is important to note that these motion-defined objects are only visible when the animation is playing; otherwise participants are not able to interpret the SFM cues to extract a vivid 3D percept, as desired.
Stimulus depth information was parametrically manipulated at three different levels resulting in an overall 4 (stimulus category) × 3 (depth levels) design. The depth manipulation was included with the purpose of increasing the task complexity and unpredictability at variable 3D levels. The different depth levels created (full, intermediate, and flat) were, however, not intended as main outcome measures. They were, therefore, pooled for the purposes of this study (Fig. 1b). Ten trials per parameter value were included, in a total of 120 trials (Fig. 1c).
Procedure
Participants were individually tested in a quiet and darkened room. They were seated in a comfortable chair at a distance of 50 cm from the computer screen. The stimuli, subtending ~13° horizontally and ~10° vertically, were presented in the center of a 33.8 cm×27.1 cm dark computer screen (1280×1024 pixels) using the software package Presentation (Neurobehavioral systems).
Participants had to discriminate 3D SFM objects (faces and chairs) from 3D SFM meaningless objects (scrambled faces and scrambled chairs) on videos of 160 ms duration. The tasks were subdivided in a Chair discrimination task and a Face discrimination task in which participants had to report if the presented stimulus was upright or scrambled. The investigator recorded participants’ verbal responses using a 2-button response box to exclude confounding factors such as motor errors. The verbal instruction was the same for all participants and was as follows: “In this computer screen it will be briefly shown a video of a face (or chair) or a scrambled version of that face (or chair). You should look attentively and say if an upright or a scrambled face (or chair) was presented. After the video disappearance the screen will be black, and after your response another video will appear”.
Before performing the experimental tasks, all participants underwent a demonstration and a practice phase. In the demonstration phase, the stimuli included in both Face and Chair tasks were shown to allow the participants to become familiar with the objects that they would be asked to recognize afterward. Three learning trials were administered for each task condition. The practice phase was repeated whenever the participant did not understand the instructions.
Image (MRI) Acquisition
Participants underwent MRI scanning on a 3 Tesla (T) Siemens Magnetom Trio scanner (Erlangen, Germany), using a 12-channel birdcage head coil. All participants belong to a local MRI cohort database, comprising a total of 108 MCI and 76 controls, from which 30 MCI and 18 controls participated in the psychophysics experiment described in the above section.
One (and often two) high-resolution 3D T1-weighted magnetization-prepared rapid gradient echo (MP-RAGE) scans were collected per participant, with parameters defined on the basis of guidelines from the Alzheimer’s Disease Network Initiative (ADNI) (Jack et al., Reference Jack, Bernstein, Fox, Thompson, Alexander, Harvey and Weiner2008): field of view = 256, 160 slices, voxel resolution 1×1×1 mm3, repetition time = 2300 ms, echo time = 2.98 ms, inversion time = 900 ms, 9° flip angle, bandwidth 240 Hz/px, acceleration factor of 2 with 24 reference lines in the phase encoding direction. Acquisition parameters were optimized for increased gray-white matter image contrast, while minimizing acquisition time.
Image Analysis Procedures
Measurement of cortical thickness and volumes in individual participants
The structural MRI scans were processed with the FreeSurfer 5.0.0 software package (http://surfer.nmr.mgh.harvard.edu) using methods that are fully automated and extensively described (Dale, Fischl, & Sereno, Reference Dale, Fischl and Sereno1999; Desikan et al., Reference Desikan, Segonne, Fischl, Quinn, Dickerson, Blacker and Killiany2006; Fischl & Dale, Reference Fischl and Dale2000; Fischl et al., Reference Fischl, Salat, Busa, Albert, Dieterich, Haselgrove and Dale2002, Reference Fischl, van der Kouwe, Destrieux, Halgren, Segonne, Salat and Dale2004; Fischl, Sereno, & Dale, Reference Fischl, Sereno and Dale1999; Han et al., Reference Han, Jovicich, Salat, van der Kouwe, Quinn, Czanner and Fischl2006). Each magnetization-prepared rapid gradient-echo (MPRAGE) MRI acquisition image was visually inspected for abnormalities unrelated to the underlying pathology, such as movement artifacts or concomitant pathologies. When available, two MRI acquisitions for each participant (n=12/30 for the MCI group; n=10/18 for the control group) were motion corrected, averaged and normalized for intensity inhomogeneities, resulting on a single image. The resulting volume was used to locate the gray/white matter boundary, then used as a starting point to define the gray/cerebrospinal fluid boundary across the entire cortical mantle.
For each participant, cortical thickness was estimated at each point of the cortical mantle by finding the shortest distance from the white matter surface to the gray matter surface (and vice-versa) and averaging those two values (Fischl & Dale, Reference Fischl and Dale2000). The neocortex was parcellated onto 32 gyral-based regions-of-interest (ROI) (Fischl et al., Reference Fischl, Salat, Busa, Albert, Dieterich, Haselgrove and Dale2002, Reference Fischl, van der Kouwe, Destrieux, Halgren, Segonne, Salat and Dale2004), in each hemisphere, and in addition non-neocortical ROIs, such as the hippocampus, were defined on the basis of automated procedures (Desikan et al., Reference Desikan, Segonne, Fischl, Quinn, Dickerson, Blacker and Killiany2006). The neocortex automated atlas-based parcellation was used for labeling purposes in later cortical thickness data analysis stages.
For each participant, the accuracy of the gray and white matter surfaces and of each individual ROI was carefully inspected by a trained neuroradiologist. When necessary, manual editing and corrections were applied, precluding skull stripping, white matter, control points, and removing inclusion of dura matter in gray matter surface (http://surfer.nmr.mgh.harvard.edu/fswiki/FsTutorial/).
Registration and group cortical thickness maps
For each participant, the white matter surface was morphed to an average spherical surface folding pattern representation (this was performed one hemisphere at a time) from which surface maps of cortical thickness were generated, at each vertex of the cortical mantle (Fischl et al., Reference Fischl, Sereno and Dale1999). Smoothing of the data on the cortical tessellation was performed with a 2D surface-based Gaussian kernel of ≈20 mm full width half maximum (kernel sizes of 15 mm and 10 mm were also tested and the pattern of results did not change).
Data Analysis
Statistical analysis was performed with the SPSS statistical software package, version 19.0 (SPSS, Inc., Chicago, IL) with parametric and non-parametric tests (used when data significantly deviated from normal distributions, verified using the Kolmogorov-Smirnov normality check and Levene homogeneity tests), corrected for multiple comparisons, when applicable. Results with p < .05 were considered statistically significant.
Psychophysics
For the statistical analysis of the behavioral data, a d’ (dprime) performance measure [d’ = Z(hit rate) − Z(false alarm rate)], as well as a response bias measure [c=−0.5[z(hit rate)+z(false alarm rate)]] were computed for face and chair detection for each participant. A hit was considered when the subject recognized correctly the stimulus, whereas a false alarm was considered for conditions when the subject reported face/chair detection in the presence of a scrambled stimulus. Mann-Whitney U tests were performed for comparison between the two groups.
Imaging
Hippocampal volumes
Two non-neocortical ROIs, left and right hemispheres’ hippocampi, were used in this study with the purpose of assessing differences between MCI and control groups (independent samples t tests), in regions known to be pivotal in AD pathology. Volume measures were normalized for differences in estimated total intracranial volume through a ratio procedure.
Cortical thickness and vertex-based correlational analysis
Analysis was performed using the cortical thickness maps obtained through spherical mapping and smoothing. A vertex-by-vertex analysis was carried out using a general linear model, with cortical thickness as the dependent variable and group as the independent variable. Age interaction effects were considered, and the number of structural MR images was introduced as a nuisance factor. Correction for multiple comparisons was applied using false discovery rate (FDR) at a .05 significance level.
Correlational analysis was performed, on a vertex-by-vertex basis, regressing cortical thickness against behavioral performance measures (dprime), and nuisance factors were taken into account, with the inclusion of participants’ age and the number of structural images per participant. Again, correction for multiple comparisons was applied using FDR at a .05 significance level. The ROI clusters that survived FDR correction were delineated separately, and the corresponding value for mean cortical thickness was calculated for each of the MCI participants. To further examine the association between the ROI clusters’ mean cortical thickness and face recognition performance, spearman correlation coefficients were calculated. Additionally, hierarchical multiple regression was performed to account for the role of chronological age as a putative confound factor. Results were analyzed in terms of R2 and analysis of variance table for multiple regression, and also the coefficients table whenever previous results were statistically significant at a 5% significance level. Hierarchical multiple regressions were performed separately for the control and MCI group.
RESULTS
A Mann-Whitney test for the dprime values indicated that the MCI group (M=1.78; SD=1.27) performed significantly worse than the control group (M=2.72; SD=1.54) regarding face recognition (U=211.5; p=.006; η2=.138). Performance differences were also found for the chairs category (U=236; p=.016; η2=.105) with participants with MCI (M=5.97; SD=2.40) exhibiting more difficulties than control participants (M=7.56; SD=2.31) in distinguishing between 3D SFM chairs and 3D SFM meaningless shapes (Fig. 2). Response bias analyses revealed no significant differences between the groups, both for face (U=430.0; p=.352; η2=.016) and chairs conditions (U=422.0; p=.422; η2=.012). Accuracy measures revealed that both groups showed a higher performance level for the chairs category (MCI: M=.961; SD=.050; Controls: M=.989; SD=.021) than for the face recognition condition (MCI: M=.732; SD=.169; Controls: M=.855; SD=.108).
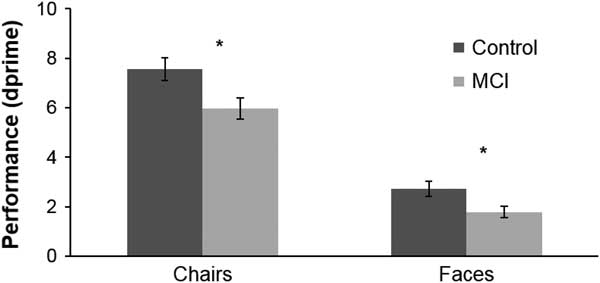
Fig. 2 Performance (as assessed by dprime measures) for the global Face and Chair Conditions. Stimulus duration: 160 ms. *significant difference (for exact p values see text).
Hippocampal Volumetry, Cortical Thickness, and Vertex-Based Correlational Analysis
Hippocampal volumes were smaller, bilaterally, in the MCI group (right: M=2.47; SD=0.35; left: M=2.28; SD=0.36), compared to control participants (right: M=2.69; SD=0.34; left: M=2.61; SD=0.34) reaching statistical significance for both right (t(46)=2.089; p < .05; d=0.638) and left (t(46)=3.117; p < .01; d=0.942) hemispheres (analysis performed independently for each hemisphere). On the other hand, no statistically significant differences in cortical thickness were observed between MCI and control groups.
Correlational analysis unveiled significant results for the MCI group, whereas similar findings were not observed for the control group. Significant correlations between cortical thickness and behavioral measures, for the MCI group, are depicted in Figure 3 (corrected for multiple comparisons; q(FDR) of 0.05). Positive associations of cortical thickness and the face recognition performance (as assessed by dprime values), for the right hemisphere (in line with the known right hemispheric lateralization for face recognition), were identified in the MCI group, comprising occipital lobe (BA18; ρ=0.583; p < .0005) and fusiform (BA37; ρ=0.320; p < .05) regions (Table 2, showing a region overlapping FFA as identified by Graewe et al. Reference Graewe, Lemos, Ferreira, Santana, Farivar, De Weerd and Castelo-Branco2013) involved in visual face processing. No significant correlations applied for the chairs condition.

Fig. 3 Statistical results rendered on an inflated gray matter surface. The cortical areas in which thickness positively correlates with dprime scores (see Table 2) are depicted. The color scale represents the p values as depicted for significant correlations (corrected for multiple comparisons: FDR at .05 significance level).
Table 2 Cortical areas showing positive correlations between thickness and psychophysical dprime scores in the MCI group in the face integration condition that differentiates between groups

Note. p-Values are reported at the vertex maxima for each cluster, and respective Talairach coordinates were estimated on basis of non-linear MNI to Talairach transformation (white matter surface). The fusiform cluster overlaps the previously described Fusiform Face Area region (Graewe et al., 2013). Spearman correlation coefficients (one-tailed) were estimated for the mean cortical thickness, of each significant cluster, and the dprime face recognition performance.
BA=Broadmann area; Area=cluster surface area in mm2.
To explore the impact of chronological age in this associations, a hierarchical multiple regression was performed applying the Enter method, using age and either cortical thickness of BA18 area or cortical thickness of BA37 area as independent variables for predicting the performance on face discrimination task.
Regarding the BA18 area, for the MCI group, and despite an inexistent statistically significant impact of age (R2=0.115; F(1,28)=3.632; p=.067), when it is considered combined with cortical thickness measure, both variables explain approximately 66% of the variability of the performance in the face discrimination (R2=0.660; F(2,27)=26.22; p < .001). Both variables present statistically significant coefficients, although greater importance can be ascribed to cortical thickness (b=4.485 + 0.682; p<.001) than to age (b=−0.044 + 0.018; p=.020). Notice that performance on face discrimination condition decreases with the decrease of cortical thickness in the BA18 area and the increase of age.
The same pattern was found concerning the BA37 area. In the MCI group, and despite an inexistent statistically significant impact of age (R2=0.115; F(1,28)=3.632; p=.067, as explained above), when it is considered combined with the cortical thickness measure, both variables explain approximately 48% of the variability found in the performance of face discrimination task (R2=0.482; F(2,27)=12.583; p < .001). Both variables present statistically significant coefficients for predicting face discrimination, although, once again, greater importance can be ascribed to the cortical thickness (b=2.279 + 0.520; p<.001) than to age (b=−0.068 + 0.022; p=.005). Performance on face discrimination task decreases with the decrease of cortical thickness in the BA37 area and the increase of age.
For the control group, we did not find any statistically significant impact of age, for itself, in changes in the performance in the face discrimination task.
Globally, face discrimination abilities seem to be associated with cortical thickness measures of both BA18 and BA37 areas, when age is considered as covariate, in MCI patients, but not in controls.
DISCUSSION
Here, we investigated the structural correlates of visual integration of 3D SFM face/objects, in MCI. Our paradigm requires visual integration across features, which involves dorsal stream motion coherence extraction, before visual ventral stream processing of object features (Farivar et al., Reference Farivar, Blanke and Chaudhuri2009; Graewe et al., Reference Graewe, Lemos, Ferreira, Santana, Farivar, De Weerd and Castelo-Branco2013). We had already established before that 2D and 3D motion integration is particularly deteriorated during normal and pathological ageing independently of lower level deficits (Castelo-Branco et al., Reference Castelo-Branco, Mendes, Silva, Massano, Januario, Januario and Freire2009; Graewe et al., Reference Graewe, Lemos, Ferreira, Santana, Farivar, De Weerd and Castelo-Branco2013; Mateus et al., Reference Mateus, Lemos, Silva, Reis, Fonseca, Oliveiros and Castelo-Branco2009)
Behavioral results confirmed that high level integration in visual face recognition is impaired in MCI, thereby extending previous results on coherence thresholds of simple spherical objects (Lemos et al., Reference Lemos, Figueiredo, Santana, Simoes and Castelo-Branco2012). Temporal requirements for visual integration were chosen (160 ms) to impose a performance challenge. We found an association of task performance with ventral stream integrity, suggesting that this pathway becomes a limiting step for performance in MCI.
While not excluding an important role for dorsal stream processing that was found in previous studies, the present results suggest that the ventral pathway also plays an important role, as demonstrated here for face stimuli, concerning whole brain structure-function correlation analyses. Indeed, the patients with larger fusiform cortical thickness had more preserved recognition performance, but only for faces and not chairs. These results do not dispute the notion that the dorsal stream is also affected as suggested by the work of Rizzo et al. (Reference Rizzo, Anderson, Dawson and Nawrot2000) on motion perception and our own previous imaging and psychophysical studies (Graewe et al., Reference Graewe, Lemos, Ferreira, Santana, Farivar, De Weerd and Castelo-Branco2013; Lemos et al., Reference Lemos, Figueiredo, Santana, Simoes and Castelo-Branco2012).
Although the main finding of this study is the observed structural functional correlations for faces, we cannot exclude that chair recognition might also be related to structural changes. Although chair recognition was also impaired, it is possible that the relatively higher performance levels precluded the identification of a structural correlate. Another novelty of our study is the report of visual structure-function correlations at the stage of MCI, as the majority of imaging studies on AD-related pathology have documented structural/functional changes of regions related with the memory impairment, such as the hippocampus and related structures in the medial temporal lobe (Albert et al., Reference Albert, DeKosky, Dickson, Dubois, Feldman, Fox and Phelps2011; Dubois et al., Reference Dubois, Feldman, Jacova, Cummings, Dekosky, Barberger-Gateau and Scheltens2010, Reference Dubois, Feldman, Jacova, Dekosky, Barberger-Gateau, Cummings and Scheltens2007; Sperling, Reference Sperling2011; Teipel et al., Reference Teipel, Grothe, Lista, Toschi, Garaci and Hampel2013). Nonetheless, previous studies have suggested that visual responses are modified in MCI and AD (Bokde et al., Reference Bokde, Lopez-Bayo, Meindl, Pechler, Born, Faltraco and Hampel2006; Mentis et al., Reference Mentis, Horwitz, Grady, Alexander, VanMeter, Maisog and Rapoport1996; Prvulovic et al., Reference Prvulovic, Hubl, Sack, Melillo, Maurer, Frolich and Dierks2002; Teipel et al., Reference Teipel, Bokde, Born, Meindl, Reiser, Möller and Hampel2007; Vannini et al., Reference Vannini, Almkvist, Dierks, Lehmann and Wahlund2007; Yamasaki et al., Reference Yamasaki, Muranaka, Kaseda, Mimori and Tobimatsu2012). However, it has remained difficult to establish a direct correlation with performance.
In our study, we found that behavioral performance is significantly correlated with cortical thickness. Accordingly, after controlling for different nuisance factors, we found significantly positive correlations with face recognition condition and thickness in both the occipital lobe (BA18), and the ventral fusiform (BA37) areas on the right hemisphere, in the MCI group. These correlations were found in the condition that was previously reported (Graewe et al., Reference Graewe, Lemos, Ferreira, Santana, Farivar, De Weerd and Castelo-Branco2013) to better discriminate MCI patients from healthy elderly and corroborated in the present study. Some psychophysical studies had indicated that the ventral visual pathway is more affected in AD spectrum (Cronin-Golomb, Reference Cronin-Golomb2004; Rizzo et al., Reference Rizzo, Anderson, Dawson and Nawrot2000) although, as stated above, this does not exclude afferent dorsal stream deficits (Bokde et al., Reference Bokde, Lopez-Bayo, Born, Ewers, Meindl, Teipel and Hampel2010; Kavcic et al., Reference Kavcic, Vaughn and Duffy2011; Lemos et al., Reference Lemos, Figueiredo, Santana, Simoes and Castelo-Branco2012).
The lack of cortical differences in the control group, as function of face recognition performance, suggest a disease specific mechanism. The positive associations of cortical thickness and face recognition performance identified in the MCI group suggest that the larger the amount of gray matter in this region, the higher the performance levels. This might suggest that the level of integrity of the visual ventral pathway is critical for object recognition in MCI. These findings are also consistent with the Scaffolding Theory of Aging and Cognition, which represents the brain as a dynamically adaptive structure that changes in both positive and negative ways with age (Reuter-Lorenz & Park, Reference Reuter-Lorenz and Park2014).
Our results confirm the tenet that the fusiform gyrus (BA37), comprising the fusiform face area, may be critically affected in distinct stages of the natural history of AD (Bokde et al., Reference Bokde, Lopez-Bayo, Meindl, Pechler, Born, Faltraco and Hampel2006; Graewe et al., Reference Graewe, Lemos, Ferreira, Santana, Farivar, De Weerd and Castelo-Branco2013; Teipel et al., Reference Teipel, Bokde, Born, Meindl, Reiser, Möller and Hampel2007). Furthermore, our findings do suggest that the right BA37 is more closely associated with performance changes which is also consistent with the notion of lateralization of face-selective responses in the right hemisphere (for a review, see Cabeza & Nyberg, Reference Cabeza and Nyberg2000). Moreover, the findings from the present work, corroborate the previous findings of Graewe et al. (Reference Graewe, Lemos, Ferreira, Santana, Farivar, De Weerd and Castelo-Branco2013) on the decreased sensitivity for faces in the right FFA, in MCI patients. The fusiform region identified in this study overlaps the FFA region described in that study. The involvement of extrastriate visual cortex may help explain the early visual deficits in AD-related pathology found by other groups (Risacher et al., Reference Risacher, Wudunn, Pepin, MaGee, McDonald, Flashman and Saykin2013; Rizzo et al., Reference Rizzo, Anderson, Dawson and Nawrot2000; Rose et al., Reference Rose, McMahon, Janke, O’Dowd, de Zubicaray, Strudwick and Chalk2006). The finding that the ventral pathway is important for SFM perception is consistent with the idea that ventral processing is also required for visual integration (James, Humphrey, Gati, Menon, & Goodale, Reference James, Humphrey, Gati, Menon and Goodale2002; Klaver et al., Reference Klaver, Lichtensteiger, Bucher, Dietrich, Loenneker and Martin2008; Orban et al., Reference Orban, Sunaert, Todd, Van Hecke and Marchal1999).
Our study also suggests new ways of studying complex object recognition (in particular face processing) and its neural correlates in pathological ageing. Dynamic aspects of a visual scene provide important cues for object segregation and identification, and 3D SFM paradigms are particularly relevant in this context. Dynamic cues are highly informative of an object’s shape and may be capable of driving complex recognition processes in the absence of other shape cues. The visual integration ability needed to achieve holistic perception of the whole 3D shape from local information seems to be impaired in MCI patients, and to also require the ventral pathway. Our results suggest the existence of important nodes within the ventral pathway that provide a substrate for 3D object processing in MCI.
In sum, we found evidence for a strong correlation between recognition of complex 3D moving faces and integrity in extrastriate and a fusiform region overlapping FFA in MCI.
ACKNOWLEDGMENTS
Authors thank all the participants. Authors also thank Carlos Ferreira and João Marques for help with MRI scanning, as well as Francisco Caramelo and João Pereira for help with statistical analysis. None of the authors have any conflict of interest related to this work. This work was supported by grants from the Foundation for Science and Technology Portugal: SFRH/BD/74070/2010 (to R.L.); PIC/IC/83206/2007 (to I.S.); Programa Ciência 2008 and PTDC/SAU-ENB/112306/2009 (to G.C.); CENTRO-07-ST24-FEDER− 00205, FCT- UID/NEU/04539/2013, and COMPETE, POCI-01-0145-FEDER-007440 (to M.C.B.).


