INTRODUCTION
Correcting for differences in head size improves the strength of associations between brain structures and cognitive variables of interest (Bigler & Tate, Reference Bigler and Tate2001). This correction is best accomplished using total intracranial volume (TICV), defined as the total volume of gray matter, white matter, meninges, and cerebrospinal fluid (CSF) within the skull. Normalizing brain structures by TICV reduces variability more effectively than normalization by cranial area or cerebral volume (Bigler et al., Reference Bigler, Neeley, Miller, Tate, Rice, Cleavinger and Welsh-Bohmer2004; Whitwell, Crum, Watt, & Fox, Reference Whitwell, Crum, Watt and Fox2001). TICV is consistent; it does not change with age or brain atrophy (Whitwell et al., Reference Whitwell, Crum, Watt and Fox2001). For these reasons, TICV is often used to correct for neuroanatomical volumetric differences between groups (Bigler & Tate, Reference Bigler and Tate2001; Sargolzaei et al., Reference Sargolzaei, Goryawala, Cabrerizo, Chen, Jayakar, Duara and Adjouadi2014) and neuroanatomical–cognitive associations (Bigler et al., Reference Bigler, Neeley, Miller, Tate, Rice, Cleavinger and Welsh-Bohmer2004).
Researchers can calculate TICV in several ways. The “gold standard” is manual tracing (Keihaninejad et al., Reference Keihaninejad, Heckemann, Fagiolo, Symms, Hajnal and Hammers2010) or manual editing of automatically derived TICV volumes. These methods require extensive training and time, however. Automatic TICV measurement programs are a more rapid alternative, but vary in accuracy and reliability (Ridgeway, Barnes, Pepple, & Fox, Reference Ridgway, Barnes, Pepple and Fox2011).
FreeSurfer, an established segmentation program, provides automatic TICV estimations. Estimated TICV (eTIV; Buckner et al., Reference Buckner, Head, Parker, Fotenos, Marcus, Morris and Snyder2004) is one Freesurfer TICV measurement method. It uses the extent of the transformation needed to register a participant’s image to a template to obtain an estimate TICV that includes all brain matter and CSF within the skull. This method is widely used; a search on PubMed showed over 200 citations for Buckner et al. (Reference Buckner, Head, Parker, Fotenos, Marcus, Morris and Snyder2004), which demonstrated the eTIV approach. There is some debate about accuracy, however. Some (e.g., Sargolzaei et al., Reference Sargolzaei, Goryawala, Cabrerizo, Chen, Jayakar, Duara and Adjouadi2014) report eTIV is more consistent with manual TICV than estimations from similar programs. Others (Nordenskjöld et al., Reference Nordenskjöld, Malmberg, Larsson, Simmons, Ahlström, Johansson and Kullberg2015), however, report that eTIV overestimates TICV.
As an alternative to eTIV, FreeSurfer can derive TICV from a native mask containing all voxels designated as gray matter, white matter, and ventricular and sulcal cerebral spinal fluid (CSF), as well as portions of subarachnoid CSF. This information is provided in a file labeled “brainmask.mgz,” referred to simply as “Brainmask” in the current study. Although not originally devised to contain all subarachnoid space, this rough skull strip can serve as an estimation of TICV. Furthermore, Brainmask does not use a template for registration, reducing potential registration-to-template errors encountered by other algorithms such as eTIV. Despite this advantage, few studies report using this method for TICV estimation, perhaps due to the program’s difficulty distinguishing between skull and CSF in T1 images during brain segmentation.
To our knowledge, no study has directly compared eTIV and Brainmask to manual TICV or examined how these two TICV measurements alter brain–behavioral associations when used as a correction variable. We designed the current study with two aims. First, we compared eTIV and Brainmask volume estimations to manual TICV. We hypothesized stronger associations between Brainmask and manual TICV relative to eTIV and manual. Second, we assessed the utility of eTIV and Brainmask metrics as TICV correction variables for expected associations between the left entorhinal cortex (ERC) and verbal memory in older adults. We hypothesized ERC volume-memory score associations would strengthen with Brainmask relative to eTIV correction.
METHODS
Participants
This was a retrospective data analysis conducted in accordance with the University of Florida’s Institutional Review Board and in compliance with the Declaration of Helsinki. Data were acquired via a larger federally funded investigation and included 40 individuals with Parkinson’s disease (PD) and 40 non-PD, demographically matched individuals. PD participants were included for convenience and to add behavioral range within the sample. All participants completed an MRI on a 3 Tesla scanner and a comprehensive neuropsychological assessment. Participants were required to be native English speakers, be at least 60 years of age, and have the ability to read and write. Further requirements included intact instrumental activities of daily living and non-demented via a comprehensive neuropsychological evaluation as part of a federally funded research investigation.
MRI Parameters and Structure Registration
Neuroimaging data were prospectively acquired with a Siemens 3T Verio scanner using an 8-channel head coil. We acquired two T1-weighted scans (176 contiguous sagittal slices, 1 mm3 voxels, field of view (FOV)=256 mm, sagittal orientation, 256×256 matrix, repetition time/echo time (TR/TE)=2500/3.77 ms, fliop angle (FA)=7 deg, 7/8 Partial Fourier, acquisition time 9:22) for structural brain analyses. The average of each participant’s two T1 scans was analyzed for the current study. T2-weighted images were acquired for skull segmentation (176 contiguous sagittal slices, 1 mm3 voxels, FOV=256, 256×256 matrix, sagittal orientation, TR/ TE=3200/ 409 ms, FA=7 deg, GeneRalized Autocalibrating Partial Parallel Acquisition, acquisition time 4:43). Images were visually examined for excessive motion, and those showing more than a moderate degree of motion were excluded from the analyses.
TICV Methods
Manual TICV.
FSL Brain Extraction Tool (BET; https://fsl.fmrib.ox.ac.uk/fsl/fslwiki/BET), a program that estimates the inner and outer skull surface using T1 and T2 input images, provided participants’ initial TICV mask extending into the inner surface of the skull and extracted in native space. These masks were then visually inspected by two trained raters and manually edited on every sagittal slice in ITK-SNAP (www.itksnap.org) so the mask filled the space within the inner surface of the skull (i.e., filled the subarachnoid CSF space not originally captured by BET). A straight line between the superior portion of the occipital bone and the clivus served as the ventral TICV landmark. This final mask served as the semi-automated measurement of TICV, which heretofore will be referred to as “Manual.” Two expert raters established inter and intra rater reliability by creating TICV on two separate occasions for 10 brains randomly selected from the sample. Final TICV reliability metrics were excellent [Dice similarity index (DSC) intra- and inter-rater reliability >0.99; ICC intra- and inter-rater reliability >0.91]. Intra- and inter-rater reliability did not differ between PD participants and controls.
Automated TICV
All MR images were processed using FreeSurfer 5.3, producing two different TICV estimates.
eTIV
As described in Buckner et al. (Reference Buckner, Head, Parker, Fotenos, Marcus, Morris and Snyder2004), a 12-parameter affine transformation was used to transform each individual’s MPRAGE scan to match the Talairach template in MNI space. This transformation produced an atlas scaling factor, computed as the reciprocal of the atlas determinant. This number represents the eTIV, and is the extent of contraction or expansion required for the image to match the template. This estimation includes all CSF within the skull, including subarachnoid CSF.
Brainmask
During the initial skull strip processing in FreeSurfer, an output image called “brainmask.mgz” is created. This volumetric mask, traditionally used as a skull strip for further analysis, provides a liberal outline of the brain with some subarachnoid CSF included, and contains all voxels in the brain determined to be grey matter, white matter or CSF. The total voxel count is used as a metric of TICV. Unlike eTIV, Brainmask creates a three-dimensional (3D) volume file that can be used for spatial overlap analyses with manual TICV. For this analysis, we did not manually edit Brainmask.
ERC Acquisition
Structural T1 scans were processed via FreeSurfer 5.3 (Segonne et al., Reference Segonne, Dale, Busa, Glessner, Salat, Hahn and Fischl2004; Fischl et al., Reference Fischl, Salat, Busa, Albert, Dieterich, Haselgrove and Montillo2002; http://surfer.nmr.mgh.harvard.edu/). An averaged brain with enhanced gray-white contrast and increased signal-to-noise was aligned to the MNI152 template brain using a linear registration technique with 6 degrees of freedom (FLIRT; Jenkinson, Bannister, Brady, & Smith, Reference Jenkinson, Bannister, Brady and Smith2002) to correct for head tilt and align participants’ brains along the anterior commissure–posterior commissure axis. Freesurfer’s automatic ERC volumes were not used due to their limited reliability (McCarthy et al., Reference McCarthy, Ramprashad, Thompson, Botti, Coman and Kates2015). Instead, an expert reliable rater (J.T.; intra-rater DSC>0.8; inter-rater reliability DSC>0.80) manually traced the entorhinal cortices using published criteria (Insausti et al., Reference Insausti, Juottonen, Soininen, Insausti, Partanen, Vainio and Pitkänen1998). Starting 2 mm posterior to the appearance of the temporal stem, the lateral wall of the parahippocampal gyrus was traced between the sulcus semiannularis and the collateral sulcus, descending into the collateral sulcus at varying depths depending on its overall depth. This method produces volumes that have been associated with verbal memory performance in older adults with and without Parkinson’s disease (Price et al., Reference Price, Wood, Leonard, Towler, Ward, Montijo and Schmalfuss2010; Tanner et al., Reference Tanner, Mareci, Okun, Bowers, Libon and Price2015).
Verbal Memory Measure
The Logical Memory (LM) subtest of the Wechsler Memory Scale-Third Edition (WMS-III; Wechsler, Reference Wechsler1997) assessed verbal learning and memory. The primary outcome variable of interest was number of items recalled at delayed recall divided by the number of items recalled at immediate recall, known as Logical Memory Retention (LMret). The values used in the analysis were Z-scores derived from the WMS-III normative sample, which is stratified by age group.
Statistical Analysis
Reliability
Lin’s concordance correlation coefficient (CCC; Lawrence & Lin, Reference Lawrence and Lin1989) assessed reliability for eTIV and Brainmask relative to Manual. A DSC examined overlap between Brainmask and Manual. DSC could not be calculated between eTIV and Manual because eTIV is not a 3D volume. A Fisher Z statistic examined the extent of differences between correlation coefficients.
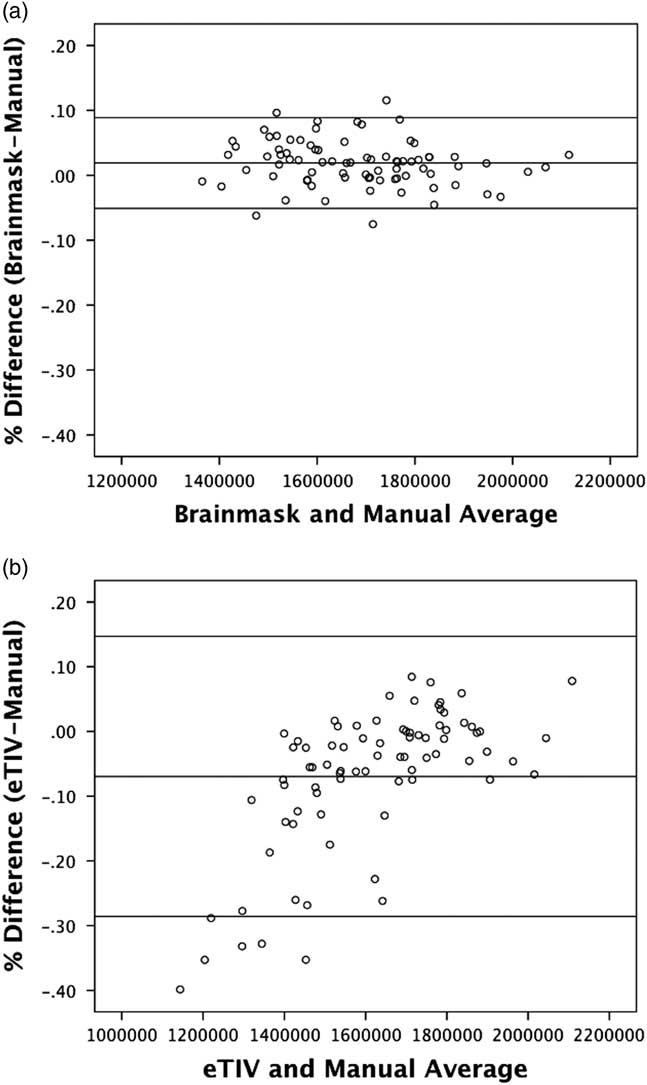
A Bland-Altman analysis was also used to assess the degree of disagreement between the automatic and manual TICV measures (Altman & Bland, Reference Altman and Bland1983). Bland-Altman plots show differences between two measures by plotting the average of the two measures versus the difference between the two measures. Lines are then added for the mean difference and at ±1.96 standard deviations from the mean difference, termed the “agreement range.” This method shows the range of values in which the majority of error is likely to occur. It also shows whether measurement errors are consistent at all values (i.e., at all values of TICV) or if it is uneven with different values (i.e., shows more inaccuracy at lower or higher values of TICV).
ERC-LMret associations
Three-step hierarchical regressions examined TICV metrics contributed to ERC and LMret. Step one included PD status as a nuisance variable. Step two included ERC raw volume predicting retention. Step three examined how each TICV metric altered the overall model strength and ERC-LMret association.
RESULTS
Participants
The two participant groups did not statistically differ in age, education, gender, or general cognition as measured by the Mini Mental State Examination (Folstein, Folstein, & McHugh, 1977) (Supplementary Table 1). PD participants had a significantly larger mean TICV than controls according to all three TICV metrics.
eTIV/Brainmask Volumes and Reliability to Manual TICV
Results of the reliability analyses are shown in Table 1. Relative to manual TICV, Brainmask volumes were significantly larger (1.88% ± 3.56% difference; t(79)=4.67; p<.01), while eTIV volumes were significantly smaller than Manual (−6.91%±11.04% difference; t(79)=5.67; p<.01) and showed a greater variability than Manual or Brainmask estimations. On an individual level, the largest percent difference between an eTIV and Manual estimation for a single image was 40%, while the largest difference between a Brainmask and Manual estimation for a single image was 12%.
Table 1 Reliability statistics comparing Brainmask and eTIV to manual TICV

Note. %Diff=percent difference between FreeSurfer measures; CCC=concordance correlation; DSC=Dice similarity coefficient; NA=not applicable. The range of % difference scores is provided in parentheses. p<0.001 for all correlations. Volume is presented in cubic centimeters, and ERC is presented as percentage of TICV. SD is presented in parentheses. Beta weights when controlling for TICV using all three methods, ß=beta weights controlling for TICV with each method. ∆ß=change in ß from no TICV correction.
*p< 0.05.
Brainmask volume estimations strongly correlated with Manual (r[80]=0.94; CCC=0.92; p<.01). There was also high spatial and volumetric overlap between Manual and Brainmask (DSC=0.95). Correlations between eTIV and Manual were weaker but significant (r[80]=0.82; CCC=0.68; p<.01). Brainmask/manual and eTIV/manual coefficient values were statistically different from one another (Fisher Z=3.61; p<.01).
The results of the Bland-Altman plots (Figure 1) showed Brainmask has a much smaller 95% range of agreement (Figure 1a; −5.09% to 8.85% difference) than eTIV (Figure 1b; −28.55% to 14.73% difference), indicating QJ;eTIV has a higher degree of error. The most severe underestimations by eTIV occurred in individuals with smaller TICVs, indicating a greater chance of inaccuracy of eTIV when measuring smaller TICVs. Correspondingly, there was a strong association between TICV and eTIV estimation error (r=−0.66; p<.001). In contrast, the correlation between TICV and Brainmask error was not significant (r=−0.17).

Fig. 1 Results of the Bland-Altman plots: X-axis represents average TICV in cubic mm. Y-axis represents % difference between automatic TICV methods and manual TICV.
ERC-LM Retention Associations
Results of this analysis are displayed in Table 1. Step 1 of the hierarchical regression analysis showed a significant effect of group (R2=0.07; p=.02). Step 2 of the hierarchical model found ERC raw volume positively associated with LMret (∆R2=0.23; p=.04). Adding in manual TICV to the model increased the ERC-LMret beta weights (ß=0.27; p=.02), despite no change to the overall model (∆R2=0.02; p=.20). The same pattern was found when using Brainmask (∆R2=0.04; p=.06; ß=0.29; p=.01) as well as eTIV (∆R2=0.02; p=.26; ß=0.25; p=.02).
DISCUSSION
Two Freesurfer TICV metrics differed significantly in size and association to the traditional gold standard hand drawn approach. Each TICV metric explained additional variance for ERC-memory associations with Brainmask explaining the most variance. These findings show TICV metrics are not all alike and choice of metric deserves consideration, particularly for brain–behavioral investigations.
In our sample, Brainmask volumes were larger than manual TICV, while eTIV volumes were smaller. The overestimation in Brainmask volumes may reflect FreeSurfer’s difficulty discriminating brain from skull, resulting in small regions of skull being included in the final TICV measurement (Segonne et al., Reference Segonne, Dale, Busa, Glessner, Salat, Hahn and Fischl2004). Although larger, Brainmask volumes are prefereable to eTIV volumes for at least two reasons. First, Brainmask showed a statistically stronger association with Manual. Second, Bland-Altman analyses revealed larger errors in eTIV; there were greater estimation errors in individuals with smaller manual TICVs compared to those with larger manual TICVs. We also note that adusting for TICV using Brainmask rather than eTIV resulted in larger positive ERC-LMret beta weights.
We recognize study limitations. The significance of TICV correction was likely minimized by our study sample of non-demented older adults with little to no brain atrophy; we may have observed a more striking difference in TICV metric if participants with brain volume loss (e.g., dementia) had been included in this investigation. In addition, given that Brainmask does not theoretically include portions of subarachnoid space, it may be a less accurate measure of TICV in older populations when atrophy results in an increase in subarachnoid space. We did not run the FreeSurfer recon-all script also importing T2-weighted images, which might have improved Brainmask estimations. Finally, Brainmask is theoretically more related to total brain volume than TICV, despite our findings showing it is a good estimation of TICV. For all of these reasons, future studies should assess the association between Brainmask, other TICV metrics, and total brain volume in neurodegenerative disorders.
Given these findings, we provide the following recommendations to non-dementia researchers. TICV estimatations with eTIV may need manual editing, particularly for poor registrations to templates. If researchers use eTIV, we encourage reporting steps taken to correct registration errors (for example, a description of quality control checks and a count of images requiring manual manipulation). Given the time demands of manual editing, researchers may wish to use Brainmask as the metric appears accurate to manual measurements and requires little or no manual intervention with high quality scans. A cons to working with Brainmask is that potential underrepresentation of subarachnoid CSF space. As newer software updates become available to the research community, it is imperative not only to assess their reliability relative to manual volumes, but also their effectiveness in controlling for head size when assessing brain volume and cognition associations.
ACKNOWLEDGMENTS
Samuel J. Crowley, Jared J. Tanner, Daniel Ramon, Nadine A. Schwab, Loren P. Hizel, and Catherine C. Price declare that they have no conflicts of interest. We are most grateful to the time and efforts of the research participants. We are also grateful to Tony Mancuso, Ph.D., Chair, Department of Radiology, University of Florida, Gainesville, Florida, for help acquiring use of the Siemens 3T Verio Scanner. This work was supported by the NIH grants K23NS60660, NS082386NR014810, as well as the National Institutes of Health Clinical and Translational Science Award program, grants UL1TR001427, KL2TR001429 and TL1TR001428. The content is solely the responsibility of the authors and does not necessarily represent the official views of the National Institutes of Health.
Supplementary material
Supplementary material can be found online. Please visit https://doi.org/10.1017/S1355617717000868.