INTRODUCTION
Working memory (WM) stores task-relevant information over a few seconds at the service of other ongoing mental activities (Cowan, Reference Cowan2001; Luck & Vogel, Reference Luck and Vogel1997). As a core aspect of cognition (Cowan, Reference Cowan2001), WM is highly limited in the amount of information that can be simultaneously maintained over a short period of time (Cowan, Reference Cowan2001; Luck & Vogel, Reference Luck and Vogel2013; Zhang & Luck, Reference Zhang and Luck2008, Reference Zhang and Luck2011). This sets a major constraint on a wide range of cognitive and affective processes, such as attention (Kane et al., Reference Kane, Poole, Tuholski and Engle2006), fluid intelligence (Conway et al., Reference Conway, Cowan, Bunting, Therriault and Minkoff2002), processing of affective information (Lynn et al., Reference Lynn, Ibagon, Bui, Palitz, Simon and Barrett2016; Xie et al., Reference Xie, Li, Ying, Zhu, Fu, Zou and Cui2017), and emotional regulation (Schmeichel et al., Reference Schmeichel, Volokhov and Demaree2008). In addition, compromised WM is also frequently associated with declines in various health-related factors, such as poor sleep quality (e.g., Wee et al., Reference Wee, Asplund and Chee2013), depressed mood (e.g., Xie et al., Reference Xie, Cappiello, Park, Deldin, Chan and Zhang2018a), and age (e.g., Peich et al., Reference Peich, Husain and Bays2013), suggesting the importance of WM assessment in translational research.
For example, naturally occurring and experimentally induced sleep loss can significantly impair WM (Chee & Chuah, Reference Chee and Chuah2007; Smith et al., Reference Smith, McEvoy and Gevins2002; Waters & Bucks, Reference Waters and Bucks2011; Wee et al., Reference Wee, Asplund and Chee2013). Although these impairments have been taken as evidence for reduced WM capacity (i.e., the amount of information maintained in WM), a reduction in memory quality might also account for these findings (see Xie & Zhang, Reference Xie and Zhang2016; Reference Xie and Zhang2017a, Reference Xie and Zhang2017b; Zhang & Luck, Reference Zhang and Luck2009, Reference Zhang and Luck2011 for some discussions). To clarify this issue, Wee et al. (Reference Wee, Asplund and Chee2013) recently distinguished the effects of sleep deprivation on the quantitative (e.g., the number of remembered stimuli) and qualitative (e.g., precision; how precisely a given memory representation corresponds to the original to-be-remembered physical stimulus) aspects of visual WM using a procedure and a mathematical model developed by Zhang and Luck (Reference Zhang and Luck2008). They found that sleep deprivation had a detrimental effect on the number, instead of the precision, of retained WM representations.
However, disrupted sleep is often coupled with other factors, such as depressed mood (Banthia et al., Reference Banthia, Malcarne, Ko, Varni and Sadler2009; Zawadzki et al., Reference Zawadzki, Graham and Gerin2013) and age (Maglione et al., Reference Maglione, Ancoli-Israel, Peters, Paudel, Yaffe, Ensrud and Stone2014; but see Ohayon et al., Reference Ohayon, Zulley, Guilleminault, Smirne and Priest2001; Ohayon et al., Reference Ohayon, Carskadon, Guilleminault and Vitiello2004), which are also associated with reduced WM functions (Adams et al., Reference Adams, Stanczak, Leutzinger, Waters and Brown2001; Arnett et al., Reference Arnett, Higginson, Voss, Bender, Wurst and Tippin1999a; Hubbard et al., Reference Hubbard, Hutchison, Turner, Montroy, Bowles and Rypma2015; Park et al., Reference Park, Lautenschlager, Hedden, Davidson, Smith and Smith2002). It is thus unclear whether reduced WM capacity under experimentally induced sleep deprivation, as shown by Wee et al. (Reference Wee, Asplund and Chee2013), is a direct result of disrupted sleep or a secondary effect of factors associated with sleep loss (e.g., a transient change in depressed mood; Zawadzki et al., Reference Zawadzki, Graham and Gerin2013), and whether these effects can be generalized to poor sleep quality in everyday life.
The present study thus examines how self-report measure of sleep quality in everyday life and two related factors (depressed mood and age) are associated with WM capacity and precision using an individual-differences approach. In brief, Study 1 assessed the contributions of sleep quality and depressed mood to reduced WM capacity in a college sample. Study 2 further evaluated these adverse effects of poor sleep quality and depressed mood on WM in a community sample with a wider age range. We hypothesize that poor everyday sleep quality is mostly associated with reduced WM capacity, but less so with WM precision (Wee et al., Reference Wee, Asplund and Chee2013), and this effect can be dissociated from the contributions of depressed mood and age on WM.
STUDY 1
Method
Participants
One hundred and ten college students (19.50 ± 1.51 years; 68 female) from the University of California, Riverside, participated in this study. This sample size was determined based on a power analysis using G*Power (Faul et al., Reference Faul, Erdfelder, Buchner and Lang2009) for 80% power using a r-based effect size at a medium level (.20 to .30), considering that the present study focused on individual differences manifested as correlational patterns across participants. All participants reported normal (or corrected-to-normal) visual acuity and normal color vision. Three additional participants who scored >20 in the depressed mood scale (see Method section; classified as “major depression, severe”) were excluded from data analysis. Nonetheless, the inclusion of these three participants did not substantially influence the results. The University of California, Riverside institutional review board approved this study. All the participants gave their written informed consent prior to the study and received course credits for their participation.
Procedure
Participants performed a computer-based WM task for independent estimates of the number and precision of retained WM representations (Zhang & Luck, Reference Zhang and Luck2008). Subsequently, they completed questionnaires capturing sleep quality and depressed mood.
WM task
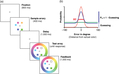
In this task (Figure 1a), participants were instructed to remember an array of four color squares that were simultaneously presented on the screen for 400 ms. The locations of color squares were randomly selected from a set of eight possible locations that were equally spaced on an invisible circle (4.5° radius). The colors on each trial were randomly chosen from 180 colors that were evenly distributed on a circle in the Commission Internationale de l’Eclairage Lab color space (see Zhang & Luck, Reference Zhang and Luck2008 for details). All colors had comparable luminance and varied mainly in hue and slightly in saturation. After a short delay of 1000 ms, the test array appeared. It contained all but one color from the memory array, in addition to a continuous color wheel (radius = 8.2°; thickness = 2.2°) with all 180 colors in the chosen color space. The missing color (indicated by empty square) was randomly chosen from the presented color squares in the previous sample array. Participants were required to report the color of this probed item – based on their memory – as precisely as possible using a computer mouse to click a matching color on the wheel. The performance on each trial was measured as the error in degrees between the color chosen by the participant and the actual color shown in the sample array. All observers completed five blocks of 30 trials, yielding 150 trials in total.

Fig. 1. A sample trial of the color recall WM task. (a) Immediately after an 800 ms fixation, a sample array of five colored squares was presented for 400 ms, followed by a 1000 ms delay interval. A test array appeared after the delay and stayed on screen until participants provided recall responses. The test array consisted of all but one colored square from the sample array and a continuous color wheel of 180 equally spaced colors. The missing color (marked by an outline square) was randomly chosen from the sample array, indicating the probed color for recall. That is, the participants tried to reproduce its color from memory by clicking on the best matching color on the color wheel. Immediately following the recall response, the actual color presented in the sample array was marked on the color wheel by an arrow as online feedback. The difference between the actual color presented in the memory array and the reported color (i.e., recall error) was aggregated across trials and fitted with the MLE model fitting procedure. (b) A hypothetical distribution of recall errors (solid line) could be decomposed into a uniform distribution (bolded dashed line) representing guesses and a von Mises distribution (light dashed line) representing noisy memory representations. The probability of remembering (Pm ) is 1 minus the probability of guessing, manifested as the height of the uniform distribution. The number of retained WM representations (K) is thus Pm × memory set size. SD of the von Mises distribution (in degrees) is inversely related to the precision of retained WM representation.
Sleep quality
The Pittsburgh Sleep Quality Index (PSQI) was used to assess participants’ sleep quality over the last month (Buysse et al., Reference Buysse, Reynolds, Monk, Berman and Kupfer1989). It consists of 10 multi-component questions. The full index is a summation of seven subscores, including Duration of Sleep, Sleep Disturbance, Sleep Latency, Day Dysfunction due to Sleepiness, Sleep Efficiency, Overall Sleep Quality, and Need of Medication to Sleep (see Supplementary Table S1 for correlations among these subscores and other measures of interest). Each subscore ranges from 0 to 3, and therefore the full index ranges from 0 to 21. Higher scores indicate poorer sleep quality.
Depressed mood
The Patient Health Questionnaire-9 (PHQ-9) is a self-report measure of depressive symptoms over the previous 2 weeks (Kroenke & Spitzer, Reference Kroenke and Spitzer2001). Participants respond to nine symptom questions by indicating how often in the past 2 weeks they have been bothered by those symptoms using a four-point scale (from “not at all = 0” to “nearly every day = 3”). Possible scores range from 0 to 27, with 0 indicating no experience of depression and 27 reflecting severe depression.
Data analysis
WM task
Participants’ recall errors in the WM task were fitted with Zhang & Luck’s (Reference Zhang and Luck2008) standard mixture model using a maximum likelihood estimation (MLE) procedure. With this procedure, recall errors (solid line in Figure 1b) can be decomposed into a weighted summation of two components, one representing a graded and noisy memory representation for the probed item when it was encoded in memory (light dashed line), and the other representing random guesses when the probed item was absent from memory (bolded dashed line). The proportion of retained noisy memory representations, Pm (i.e., probability of remembering), is inversely related to the proportion of random guesses (1 − Pm), which can be captured as the height of the tails in the recall error distribution (see Figure 1b). The number of stimuli that can be retained in WM (denoted by K) is therefore the product of memory set size (the number of to-be-membered items) and Pm. WM precision is further defined as the standard deviation (SD) of the distribution for retained noisy memory representations. Note, a smaller SD is associated with higher WM precision.
Analysis of individual differences
Multicollinearity is an issue when assessing independent contributions of multiple predictors to an outcome variable (e.g., Alvaro et al., Reference Alvaro, Roberts and Harris2014). Without removing the conceptually overlapping items in measurement that can lead to multicollinearity, the effects of sleep quality and depressed mood on WM could be confounded by the inflated correlation between the two variables. To assess the independent effects of sleep quality and depressed mood on WM, we therefore eliminated these overlapping items. Specifically, the PHQ-9 scale contains an item conceptually similar to sleep quality (item 3 on the PHQ-9), and the PSQI has a subscore measuring daily dysfunction due to sleepiness, which is highly related with depressed symptoms (items 8 and 9 on the PSQI). Correlational analyses were conducted and reported for both the original and the non-overlapping versions of the PSQI and PHQ-9 scores. To examine their potentially independent effects on WM capacity, we further performed a path analysis for the effects of sleep quality and depressed mood on WM measures based on the non-overlapping scores of the PSQI and the PHQ-9 using the R package (R Core Team, 2014).
Results and Discussion
Correlational analyses
Sleep problems and depressed mood were highly correlated with each other (based on non-overlapping items: r = .38 [.21, .53], p < .001; with overlapping items: r = .54 [.40, .66], p < .001; see Table 1), and they were both associated with decreased WM capacity (see Figure 2). Specifically, the number of retained WM representations (K) was negatively correlated with both poor sleep quality as measured by PSQI scores (r = −.28 [−.44, −.10], p = .003; Figure 2a) and depressed mood as measured by PHQ-9 scores (r = −.27 [−.43, −.08], p = .005; Figure 2c). In contrast, SD (precision−1) was not significantly correlated with either PHQ-9 (Figure 2b) or PSQI (Figure 2d) scores, regardless of the original or non-overlapping versions of the scales (all p’s > .05; see Table 1). Critically, the correlation between K and depressed mood was significantly larger than the correlation between SD and depressed mood (z = 2.58, p < .01), using the one-tailed test on correlated correlations (Meng et al., Reference Meng, Rosenthal and Rubin1992). Likewise, the correlation between K and sleep quality was significantly greater than the correlation between SD and sleep quality (z = 3.21, p < .001). These correlations remained robust when the overlapping items in the PHQ-9 and the PSQI were removed (non-overlapping PHQ-9: r = −.27 [−.43, −.09], p = .005; non-overlapping PSQI: r = −.27 [−.44, −.09], p = .004), as summarized in Table 1. Overall, these findings suggested that both poor sleep quality and depressed mood could reduce the amount of information that can be maintained in WM.
Table 1. Correlations of WM measurements, age, depressed mood, and sleep quality in Study 1
Note. Depressed mood was assessed with the Patient Health Questionnaire-9 (PHQ-9). Sleep quality was measured with the Pittsburgh Sleep Quality Index (PSQI) questionnaire.
a Scores from full scales of the PHQ-9 and the PSQI.
b Scores from the conceptually non-overlapping versions of the PHQ-9 and the PSQI.
* p < .05.
** p < .01.
Fig. 2. Effects of depressed mood and sleep quality on WM capacity in Study 1. Sleep quality (score from the full scale of the PSQI) was significantly correlated with WM capacity (a), but not with precision (b). Depressed mood (score from the full scale of PHQ-9) was significantly correlated with WM capacity (c), but not with precision (d). The solid lines represent the linear regression prediction. The broken lines represent 95% confidence intervals (CIs) for the linear regression prediction. Pearson correlation coefficient (r) and Spearman rank-order correlation coefficient (ρ) are presented in the figure. *p < .05, **p < .01.
Path analysis
We then conducted a path analysis on the non-overlapping version of PSQI and PHQ-9 scores to further test the independent influences of sleep quality and depressed mood on WM capacity and precision simultaneously (also see Online Supplementary for the path analysis based on the full version of the scales and additional analysis based on group means; Supplementary Table S2). As shown in Figure 3, the non-overlapping versions of PSQI (β = −.20 [−.39, −.01], SE = .098, p = .042) and PHQ-9 (β = −.19 [−.38, −.01], SE = .098, p = .048) scores were independently predictive of individual difference in the number of retained WM representations (K). In contrast, neither sleep quality (β = .11 [−.09, .31], SE = .102, p = .29) nor depressed mood (β = .01 [−.19, .21], SE = .102, p = .94) significantly predicted individual difference in WM precision (SD).
Fig. 3. Correlated predictive model of sleep quality, depressed mood, and WM. K denotes the number of retained WM representations, as an estimate of capacity; SD denotes variability in retained WM recall errors, which is inversely related to precision. The broken lines indicate non-significant relationships. Note, non-overlapping PHQ-9 and PSQI scores were used in this multiple regression analysis *p < .05.
Conclusion
In summary, these findings demonstrated that both depressed mood and poor sleep quality could reduce WM capacity. More importantly, the detrimental effect of sleep disturbance on WM could not entirely result from the depressed mood that was associated with poor sleep quality.
STUDY 2
Study 1 showed that depressed mood and poor sleep quality primarily reduced WM capacity with a minimal impact on WM precision. It is important to demonstrate that the lack of precision effects was not due to insensitive measurement of WM precision in the current paradigm. Study 2 thus tested an additional health-related factor, age, which was previously associated with reductions in WM precision (e.g., Noack et al., Reference Noack, Lövdén and Lindenberger2012; Peich et al., Reference Peich, Husain and Bays2013; Pertzov et al., Reference Pertzov, Heider, Liang and Husain2015). Note, some previous reports attributed declines in WM function over age to reduced storage capacity (e.g., Park et al., Reference Park, Lautenschlager, Hedden, Davidson, Smith and Smith2002). However, these previous studies did not separately estimate WM capacity and precision, leaving open the possibility that these previous effects could result from decreases in WM precision. Study 2 also isolated the effects of sleep disturbance on WM from the effects of age on WM, given that both sleep problems (e.g., Mellor et al., Reference Mellor, Waters, Olaithe, McGowan and Bucks2014) and depression-related psychological conditions (e.g., Sözeri-Varma, Reference Sözeri-Varma2012) may change with age.
To achieve these two goals, Study 2 tested a community sample (n = 31) with larger variability in age (21–77 years). Given the potential increased variability in perceptual and motor abilities in community participants, the overall effects on WM, especially effects on WM precision (inversely related to variability), could potentially result from the effects on perceptual and motor processing (Gold et al., Reference Gold, Hahn, Zhang, Robinson, Kappenman, Beck and Luck2010). Study 2 thus included a motor control task and a perception control task (for details, see Method and Gold et al., Reference Gold, Hahn, Zhang, Robinson, Kappenman, Beck and Luck2010) to test whether compromised WM, if any, could be attributed to problems in motor functions or perception.
Method
Participants
Participants were recruited from the greater Ann Arbor community as part of a large-scale genetics research project (see Berry et al., Reference Berry, Demeter, Sabhapathy, English, Blakely, Sarter and Lustig2014 for details) examining the relationship between cognitive functions and a polymorphism limiting cholinergic capacity (Ile89Val variant [rs1013940] of the choline transporter gene SLC5A7). Participants with this polymorphism may exhibit different susceptibility to external distraction (Berry et al., Reference Berry, Demeter, Sabhapathy, English, Blakely, Sarter and Lustig2014) as compared to participants without the polymorphism. However, they did not significantly differ in the qualitative or quantitative estimates of WM in the present study (the number of retained items, K: t (29) = 0.20, p = .84; precision−1, SD: t (29) = 0.58, p = .57). The two groups of subjects were therefore combined for present analyses to increase statistical power. Analyses included a total of 31 participants (17 female) who completed the present WM task and met the following criteria: (1) participants were free from current psychopharmacological medication (e.g., selective serotonin reuptake inhibitors); (2) they reported normal (or corrected normal) visual acuity and color vision; and (3) they were currently not suffering from severe depressive symptoms (all scoring <9 on the PHQ-9; Kroenke & Spitzer, Reference Kroenke and Spitzer2001). Participants’ age ranged from 21 to 77 years (M = 46.32, SD = 16.91), and years of education ranged from 12 to 20 (M = 15.87, SD = 2.35). The sample size of this study was determined by the actual number of eligible participants meeting these mentioned criteria. Based on G*Power (Faul et al., Reference Faul, Erdfelder, Buchner and Lang2009), this sample size is sensitive to detect, with 80% power, a statistically significant effect size r as small as .42. As estimated by Peich et al. (Reference Peich, Husain and Bays2013), the size of correlation between age and reduced WM precision was about .51, which is >.42. Based on this estimate, the current sample size would have sufficient statistical power to demonstrate a significant effect between age and WM precision.
The University of Michigan institutional review board approved the current study. All the participants gave their written informed consent at the beginning of the study and received monetary compensation ($10) for their participation.
Procedure
The procedure was the same as that in Study 1 with the exception on the two control tasks. The two control tasks were modeled from Gold et al. (Reference Gold, Hahn, Zhang, Robinson, Kappenman, Beck and Luck2010) and run at the beginning of the test session. In the motor control task, observers used the computer mouse to click on specified points on the color wheel. In the subsequent color perception control task, the target color and color wheel were shown simultaneously and the observer was instructed to click on the matching color on the color wheel. The motor and perceptual control tasks were included to estimate errors in motor responses and perception, respectively, both of which are presumably independent of errors resulting from noisy representations in WM. The motor control task and the subsequent perceptual control task contained 30 trials each.
Data analysis
The data analysis routines were the same as those in Study 1 with the following exceptions. First, the small number of trials in the two control tasks also made it practically impossible to obtain reliable mixture model fits (30 trials per task in the present study, as opposed to 150 trials as suggested in Zhang & Luck, Reference Zhang and Luck2008). Instead, the overall circular SD was analyzed and reported for the two control tasks. Mathematically the overall circular SD approached the SD of the mixture model as Pm approached 1, which is the case in the control tasks where the perception of and motor responses for a single item are not limited by capacity. Therefore, the overall circular SD for the two control tasks can be used to measure the precision of perception and motor responses, respectively, in a way that is equivalent to the SD of the mixture model in the WM task. Second, path analysis was not conducted due to the small sample size in Study 2. Last, in addition to correlational analyses for the relationships between age and WM, as a complementary test, the participants were categorized into two age groups based on median split of age (younger adult group: age < 50, M = 31.60, SD = 6.71; older adult group: age ≥ 50, M = 62.06, SD = 7.17), considering that the age distribution showed more younger and older participants with fewer middle-aged participants (40–55 years). Subsequently, t-tests were conducted to assess the differences in WM across the two age groups. The two groups of participants differed significantly in age (t (29) = 12.20, p < .0001), but not in gender ratio, sleep quality, or depressed mood (all p’s > .10), as shown in Table 2.
Table 2. Age group differences in demographic information and measures of interest
Note. aScores from full scales of the Patient Health Questionnaire-9 and the Pittsburgh Sleep Quality Index.
Results and Discussion
WM capacity, sleep quality, and depressed mood
Consistent with the observations in Study 1, poor sleep quality and depressed mood were also highly correlated in the community sample (based on non-overlapping items: r = .77 [.57, .88], p < .001; with overlapping items: r = .83 [.67, .92], p < .001; see Table 3). Furthermore, the number of retained WM representations (K) decreased as sleep quality decreased (i.e., increasing PSQI score; see Figure 4a) and as depressed mood scores increased (see Figure 4c). These observations were supported by significant negative correlations between K and self-reported sleep problems as indexed by PSQI scores (r = −.51 [−.73, −.19], p = .003), and between K and self-reported depressed mood as indexed by PHQ-9 scores (r = −.44 [−.69, −.10], p = .013). Correlations between capacity and depressed mood/sleep quality remained robust for the non-overlapping PSQI (r = −.50 [−.72, −.17], p = .004) and PHQ-9 (r = −.42 [−.67, −.08], p = .018) scores, as summarized in Table 3. In contrast, SD (inversely related to precision) was not significantly correlated with sleep quality or depressed mood, regardless of the full or non-overlapping versions of the scales (all p’s > .05; see Table 3). Overall, these findings from a community sample were consistent with the results in Study 1.
Table 3. Correlations of WM measurements, depressed mood, and sleep quality in Study 2

Note. Depressed mood was assessed with the Patient Health Questionnaire-9 (PHQ-9). Sleep quality was measured with the Pittsburgh Sleep Quality Index (PSQI) questionnaire.
a Scores from full scales of the PHQ-9 and the PSQI.
b Scores from the conceptually non-overlapping versions of the PHQ-9 and the PSQI.
* p < .05.
** p < .01.
Fig. 4. Dissociable effects on WM capacity and precision in Study 2. Sleep quality (score from the full scale of the PSQI) was significantly correlated with WM capacity (a), but not with precision (b). Depressed mood (score from the full scale of the PHQ-9) was significantly correlated with WM capacity (c), but not with precision (d). Age was significantly correlated with WM precision (f), but not with capacity (e). The solid lines represent the linear regression prediction. The broken lines represent 95% confidence intervals (CIs) for the linear regression prediction. Pearson correlation coefficient (r) and Spearman rank-order correlation coefficient (ρ) are presented in the figure. *p < .05, **p < .01.
Age-related precision effects
In contrast to the capacity effects of poor sleep quality and depressed mood, age had detrimental effects on WM precision. First, using an individual differences approach, age was positively correlated with the SD of memory recall errors across participants (r = .41 [.07, .67], p = .022; see Figure 4f), but not significantly correlated with K (r = −.07 [−.41, .29], p = .71; see Figure 4e). Critically, using the same one-tailed test on correlated correlations (Meng et al., Reference Meng, Rosenthal and Rubin1992), the difference in correlation between K and age and that between WM precision and age was significant (z = 1.96, p = .025; one-tailed). Second, in a complementary between-group test, older adults had substantially worse precision for retained WM representations (i.e., larger SD) as compared to younger adults (t (29) = 2.16, p = .039, Cohen’s d = 0.80). In contrast, WM capacity was comparable between the two age groups (t (29) = 0.26, p = .80, Cohen’s d = 0.09).
Motor and perceptual control tasks
Participants’ performances in the motor control task (absolute circular mean = 0.08 ± 0.11°; circular SD = 0.04 ± 0.04°) and the perceptual color matching task (absolute circular mean = 1.99 ± 1.79°; circular SD = 1.43 ± 0.59°) were highly accurate. Both the circular mean and SD were close to zero. The circular SD in the motor control tasks and the circular SD in the perceptual control tasks were both substantially smaller than the SD in the WM task (27.27 ± 5.01°), indicating that internal noise in perceptual processing and motor response had a negligible contribution to the overall SD in the WM task. More importantly, the circular SD in the motor and perceptual tasks was not significantly correlated with any measures (K, SD, depressed mood, sleep quality, and age; all p’s > .05; see Supplementary Table S3). These results suggested that the significant effects in Study 2 were unlikely to be confounded by individual differences in motor performance or perceptual discriminability in the community sample.
Conclusion
In sum, Study 2 demonstrated dissociable effects of sleep quality and age on the number and quality of WM representations, respectively, replicating the previous effects of sleep on WM quantity (e.g., Wee et al., Reference Wee, Asplund and Chee2013) and the effects of age on WM quality (e.g., Noack et al., Reference Noack, Lövdén and Lindenberger2012; Peich et al., Reference Peich, Husain and Bays2013; Pertzov et al., Reference Pertzov, Heider, Liang and Husain2015). The two effects were unlikely to be confounded by each other, given that they were opposite to each other.
GENERAL DISCUSSION
The present study demonstrated that poor sleep quality was primarily associated with reduced WM capacity, even after the effects of depressed mood were considered. Specifically, by controlling for statistical and measurement covariance between depressed mood and poor sleep quality, Study 1 showed that the two measures were independently correlated with reductions in the number, but not the precision, of remembered colors in WM in college students. Study 2 generalized the detrimental effects of poor sleep quality and depressed mood on WM capacity to a community sample and further demonstrated an opposite effect of age on WM (i.e., reduced WM precision with intact WM capacity). Overall, these results demonstrated the dissociable effects of the three health-related factors on WM representations.
The current study replicated some previously reported adverse relationships between sleep disturbance and WM capacity (Chee & Chuah, Reference Chee and Chuah2007; Wee et al., Reference Wee, Asplund and Chee2013), between depressed mood and WM capacity (Arnett et al., Reference Arnett, Higginson, Voss, Bender, Wurst and Tippin1999a, Reference Arnett, Higginson, Voss, Wright, Bender, Wurst and Tippin1999b), and between ageing and WM precision (e.g., Bermudez & Souza, Reference Bermudez and Souza2017; Noack et al., Reference Noack, Lövdén and Lindenberger2012; Peich et al., Reference Peich, Husain and Bays2013; Pertzov et al., Reference Pertzov, Heider, Liang and Husain2015; Souza, Reference Souza2016) in the same study. This is not a trivial contribution for three reasons. First, previous investigations on these relationships mostly used a piecemeal approach by looking at the relationship between one of these health-related factors and WM at a time (e.g., Peich et al., Reference Peich, Husain and Bays2013; Wee et al., Reference Wee, Asplund and Chee2013). This approach leaves open the possibility that an observed effect may be influenced by other factors. Without controlling for these confounding factors, it would be difficult to isolate the effects of health-related factors on WM. By statistically controlling the covariance of sleep quality and depressed mood, Study 1 demonstrated the independent predictive power of sleep quality and depressed mood on WM capacity. Thus, previously observed adverse effect of poor sleep quality on WM capacity (Chee & Choo, Reference Chee and Choo2004; Chee & Chuah, Reference Chee and Chuah2007; Smith et al., Reference Smith, McEvoy and Gevins2002; Wee et al., Reference Wee, Asplund and Chee2013) would be unlikely to be confounded by depressed mood associated with sleep loss. Similarly, the adverse effects of poor sleep quality on WM capacity would be unlikely to be confounded by age in Study 2, given that age has a significant association with decreases in WM precision.
Second, the impacts of the three health-related factors on WM were examined in some of the previous studies using experimental methods that, on the one hand, controlled low-level experimental confounds and, on the other hand, limited the generalizability of the findings. For example, the experimental manipulation of sleep (e.g., sleep deprivation; Wee et al., Reference Wee, Asplund and Chee2013) could induce some changes in subjects’ emotional states, even though it allowed testing of the effects of sleep on WM using within-subject design (thus minimizing the effects of individual differences). The comparisons between dichotomized clinical subject groups (e.g., depression group versus control group; Arnett et al., Reference Arnett, Higginson, Voss, Bender, Wurst and Tippin1999a) are mainly informative for understanding the differences in WM between pathological stage and the general healthy population. In contrast, the present study (also see Klein & Boals, Reference Klein and Boals2001 with a similar approach) assessed how individual differences in self-report measures of daily-life sleep quality and depressed mood in a more general population (with some subclinical symptoms, in comparison to pathological cases) were related with individual differences in WM representations. These self-report measures of sleep quality and depressed mood in a general population are critical for generalizing the previous findings from highly controlled laboratory settings to applied settings. This applied approach promotes the research on the cognitive effects of health-related factors in broader contexts (e.g., Klein & Boals, Reference Klein and Boals2001; Korten et al., Reference Korten, Sliwinski, Comijs and Smyth2014) and potentially facilitate the development of specific and sensitive neuropsychology tests to identify intermediate cognitive risk factors associated with common health-related factors, paving the way for early diagnosis and intervention (Cuijpers et al., Reference Cuijpers, Koole, van Dijke, Roca, Li and Reynolds2014).
Last, traditional measures of performance such as accuracy and response time often confound the quantitative and qualitative aspects of WM representations. This approach is problematic because the effects on these compound measures are often interpreted as the effects on WM capacity, even though these behavioral measures could reflect the effects on WM capacity, precision, or both (see Xie & Zhang, Reference Xie and Zhang2016, Reference Xie and Zhang2017a, Reference Xie and Zhang2017b; Zhang & Luck, Reference Zhang and Luck2009 , Reference Zhang and Luck2011 for some discussions). Using a novel experimental paradigm (Zhang & Luck, Reference Zhang and Luck2008), the current study obtained simultaneous assessments of quantity and quality for retained WM representations, making it possible to assess the dissociable effects of the three health-related factors on WM representations. Furthermore, the present study also provides insights into the current debate on the nature of WM storage limits. The center of this debate is whether capacity and precision are independent factors for WM storage limitation as proposed by capacity limit theories (Zhang & Luck, Reference Zhang and Luck2008), or whether precision alone is sufficient to account for WM storage limitation as proposed by precision limit theories (Bays & Husain, Reference Bays and Husain2008). While precision limit theories (e.g., Bays & Husain, Reference Bays and Husain2008) predict an omnibus reduction of WM precision under poor sleep quality, depressed mood, and age, the dissociable patterns of WM impairments in the present study provide some evidence that both capacity and precision are necessary to account for the effects of health-related factors on WM, as predicted by the capacity limit theories (Zhang & Luck, Reference Zhang and Luck2008).
Several mechanisms could potentially account for the current observations of the dissociable associations among the three health-related factors (sleep quality, depressed mood, and age) and compromised WM representations. First, increased attentional lapses due to disrupted sleep may account for reduced WM capacity (Verstraeten et al., Reference Verstraeten, Cluydts, Pevernagie and Hoffmann2004), considering the close association between attention and WM (Engle, Reference Engle2002). This can manifest as alteration of the functional network for attention/WM following disrupted sleep (Chee & Chuah, Reference Chee and Chuah2007; Chee et al., Reference Chee, Goh, Namburi, Parimal, Seidl and Kastner2011). Second, depressed mood may deplete the overall cognitive resource (Mathews & MacLeod, Reference Mathews and MacLeod1994), leading to compromised cognitive functions (Hertel & Hardin, Reference Hertel and Hardin1990; Hertel & Rude, Reference Hertel and Rude1991). Third, age is often associated with increased intra-individual variabilities (Hultsch & MacDonald, Reference Hultsch, MacDonald, Dixon, Bäckman and Nilsson2004), potentially resulting from noisier mental representations (Jagust, Reference Jagust2013; Leal & Yassa, Reference Leal and Yassa2015) and/or decreased prefrontal functions, including distractor inhibition (Fabiani et al., Reference Fabiani, Zimmerman, Gratton, Jolicoeur, Lefebvre and Martinez-Trujillo2015; Hasher & Zacks, Reference Hasher and Zacks1988; Lustig & Jantz, Reference Lustig and Jantz2015; Lustig et al., Reference Lustig, Hasher, Zacks, Gorfein and MacLeod2007). Future research needs to explore these potential neurocognitive mechanisms.
There are several cautious notes for the present study. First, it is important to note that WM is viewed here as a central cognitive resource and the decline in this resource is viewed as the cause of WM deficits (e.g., Craik & Byrd, Reference Craik, Byrd, Craik and Trehub1982). This is different from theories that describe WM deficits as the outcome of inefficient processing (Fabiani et al., Reference Fabiani, Zimmerman, Gratton, Jolicoeur, Lefebvre and Martinez-Trujillo2015; Hasher & Zacks, Reference Hasher and Zacks1988; Lustig et al., Reference Lustig, Hasher, Zacks, Gorfein and MacLeod2007; Lustig & Jantz, Reference Lustig and Jantz2015). For example, sleep loss-related WM deficits may result from inefficient processing of relevant information when distracted by irrelevant information (e.g., executive function; Rana et al., Reference Rana, Panizzon, Franz, Spoon, Jacobson, Xian, Ancoli-Israel, Lyons and Kremen2018). Further research is needed to test whether these deficits in the processing modules of WM have a relation to deficits in WM storage (e.g., Park et al., Reference Park, Lautenschlager, Hedden, Davidson, Smith and Smith2002). Second, the age effect in the present study was obtained in a cross-sectional design (e.g., Peich et al., Reference Peich, Husain and Bays2013); a longitudinal approach will be needed (e.g., Blackwell et al., Reference Blackwell, Yaffe, Laffan, Ancoli-Israel, Redline, Ensrud, Song and Stone2014; Nebes et al., Reference Nebes, Buysse, Halligan, Houck and Monk2009) to reveal how and why WM precision declines over age. Third, the current study did not find a significant association between age and the self-report measure of sleep quality, which is not necessarily at odds with the literature given the mixed findings on this relationship (Mellor et al., Reference Mellor, Waters, Olaithe, McGowan and Bucks2014; Ohayon et al., Reference Ohayon, Zulley, Guilleminault, Smirne and Priest2001, Reference Ohayon, Carskadon, Guilleminault and Vitiello2004; Unruh et al., Reference Unruh, Redline, An, Buysse, Nieto, Yeh and Newman2008). Future research is needed to evaluate how objective measures of sleep characteristics (e.g., slow-wave sleep) may interact with the effect of age on WM. Last, the current study relied exclusively on nonclinical samples with a focus on relative transient changes in mood states. Future investigation should also examine how the alterations in different aspects of WM representations are related to prolonged negative thoughts in clinically depressed individuals (Xie et al., Reference Xie, Li, Zou, Sun and Shi2018b).
CONCLUSION
The present study refines our understandings of the relationships among sleep quality, depressed mood, age, and WM (1) by specifying the effects of sleep quality, depressed mood, and age on WM capacity and precision, and (2) by looking at their individual/independent effects on memory via path analysis (for sleep quality and depressed mood). These findings add to the growing literature on the dissociable effects of health-related factors on different aspects of WM and facilitate the development of neuropsychology tests to evaluate WM deficits associated with common health-related factors.
ACKNOWLEDGMENT
This work was made possible by funding support from the National Institute of Mental Health (R01MH117132 to WZ) and the Public Health Service (R01MH086530 to CL, Co-I). AB was supported by a National Science Foundation graduate research fellowship. W. Zhang and A. Berry developed the study concept. W. Xie and A. Berry collected data and performed the data analyses. All authors contributed to the study design and manuscript preparation. The authors declare that they have no conflicts of interest with respect to their authorship or the publication of this article.
SUPPLEMENTARY MATERIAL
To view supplementary material for this article, please visit https://doi.org/10.1017/S1355617719000183