INTRODUCTION
The National Institute of Neurological Disorders and Stroke-Canadian Stroke Network (NINDS-CSN) Vascular Harmonization Standards (Hachinski et al., Reference Hachinski, Iadecola, Petersen, Breteler, Nyenhuis, Black and Leblanc2006) established a set of recommendations for more detailed study of vascular cognitive impairment (VCI). As part of the recommendations, the Neuropsychology section devised a brief telephone-based cognitive screening tool called the 5-Minute Protocol. The 5-Minute Protocol consists of 5-word recall, 6-item orientation, and 1-point phonemic fluency from the Montreal Cognitive Assessment (MOCA) (Nasreddine et al., Reference Nasreddine, Phillips, Bédirian, Charbonneau, Whitehead, Collin and Chertkow2005), yielding raw scores ranging from 0 to 12. This screening was specifically chosen to be sensitive to deficits commonly seen in VCI. The intent of the NINDS-CSN workgroup in developing the 5-Minute Protocol was twofold: to allow primary care providers to rapidly identify potential cognitive disorders requiring further work-up, and to increase feasibility of cognitive assessments in large epidemiologic studies (Hachinski et al., Reference Hachinski, Iadecola, Petersen, Breteler, Nyenhuis, Black and Leblanc2006).
Freitas, Simões, Alves, Vicente, and Santana (Reference Freitas, Simões, Alves, Vicente and Santana2012) provided initial validation of the 5-Minute Protocol in vascular dementia (VaD). Among 102 participants [34 with VaD, 34 with Alzheimer’s disease (AD), and 34 cognitively healthy adults], the 5-Minute Protocol showed excellent discrimination between VaD and cognitively healthy adults [area under the curve (AUC) of 0.936], but no significant discrimination between VaD and AD. Based on receiver operating characteristic (ROC) curve analysis, Freitas, Simões, Alves, and Santana (Reference Freitas, Simões, Alves and Santana2012) recommended a cutoff value of <8/12 on the 5-Minute Protocol to discriminate VaD from normal cognition. However, limited sample size and sample characteristics (participants were older Portuguese adults with an average of <6 years of education) makes generalization difficult.
In this study, our first goal was to report demographically adjusted norms on the 5-Minute Protocol using a population sample of community-dwelling adults aged 45 years and older in the United States. Our second goal was to examine indicators of validity for the 5-Minute Protocol in terms of its relation to other cognitive tests, well-known cardiovascular risk factors, self-reported stroke symptoms, and clinically adjudicated stroke. Given that the 5-Minute Protocol was conceived and developed as a screening measure for vascular cognitive impairment, we hypothesized that performance would be associated with well-established risk factors for cerebrovascular disease.
METHODS
Study Population
Participants were from the REGARDS cohort, a national, population-based, longitudinal study investigating the causes of excess stroke mortality among African Americans and individuals living in the Southeastern U.S. Stroke Belt region. Participants were recruited between January 2003 and October 2007 using mail and telephone contact methods (33% response rate, 49% cooperation rate; Howard et al., Reference Howard, Kleindorfer, Judd, McClure, Safford, Rhodes and Howard2011). Recruitment was stratified within race, gender, and geographic categories, with a simple random sample selected within each race-gender-region stratum. Enrollment resulted in an initial cohort of 30,239 individuals, with oversampling of residents in Stroke Belt states [56% from North Carolina (NC), South Carolina (SC), Georgia (GA), Alabama (AL), Mississippi (MS), Tennessee (TN), Arkansas (AR), and Louisiana (LA)] and African Americans (42%). Exclusion criteria included self-reported race not Caucasian or African American, self-reported medical conditions (such as cancer) that would prevent long-term participation, residing in or being on a waiting list for nursing home, or inability to participate in interviews (based on the judgment of the interviewer). Further details about REGARDS study design are provided elsewhere (Howard et al., Reference Howard, Cushman, Pulley, Gomez, Go, Prineas and Howard2005).
Assessments with the NINDS-CSN 5-Minute Protocol began in March 2009. REGARDS participants were at various stages of study follow-up, depending on their enrollment date. Of 30,239 REGARDS participants, 7696 had completed at least one NINDS-CSN 5-Minute Protocol with data collected through April 1, 2011. Of these, we excluded 1 participant due to missing education data, 374 due to self-reported stroke at baseline, and 122 due to incident stroke before first 5-Minute Protocol assessment. Thus 7199 participants remained for analysis. Compared to the 23,130 individuals excluded from the study, included participants were significantly older [excluded sample mean (SD) 64.8 (9.7) and included mean 65.0 (8.6) years, p =.002], less likely to be of African American race (43% and 35%; p <.001), less likely to have high school education or less (39% and 35%; p <.001), and less likely to reside outside the Stroke Belt (45% and 42%; p <.001).
Procedures
Demographic information [age, education (categorical), self-reported race (African American or Caucasian), and sex], medical history, and cognitive assessments were obtained by computer-assisted telephone interview at baseline. Physical measures were collected at baseline by in-home examinations, including height, weight, blood pressure, blood and urine samples, electrocardiogram (ECG), and inventory of current medications. Participants were followed by telephone at 6-month intervals to assess stroke symptoms and changes in health status. Written informed consent was obtained from all participants. Study methods were approved by Institutional Review Boards at collaborating institutions and were completed in accordance with the Helsinki Declaration.
Measures
All cognitive tests given in REGARDS were administered by telephone. Previous research has demonstrated virtually identical scores obtained in person and via telephone administration, using cognitive measures similar to those given in REGARDS (Christie et al., Reference Christie, Biester, Taichman, Shull, Hansen-Flaschen, Shea and Hopkins2006; Mitsis et al., Reference Mitsis, Jacobs, Luo, Andrews, Andrews and Sano2010; Rapp et al., Reference Rapp, Legault, Espeland, Resnick, Hogan and Coker2012; Taichman et al., Reference Taichman, Christie, Biester, Mortensen, White, Kaplan and Hopkins2005; Unverzagt et al., Reference Unverzagt, Monahan, Moser, Zhao, Carpenter, Sledge and Champion2007; Wilson et al., Reference Wilson, Leurgans, Foroud, Sweet, Graff-Radford and Mayeux2010).
NINDS-CSN 5-Minute Protocol
The 5-Minute Protocol is a global measure of cognition that is a subset of the MoCA (Nasreddine et al., Reference Nasreddine, Phillips, Bédirian, Charbonneau, Whitehead, Collin and Chertkow2005). The protocol assesses 5-word recall (5 points), 6-item temporal orientation (6 points), and phonemic fluency (1 point if >10 words that begin with the letter “F” generated in 60 s). The range of scores of the 5-Minute Protocol is 0–12, with higher scores indicating better performance. The protocol was administered in REGARDS beginning in March 2009 and given at 2-year intervals during specified follow-up phone calls. Only participants’ first assessments with the 5-Minute Protocol were used. The timing of the first assessment relative to the baseline interview depended on when the participant was enrolled and his or her availability for each scheduled call. The timeline for administration of the 5-Minute Protocol and other tests in REGARDS is shown in Figure 1. As the NINDS-CSN Neuropsychology section did not establish scoring standards for the 5-Minute Protocol, we implemented two different scoring approaches in this study. The first is most useful in clinical practice and follows the previously described standard MoCA scoring procedures and cut-points to generate raw scores. We also examined the utility of a transformed scoring method, which may be more informative in research settings. We converted the 3 scored “subtests” of the 5-Minute Protocol to Z-scores by subtracting the full sample mean score on the subtest from each participant’s raw subtest score, then dividing by the full sample standard deviation. For 5-word delayed recall and orientation, we used the 5- and 6-point sums to calculate Z-scores, respectively. For letter fluency, we used the continuous measure of the number of words generated in 60 seconds, rather than the dichotomous score approach, to calculate Z-scores. We then summed Z-scores for each of the 3 subtests to give a continuous measure of overall 5-Minute Protocol performance. We refer to this approach as “Z-scores” in the remainder of this study.

Fig. 1 Timeline for test administration in REGARDS. Timeline shows the time for administration of each test by study month in which the test was first given, and the calendar year of administration. When multiple tests were given concurrently, test names are separated by commas. Arrows at the bottom and right indicate that test administration is still ongoing in REGARDS. NINDS-CSN=NINDS-CSN 5-Minute Protocol; SIS=Six-Item Screener; WLL=Word List Learning; AFT=Animal Fluency Test.
Six-Item Screener (SIS)
The SIS (Callahan, Unverzagt, Hui, Perkins, & Hendrie, Reference Callahan, Unverzagt, Hui, Perkins and Hendrie2002) is a global measure of cognitive status assessing three-item recall and orientation to year, month, and day of the week. Administration in REGARDS began December 2003 and annually thereafter on a different follow-up call schedule than the 5-Minute Protocol (Figure 1). SIS scores range from 0–6 with scores of 4 or fewer correct indicative of cognitive impairment based on clinical diagnoses of dementia and mild cognitive impairment in community dwelling samples (Callahan et al., Reference Callahan, Unverzagt, Hui, Perkins and Hendrie2002). Previous studies in REGARDS have used the SIS as a longitudinal measure of cognitive impairment, showing increased risk of incident cognitive impairment with higher diastolic blood pressure (Tsivgoulis et al., Reference Tsivgoulis, Alexandrov, Wadley, Unverzagt, Go, Moy and Howard2009), residence in the Stroke Belt (Wadley et al., Reference Wadley, Unverzagt, McGuire, Moy, Go, Kissela and Howard2011), more vascular risk factors (Unverzagt et al., Reference Unverzagt, McClure, Wadley, Jenny, Go, Cushman and Howard2011), and self-report of stroke symptoms (Kelley et al., Reference Kelley, McClure, Letter, Wadley, Unverzagt, Kissela and Howard2013), but decreased risk with adherence to a Mediterranean diet (Tsivgoulis et al., Reference Tsivgoulis, Judd, Letter, Alexandrov, Howard, Nahab and Wadley2013).
Word List Learning (WLL)
This is a 10-word, 3-trial word list learning task drawn from the Consortium to Establish a Registry for Alzheimer’s Disease (CERAD) battery (Morris et al., Reference Morris, Heyman, Mohs, Hughes, van Belle, Fillenbaum and Clark1989). Scores include total number of words recalled across the three learning trials (WLL Sum Learning, maximum score=30) and delayed free recall (WLL Delayed Recall, maximum=10). Due to our telephone administration method, the REGARDS study routinely censors the data of participants with aberrant performance patterns that may occur despite explicit instructions not to write down the word lists. Specifically, the score of any participant who responded to a learning trial with all 10 words, in the exact order presented on that trial or a prior trial, is censored. In addition, the score of any participant whose score on the Delayed Recall trial is 3 or more points higher than their score on any learning trial is censored. Fewer than 2% of REGARDS participants’ data have met criteria for censorship. For the present analyses, we used participants’ WLL Sum Learning and WLL Delayed Recall scores obtained concurrently with the first 5-Minute Protocol.
Animal Fluency Test (AFT)
This is a commonly used verbal fluency task that was administered according to standardized scripts (Strauss, Sherman, & Spreen, Reference Strauss, Sherman and Spreen2006), which asked participants to name as many animals as possible in 1 min. We used AFT scores obtained concurrently with each participant’s first 5-Minute Protocol.
Framingham Stroke Risk Profile (FSRP)
The FSRP (D’Agostino, Wolf, Belanger, & Kannel, Reference D’Agostino, Wolf, Belanger and Kannel1994; Wolf, D’Agostino, Belanger, & Kannel, Reference Wolf, D’Agostino, Belanger and Kannel1991) is a previously validated measure of vascular burden that estimates 10-year probability of stroke. Scores range from 0–100, with higher scores indicating greater risk. The FSRP incorporates age, measured systolic blood pressure (SBP), presence of diabetes mellitus (DM), current cigarette smoking, history of cardiovascular disease (CVD), atrial fibrillation (AF), left ventricular hypertrophy (LVH), and use of antihypertensive medication (HRX). For REGARDS, DM was defined as fasting glucose ≥126 mL/dL, non-fasting glucose ≥200 mL/dL, or self-reported use of diabetes medications. Current cigarette smoking and current HRX were determined by interview at baseline. CVD was determined by self-reported myocardial infarction (MI), coronary artery bypass graft, angioplasty or stenting, or evidence of MI from baseline ECG. AF was defined by self-report or ECG evidence. LVH was defined by presence on ECG (12 lead or 7 lead) (Soliman, Howard, Prineas, McClure, & Howard, Reference Soliman, Howard, Prineas, McClure and Howard2010). We calculated gender-specific FSRP scores using the Cox regression equations from D’Agostino et al. (Reference D’Agostino, Wolf, Belanger and Kannel1994). Consistent with other studies, we log-transformed the FSRP score to normalize the distribution (Elias et al., Reference Elias, Sullivan, D’agostino, Elias, Beiser, Au and Wolf2004). In addition to the overall measure of cerebrovascular risk using the FSRP, we examined effects of each of the FSRP components in separate analyses. We have previously described the calculation of the FSRP in REGARDS (Unverzagt et al., Reference Unverzagt, McClure, Wadley, Jenny, Go, Cushman and Howard2011) and showed the association of FSRP and its components with incident cognitive impairment on the SIS.
Questionnaire for Verifying Stroke-free Status (QVSS)
The QVSS is an eight-item questionnaire designed to identify symptomatic cerebrovascular disease (Meschia et al., Reference Meschia, Brott, Chukwudelunzu, Hardy, Brown, Meissner and O’Brien2000). It has high sensitivity (0.97) and moderate specificity (0.60) for detecting clinically confirmed stroke (Jones, Williams, & Meschia, Reference Jones, Williams and Meschia2001; Meschia et al., Reference Meschia, Lojacono, Miller, Brott, Atkinson and O’Brien2004). The first two items assess incident stroke and transient ischemic attack; the remaining six items assess experience of stroke symptoms (e.g., sudden one-sided weakness, sudden difficulty with speech). Scores ≥1 on these six items are considered positive for stroke symptoms (Meschia et al., Reference Meschia, Brott, Chukwudelunzu, Hardy, Brown, Meissner and O’Brien2000). For the present analyses, we used the QVSS score obtained concurrently with each participant’s 5-Minute Protocol.
Incident stroke
We assessed participants by telephone to determine whether they had been hospitalized for a stroke event or symptoms between baseline and the first administration of the 5-Minute Protocol. If so, we retrieved their medical records, which were then reviewed and adjudicated by a panel of clinical stroke experts (Howard et al., Reference Howard, Kleindorfer, Judd, McClure, Safford, Rhodes and Howard2011).
Center for Epidemiologic Studies – Depression scale, 4-item version (CES-D-4)
The CES-D-4 is a self-report measure of depressive symptoms (Melchior, Huba, Brown, & Reback, Reference Melchior, Huba, Brown and Reback1993; Radloff, Reference Radloff1977). Scores range from 0–12, with higher scores indicating more depressive symptoms. The CES-D-4 retains reliability and validity similar to the original 20-item instrument (Melchior et al., Reference Melchior, Huba, Brown and Reback1993), a standard survey measure of depressive symptoms in older adults (Shafer, Reference Shafer2006). A cutoff score ≥4 on baseline assessment was defined as elevated depressive symptoms (Melchior et al, Reference Melchior, Huba, Brown and Reback1993).
Statistical Analyses
We conducted all analyses using the R statistical software, version 2.15.1 (R Core Development Team, Vienna, Austria). We conducted initial analyses using raw scores on the 5-Minute Protocol. Due to the positively skewed distribution of 5-Minute Protocol scores (Supplemental Figure 1), we used nonparametric tests to examine the relationship between raw scores and demographic variables of age and education. We calculated summary data consisting of weighted means, standard deviations, and percentile points using the Hmisc package in R.
We used only participants’ first administrations of the 5-Minute Protocol in analyses to avoid any biases arising from unequal numbers of assessments. We used unweighted analyses of the study sample to examine the relationship of the 5-Minute Protocol with depressive symptoms, vascular risk factors, and other measures of cognition. To obtain estimates of performance representative of the U.S. population, we assigned weights (Prineas et al., Reference Prineas, Le, Soliman, Zhang, Howard and Ostchega2012) to scores for all participants with complete 5-Minute Protocol data in the REGARDS sample. Weights were inversely proportional to the participant’s state population density. This adjustment accounts for the fact that participants from less populated regions represent a larger number of individuals than participants from more populated regions (Ciol et al., Reference Ciol, Hoffman, Dudgeon, Shumway-Cook, Yorkston and Chan2006). Weights were stratified by race, gender, and geographic region to account for the sampling scheme described in Study Population. Weighted scores represent a national standard of age- and education-matched peers by which to judge a given individual’s performance. National data for weighting were obtained from the National Center for Health Statistics bridged-race population estimates of July 1st, 2005, available from the Centers for Disease Control (CDC) website (http://wonder.cdc.gov/Bridged-Race-v2005.HTML).
For all cognitive measures except the SIS, we used scores obtained concurrently with first administration of the 5-Minute Protocol for calculating correlations. Because the SIS was given on a different schedule than the other measures, we used the SIS score closest temporally to the first 5-Minute Protocol administration. If the interval was greater than 12 months, observations for that individual were not used in calculations (N=281). We first used nonparametric tests to examine correlations between 5-Minute Protocol scores and other cognitive measures (SIS, WLL, and AFT). We also dichotomized the SIS as impaired/not impaired using the standard cutoff of 4 to examine performance of 5-Minute Protocol scores in classifying impairment on the SIS using ROC curves. We then compared performance of 5-Minute Protocol and SIS scores in classifying cognitive impairment on other measures. For this analysis, we defined cognitive impairment by dichotomizing the WLL Sum Learning, WLL Delayed Recall, and AFT as impaired/not impaired using a cutoff at the 7th percentile (or 1.5 standard deviations (SDs) below the sample mean), corresponding to scores of 9, 3, and 9, respectively. We compared the AUC for the 5-Minute Protocol and SIS using DeLong’s test (DeLong, DeLong, & Clarke-Pearson, Reference DeLong, DeLong and Clarke-Pearson1988). We used only individuals with complete data on all cognitive measures in our comparisons of the 5-Minute Protocol to other tests (N=6918), so the number of participants was the same across comparisons.
We used nonparametric tests to examine the relationship between 5-Minute Protocol scores and overall measures of cerebrovascular risk (FSRP and QVSS stroke symptoms). We built a series of ordinal regression models to examine the association of independent variables and the odds of lower raw scores on the 5-Minute Protocol. We first examined unadjusted relationships between the 5-Minute Protocol score and demographic characteristics, CES-D-4 scores, and FSRP total score. We also examined univariate relationships between each of the components of the FSRP and the 5-Minute Protocol score. Next, we constructed models with CES-D-4 scores, with FSRP scores, and with each of the components of the FSRP as independent variables, adjusting for demographics of sex, race, region, and education. (Age was not included in adjustment as it is one of the components of the FSRP.) Then we constructed a full model with CES-D-4 scores and each of the components of the FSRP as the independent variables, adjusting for demographics and other variables in the model (corresponding to Type III sums of squares). We compared each of these 3 models using the Nagelkerke R 2 index (Nagelkerke, Reference Nagelkerke1991) and Akaike Information Criterion (AIC) (Akaike, Reference Akaike1974) to determine the best-fitting model. Finally, we added terms for interaction of CES-D-4 depression scores with each of the components of the FSRP to determine whether the effects of vascular risk factors were modified by depressive symptoms. We computed odds ratios and 95% confidence intervals for all parameters. In addition, we constructed ordinal regression models to compare 5-Minute Protocol scores in the study sample to the 122 subjects with incident stroke who were excluded from population-level summaries.
We repeated all analyses using 5-Minute Protocol Z-scores as the outcome measure. As Z-scores were much less skewed (Supplemental Figure 1) than raw scores, we used parametric tests to examine correlation between the 5-Minute Protocol Z-scores and other cognitive measures. We used ordinary linear regression to examine the association of 5-Minute Protocol Z-scores with demographics, depressive symptoms, and vascular risk factors.
RESULTS
Table 1 presents baseline characteristics of the sample. Average age at baseline was 65 (SD=8.6) years and average time between baseline and first administration of the 5-Minute Protocol was 4.77 (SD=0.98; range, 3.510–5.837) years. Educational level for the sample was 52% high school graduate and 38% college graduate. Most participants scored well on the NINDS-CSN 5-Minute Protocol raw score, with an average total score of 10.2 (SD=1.7). Mean FSRP score was 9.43 (SD=9.37), indicating 9.43% probability of stroke over 10 years. Fifty-one percent of the sample used antihypertensive medications. Prevalence of other individual FSRP risk factors was generally low, ranging from 8% to 19% of participants.
Table 1 Baseline demographics of subjects and performance on first 5-Minute Protocol administration (N=7,199)

Notes. Assessment interval is time between baseline and first administration of the 5-Minute Protocol. Stroke Belt=resident of NC, SC, GA, TN, MS, AL, LA, AR; Stroke Buckle=resident of coastal plains of NC, SC, GA; HS=high school; SIS=Six-Item Screener; CES-D=4-item Center for Epidemiologic Studies - Depression scale.
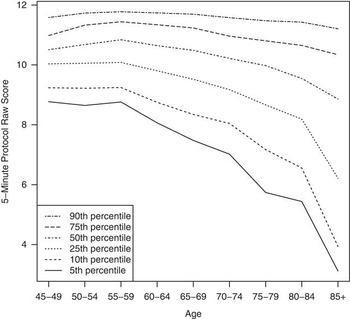
The 5-Minute Protocol raw scores were significantly negatively correlated with age (Kendall’s τc=-0.229; 95% CI -0.244, -0.215; p <.001) and positively correlated with education (Kruskal-Wallis χ2=484.905; df=3; p <.001). Figures 2 and 3 show distributions for the 5-Minute Protocol by age and education levels, weighted for the U.S. population based on the 2000 census. The 5-Minute Protocol scores consistently decreased across successive age categories, together with increasing variability in performance at older ages. The 5-Minute Protocol scores also consistently increased with greater educational level, but variability in performance did not appear to differ as a function of education. Means, SDs, and selected percentiles for raw scores, weighted for the U.S. population, are shown in Supplemental Table 1. Similar results were obtained using the 5-Minute Protocol Z-scores (Supplemental Figures 1 and 2 and Supplemental Table 2).

Fig. 2 NINDS-CSN 5-Minute Protocol raw scores by age and selected percentiles. Data are weighted based on the 2000 U.S. population census by age, sex, race, and geographic region.

Fig. 3 NINDS-CSN 5-Minute Protocol raw scores by educational level and selected percentiles. Data are weighted based on the 2000 U.S. population census by age, sex, race, and geographic region.
Table 2 Parameter estimates and standard error estimates from ordinal regression models of NINDS-CSN 5-Minute Protocol raw scores on demographics, depressive symptoms, and FSRP scores and components (N=6,430)

Note. Stroke Belt=resident of NC, SC, GA, TN, MS, AL, LA, AR; Stroke Buckle=resident of coastal plains of NC, SC, GA; HS=high school; CES-D=four-item Center for Epidemiologic Studies - Depression scale.
*X (independent variable) standardization only.
**Or the root mean square of errors (RMSE), using ordinary (or Li-Shepherd) residuals (Li & Shepherd, Reference Li and Shepherd2012).
***Reference level.
Cronbach’s alpha for the 5-Minute Protocol raw score was 0.617 (95% CI 0.600, 0.635), indicating acceptable internal reliability in this sample. The 3 subtests showed fair to good correlation with overall score (Kendall’s τc=0.797, 0.402, and 0.462 for Memory, Orientation, and Fluency).
Raw scores on the 5-Minute Protocol showed moderate and significant correlations with the SIS (Kendall’s τc=0.251; 95% CI 0.239, 0.264; p <.001), WLL Sum Learning (Kendall’s τc=0.387; 95% CI 0.373, 0.401; p <.001), WLL Delayed Recall (Kendall’s τc=0.393; 95% CI 0.379, 0.407; p <.001), and AFT (Kendall’s τc=0.305; 95% CI 0.273, 0.338; p <.001). ROC curves showing the performance of the 5-Minute Protocol raw scores in classifying impairment using the other cognitive measures are shown in Figure 4. Scores on the 5-Minute Protocol were closely related to impairment on the SIS, with AUC of 0.822. The 5-Minute Protocol also performed well in classifying impairment on WLL Sum Learning, with AUC of 0.809. This was significantly better than the AUC of 0.720 for the SIS in classifying impairment on the WLL Sum Recall (DeLong’s D=4.331; df=10956.86; p <.001), illustrating the value of the additional items on the 5-Minute Protocol. The 5-Minute Protocol also was significantly better than the SIS in classifying impairment on the WLL Delayed Recall (AUC=0.831 and 0.725, respectively, D=4.404; df=10474.55; p <.001) and the AFT (AUC=0.787 and 0.669, respectively; D=3.111; df=2548.305; p <.001). Similar results were obtained using the 5-Minute Protocol Z-scores (data not shown).

Fig. 4 NINDS-CSN 5-Minute Protocol raw scores by impairment on neuropsychological tests. The 5-Minute Protocol performed well in classifying impairment on the SIS (a). It also outperformed the SIS in classifying impairment on the WLL Sum Learning (b), WLL Delayed Recall (c), and AFT (d). For the SIS, a score of 4 or less was classified as impaired; for the WLL Sum Learning, WLL Delayed Recall, and AFT, a score below the 7th percentile (1.5 SD below the mean) was classified as impaired. SIS=Six-Item Screener; WLL=Word List Learning; AFT=Animal Fluency Test.
The 5-Minute Protocol raw scores were moderately and significantly correlated with total FSRP scores (Kendall’s τc=-0.236; 95% CI -0.251, -0.222; p <.001). Scores on the 5-Minute Protocol were significantly worse for individuals with self-reported stroke symptoms on the QVSS than those without (Wilcoxon’s W=4475970; p <.001) and for individuals with versus without adjudicated stroke (Wilcoxon’s W=542723.5; p <.001). Figure 5 provides a graphical depiction of the relationship between the 5-Minute Protocol and vascular risk assessed by the FSRP, QVSS, and adjudicated stroke. Table 2 presents parameter estimates from the fitted ordinal regression models, with odds ratios that correspond to these parameter estimates shown in Supplemental Table 3. For each standard deviation increase in the FSRP, odds of an individual having lower 5-Minute Protocol scores increased by 92% (95% CI 1.82–2.18) after adjustment for demographic factors. In unadjusted models, all FSRP factors except current smoking were related to lower 5-Minute Protocol scores. After multivariable adjustment, FSRP factors of older age, higher systolic blood pressure, current antihypertensive medication use, and history of heart disease remained significantly related to lower 5-Minute Protocol scores. Depressive symptoms also were significantly and negatively associated with 5-Minute Protocol scores after multivariable adjustment. Both the Nagelkerke R 2 index and AIC showed better fit for the fully adjusted model compared to the unadjusted and demographically adjusted models.

Fig. 5 NINDS-CSN 5-Minute Protocol raw scores by vascular risk. Boxplots show the median raw score, interquartile range, and 95% CI of the median. The 5-Minute Protocol scores were lower in the upper quartiles of FSRP scores, which indicate higher 10-year probability of stroke (a). The 5-Minute Protocol scores were also lower with the presence of stroke-like symptoms (b) and with adjudicated diagnosis of stroke (c). FSRP=Framingham Stroke Risk Profile; QVSS=Questionnaire for Verifying Stroke-free Status.
Similar results were obtained for linear regression models using the 5-Minute Protocol Z-scores as the outcome (Supplemental Table 4). None of the interactions between depressive symptoms and vascular risk factors had a statistically significant association with 5-Minute Protocol performance.
For the ordinal regression model, the log odds ratio can be computed by multiplying the coefficients in Table 2 by the corresponding covariate values. A predicted mean raw score on the 5-Minute Protocol can be found using the method described by Hannah and Quigley (Reference Hannah and Quigley1996), multiplying the range of possible scores (2–12 in our sample) by their probabilities and summing the result. Alternatively, we can use the empirical distribution of our sample (Supplemental Table 1) to determine a subject’s expected raw score. Similarly, based on Supplemental Table 5, the predicted 5-Minute Protocol Z-score can be computed with the linear regression model (using only demographics as covariates) as
 $$\eqalignno{ {\rm NINDS{\hbox-}CSN}_{{{\rm z{\hbox-}score}}} =\,& 1.700{\minus}0.224{\times}{\rm African}\,{\rm American}\cr &{\plus}{\rm 0}{\rm .369}{\times}{\rm HS}\,{\rm graduate} {\rm {\plus}0}{\rm .539}\cr &{\times}{\rm Some}\,{\rm college}{\plus}{\rm 0}{\rm .782}\cr &{\times}{\rm College}\,{\rm graduate}{\minus}{\rm 0}{\rm .255}{\times}{\rm Male} \cr & {\rm {\minus}0}{\rm .026}{\times}{\rm Stroke}\,{\rm buckle}{\plus}{\rm 0}{\rm .128}\cr &{\times}{\rm Nonbelt} {\minus}0{\rm .029}{\times}{\rm Age} $$
We have provided a sample Excel spreadsheet and source code in R for performing predicted score calculations in the Online Supplement. All formulas are readily extended to include depressive symptoms and the FSRP (or its components) in the prediction.
As an example, consider a 70-year-old Caucasian female in the Stroke Belt with a high school education, who has an observed score of 10/12 on the 5-Minute Protocol. Her “subtest” scores are 4/5 for memory, 6/6 for orientation, and 0 for 9 words generated for the letter F. We will also assume she has diabetes, SBP of 125 mmHg, and a CES-D-4 score of 1. Using Supplemental Table 1, we see that her raw score of 10 is at the median for her age and education level and close to her peer group mean of 10.18, well within 1.5 SD of the mean. For the Z-score, substituting the covariate values into the above formula gives a predicted value of 0.039. Using the SD of the residuals from Supplemental Table 5, we assume the predicted score follows a normal distribution with SD 0.860. Her score is 0.018 SD below the mean, placing her in the 49th percentile—a solidly average score.
Additional detail for the predicted scores can be obtained by including information on medical conditions and depressive symptoms. In this example, the additional covariates are CES-D-4=1, SBP=125, Heart disease=0, AF=0, Antihypertensive medications=0, Diabetes=1, LVH=0, and Smoker=0. Using the coefficients in Supplemental Table 5, her predicted Z-score is -0.052. With the SD of the residuals equal to 0.855, her score is 0.088 SD above the mean, or at the 53rd percentile—again, solidly average.
DISCUSSION
In this study, we demonstrate that the NINDS-CSN 5-Minute Protocol shows strong relationships to a very wide variety of markers with relevance to vascular cognitive impairment including: cardiovascular health history, measured blood pressure, hypertension, panel-adjudicated clinical stroke, self-reported stroke symptoms, and widely used clinical neuropsychological tests. All components of the FSRP were significantly associated with the NINDS-CSN 5-Minute Protocol individually and age, systolic blood pressure, current antihypertensive medication use, and heart disease remained significant after multivariable adjustment. Similar relationships between vascular risk factors and incident cognitive impairment (as measured by the SIS) have been reported in the same cohort (Unverzagt et al., Reference Unverzagt, McClure, Wadley, Jenny, Go, Cushman and Howard2011). Our work extends the results of previous studies, which focused on VaD (Freitas, Simões, Alves, Vicente, & Santana, Reference Freitas, Simões, Alves and Santana2012), across a spectrum of vascular risk: individuals without stroke having varying levels of risk for future stroke (FSRP), individuals without stroke but reporting a history of stroke symptoms indicative of high stroke risk (QVSS) (Kleindorfer et al., Reference Kleindorfer, Judd, Howard, McClure, Safford, Cushman and Howard2011), and individuals with verified diagnosis of stroke. These findings provide empirical evidence supporting the recommendation of the NINDS-CSN 5-Minute Protocol in screening for VCI (Hachinski et al., Reference Hachinski, Iadecola, Petersen, Breteler, Nyenhuis, Black and Leblanc2006). As VaD represents the second most common form of dementia, early screening for VCI is likely to benefit a substantial number of individuals, especially because early treatment of vascular risk factors may slow progression of impairment (Gorelick et al., Reference Gorelick, Scuteri, Black, Decarli, Greenberg and Iadecola2011). The 5-Minute Protocol appears to be a better alternative than other very brief screeners such as the SIS for rapid assessment of this population in the clinical practice setting.
This study also extends previous results on convergent validity of the NINDS-CSN 5-Minute Protocol by comparing performance on it to the SIS and to three well-established neuropsychological measures. Correlation of the 5-Minute Protocol and the SIS is expected given the overlap in the item content. However, the 5-Minute Protocol also shows significant correlation with the WLL Sum Recall, WLL Delayed Recall, and AFT. The WLL is primarily a test of verbal memory (Morris et al., Reference Morris, Heyman, Mohs, Hughes, van Belle, Fillenbaum and Clark1989), although other domains such as executive function can also influence performance (Hasimoto et al., Reference Hasimoto, Meguro, Yamaguchi, Ishizaki, Ishii, Meguro and Sekita2004). The AFT is primarily a test of semantic fluency that is often included in executive function batteries (Mitrushina, Boon, & D’Elia, Reference Mitrushina, Boon and D’Elia1999). Taken together, the relationship of the 5-Minute Protocol with each of these tests indicates good performance as a broad general measure of cognition. However, comparison to comprehensive measures of executive function is still needed to determine whether the 5-Minute Protocol measures this construct. Such comparisons are particularly important as executive dysfunction is a hallmark of VCI (Hachinski et al., Reference Hachinski, Iadecola, Petersen, Breteler, Nyenhuis, Black and Leblanc2006). Inadequate assessment of executive function might limit the 5-Minute Protocol in atypical presentations or in cases of early or mild executive dysfunction.
Scores on the 5-Minute Protocol were also negatively associated with depressive symptoms, as measured by the CES-D-4. These findings are similar to the results of Freitas, Simões, Alves, and Santana (Reference Freitas, Simões, Alves and Santana2012); however, we go further in showing that depressive symptoms did not modify the effect of vascular risk factors on the 5-Minute Protocol scores.
Our project has notable strengths, including sample size, geographic diversity, and excellent characterization of vascular risk factors. However, several limitations must be acknowledged. First, accuracy of the 5-Minute Protocol compared to clinical diagnoses of dementia or VCI could not be determined, although a previous study has evaluated this issue (Freitas, Simões, Alves, Vicente, & Santana, Reference Freitas, Simões, Alves and Santana2012). Instead, we used cut scores of 1.5 SD below the whole sample mean as a surrogate for clinical diagnoses, a well-known and validated procedure in clinical neuropsychology (Ivnik et al., Reference Ivnik, Smith, Petersen, Boeve, Kokmen and Tangalos2000). Also, while the FSRP and QVSS serve primarily as measures of vascular risk, they do not directly assess vascular pathology. Further studies incorporating brain imaging will be needed to more fully characterize the relationship between the 5-Minute Protocol and cerebrovascular disease. Second, telephone administration may limit detection of nonstandard behavior among participants, such as writing down word lists. We developed procedures for flagging performance patterns that are statistically and conceptually unlikely to occur by chance, and participants with aberrant scores were censored before assembling our analytic sample. Third, we only conducted cross-sectional analyses with the first administration of the NINDS-CSN 5-Minute Protocol in the REGARDS cohort. Future work will examine the sensitivity of the battery to changes in cognitive function over time. Fourth, although the REGARDS cohort is a population-based sample, only Caucasians and African Americans were included by design. It is unclear whether population-level summaries provided here would apply to other racial and ethnic groups. Finally, a comprehensive neuropsychological battery including more detailed measures of domains such as executive function and speed of processing was not available due to feasibility issues in REGARDS.
In summary, this study provides the first large-scale validation of the NINDS-CSN 5-Minute Protocol as a general measure of cognition and one that is sensitive to vascular risk factors, stroke symptoms and adjudicated stroke. This study helps to establish the validity of the 5-Minute Protocol for detecting VCI in U.S. adults. In addition, this study provides useful population-based age- and education-adjusted norms to facilitate clinical screening of cognitive status that would indicate the need for further neuropsychological evaluation.
ACKNOWLEDGMENTS
The REGARDS research project is supported by National Institute of Neurological Disorders and Stroke cooperative agreement U01 NS041588 (G. Howard, PI). The content is solely the responsibility of the authors and does not necessarily represent official views of the National Institute of Neurological Disorders and Stroke or the National Institutes of Health. Representatives of the funding agency were not involved in collection, management, analysis or interpretation of the data. R.K. received additional funding from grant T32 HL072757 from the National Heart, Lung, and Blood Institute (D. Allison, PI). The authors thank the investigators, staff, and participants of the REGARDS study for their valuable contributions. A full list of participating REGARDS investigators and institutions can be found at http://www.regardsstudy.org. None of the study authors report any conflict of interest regarding content of the research.