INTRODUCTION
Motor strength and dexterity are necessary for independent living and academic development, and deficits in motor performance are sensitive to various neuropsychological and psychological pathologies. Motor speed deficits are found in various populations (Christainson & Leathem, Reference Christianson and Leathem2004) especially in pediatric populations as early motor deficits often precede later emerging higher order deficits (Anderson, Northam, & Wrennall, Reference Anderson, Northam and Wrennall2019; Koziol, Reference Koziol2014). Assessments of motor strength and dexterity are popular measures used by neuropsychologists (Camara, Nathan, & Puente, Reference Camara, Nathan and Puente2000). For example, Finger-Tapping Test (FTT), Grooved Pegboard Test (GPT), and Grip Strength Test (GST) are in the list of top 20 measures used by neuropsychologists in a rank order of the most commonly used assessments. In a more recent study, these three measures were the most frequently used sensory/motor function assessment tools by neuropsychologists (Rabin, Paolillo, & Barr, Reference Rabin, Paolillo and Barr2016). Further, GPT and FTT are included in the World Health Organization’s neuropsychological battery of measures appropriate for use across cultural contexts (Maj et al., Reference Maj, Janssen, Satz, Zaudig, Starace, Boor and Sartorius1991).
Current Norms
Despite their popularity, there is a paucity of norms for motor tasks for children due in part to the lack of funding available to conduct large-scale normative studies (Casaletto & Heaton, Reference Casaletto and Heaton2017). Although a lack of norms is one of the current challenges with many neuropsychological measures, the lack of recent norms for motor measures and the lack of co-norms (Russel, Russell, & Hill, Reference Russell, Russell and Hill2005) for these three measures is concerning given their frequent co-administration by clinicians (Baron, Reference Baron2018; Russell et al., Reference Russell, Russell and Hill2005). It is important to note that some researchers have suggested that using overall test battery means (OTBM) makes co-norming unnecessary (Rohling et al., Reference Rohling, Miller, Axelrod, Wall, Lee and Kinikini2015); at the same time, there continues to be a research to practice gap, and we were unable to find any studies measuring how effectively clinicians actually implement OTBMs, so it is unclear whether clinicians are actually using this strategy (Rabin et al, Reference Rabin, Paolillo and Barr2016). Consequently, until there are changes in training and practice regarding assessments with differing normative samples, it appears to be important to address co-norming to increase the dependable comparison of performance across measures (Larabee, Reference Larabee, Morgan and Ricker2018; Russel et al., Reference Russell, Russell and Hill2005). The current available norms are limited in their comprehensiveness, demographic breakdown, and co-norming. To address this gap in the literature, this study aimed to provide updated co-norms for FTT, GST, and GPT.
There are few studies examining FTT and GPT performance in children, especially in typically developing children or children from community samples. The most recent norms reported for the FTT, GST, and GPT were reported by Baron (Reference Baron2018) on findings from presentations (Mandernach, Gfeller, & Cobia, Reference Mandernach, Gfeller and Cobia2004). While Mandernach et al. (Reference Mandernach, Gfeller and Cobia2004) co-normed these tools, these data are currently 16 years old, include only 15–18 year olds, and provided data by gender but not by age. A more recent study in Norway collected data for both GPT and finger tapping but used an app to measure finger tapping (Skogan, Oerbeck, Christiansen, Lande, & Egeland, Reference Skogan, Oerbeck, Christiansen, Lande and Egeland2018). Additionally, the variable instruments, directions, and procedures across studies make it difficult to compare results of norming studies with differing instruments and procedures (Baron, Reference Baron2018). Studies vary on the number of motor tasks examined and which motor tasks are used (Denckla, Reference Denckla1974; Fredriksen et al., Reference Fredriksen, Mamen, Hjelle and Lindberg2018; Gray et al., Reference Gray, Marshall, Livingston and Haak2000; Hogrel, Reference Hogrel2015; Knights & Moule, Reference Knights and Moule1967; Ploegmakers, Hepping, Geertzen, Blustra, & Stevens, Reference Ploegmakers, Hepping, Geertzen, Blustra and Stevens2013), again making it difficult to compare the results across studies.
There are more studies examining pediatric grip strength. Hogrel (Reference Hogrel2015) provided norms for pediatric grip strength for the GST, but ages 5–10 and 10–15 are collapsed, so they cannot be used as norms for specific ages, and the number of participants in this collapsed age range are small (9–15 participants). Another study broke norms down by age (5–8), but these norms are 20 years old (Gray, Marshall, Livingston, & Haak, Reference Gray, Marshall, Livingston and Haak2000). Although there are some recent studies for pediatric GST with larger numbers of participants (Bohannon, Wang, Bubela, & Gershon, Reference Bohannon, Wang, Bubela and Gershon2017; Fredriksen, Mamen, Hjelle, & Lindberg, Reference Fredriksen, Mamen, Hjelle and Lindberg2018; McQuiddy, Scheerer, Lavalley, McGrath, & Lin, Reference McQuiddy, Scheerer, Lavalley, McGrath and Lin2015; Ploegmakers, Hepping, Geertzen, Blustra, & Stevens, Reference Ploegmakers, Hepping, Geertzen, Blustra and Stevens2013; Omar, Alghadir, Zafar, & Al Baker, Reference Omar, Alghadir, Zafar and Al Baker2018), it is important to co-norm measures to aid in interpreting performance across measures (Russell et al., Reference Russell, Russell and Hill2005).
Change in patterns of pediatric performance over the past decades emphasizes the importance of updated norms. While most studies highlighted here involved multiple measures in addition to grip strength, evidence suggests that in England grip strength decreased by 6.8% over a decade (10 year olds; Cohen et al., Reference Cohen, Voss, Taylor, Delextrat, Ogunleye and Sandercock2011); in Spain adolescent grip strength decreased 4.5 kg over approximately five years (Moliner-Urdiales et al., Reference Moliner-Urdiales, Ruiz, Ortega, Jiménez-Pavón, Vicente-Rodgiguez, Rey-López and Moreno2010); and in Canada, over 28 years, boys’ and girls’ grip strength decreased by 5 kg and 3 kg respectively (Tremblay et al., Reference Tremblay, Shields, Laviolette, Craig, Janssen and Gorber2010). Authors suggest that these decreases may be due to increased use of technology and changes in modern lifestyles as well as a variety of social behavioral, and physical factors (Moliner-Urdiales et al., Reference Moliner-Urdiales, Ruiz, Ortega, Jiménez-Pavón, Vicente-Rodgiguez, Rey-López and Moreno2010; Tremblay et al., Reference Tremblay, Shields, Laviolette, Craig, Janssen and Gorber2010). Changes in grip strength over time highlights the importance of maintaining updated norms for motor tasks in order to have representative comparison groups for clinical use. However, performance on FTT and GPT has demonstrated no linear changes in performance over time (Dickinson & Hisock, Reference Dickinson and Hisock2011) suggesting differential impacts on grip strength and dexterity.
Additionally, studies of performance on motor tasks often do not report race (e.g., Butterfield et al., Reference Butterfield, Butterfield, Lehnard, Loovis, Coladarci and Saucier2009; Emerson, Harrison, Everhard, & Williamson, Reference Emerson, Harrison, Everhard and Williamson2001; Fredriksen et al., Reference Fredriksen, Mamen, Hjelle and Lindberg2018; Häger-Ross & Rösbland, Reference Häger-Ross and Rösbland2002; Hogrel, Reference Hogrel2015; Omar et al., Reference Omar, Alghadir, Zafar and Al Baker2018; Ploegmakers et al., Reference Ploegmakers, Hepping, Geertzen, Blustra and Stevens2013; Skogan et al., Reference Skogan, Oerbeck, Christiansen, Lande and Egeland2018). Those that did report race had limited racial diversity with majority of participants reported being Caucasian: 93.8% (Gray, Marshall, Livingston, & Haak, Reference Gray, Marshall, Livingston and Haak2000) and 85.7% (Eng, Fazio, Biddle, O’Grady, & Denney, Reference Eng, Fazio, Biddle, O’Grady and Denney2013).
Current Study
While it is recommended that measures are co-normed, these three motor assessments, which are often administered together, have not been normed together (Baron, Reference Baron2018; Russell et al., 2015). Currently, we have identified no studies that have co-normed these three commonly co-administered motor tasks. To our knowledge, this is the first study providing co-normed data for these three motor tests. Consequently, the goal of the current study was to provide co-normed, reference values for FTT, GST, and GPT.
METHOD
Participants
Participants (n = 476, included 271 males and 205 females; age range 6–14) were recruited from several community settings including youth sporting events, summer camps, charter schools (large immigrant population) and private schools (specializing in learning disabilities, gifted students, and schools with no specific specialization), and university postings of research opportunities from an urban center in Western Canada for this co-norming study after ethics review from the University of Calgary. While no specific exclusion criteria were utilized, all participants were able to adequately follow directions and complete the tasks, which is a common minimum requirement for motor task studies (Bohannon et al., Reference Bohannon, Wang, Bubela and Gershon2017; Fredriksen et al., Reference Fredriksen, Mamen, Hjelle and Lindberg2018; McQuiddy et al., Reference McQuiddy, Scheerer, Lavalley, McGrath and Lin2015; Moliner-Urdiales et al., Reference Moliner-Urdiales, Ruiz, Ortega, Jiménez-Pavón, Vicente-Rodgiguez, Rey-López and Moreno2010; Skogan et al., Reference Skogan, Oerbeck, Christiansen, Lande and Egeland2018; Tremblay et al., Reference Tremblay, Shields, Laviolette, Craig, Janssen and Gorber2010); many studies that have specific exclusion criteria were related to other aspects of the study (Emerson et al., Reference Emerson, Harrison, Everhard and Williamson2001; Gray et al., Reference Gray, Marshall, Livingston and Haak2000). Data falling outside of 1.5 times the inter-quartile range were deemed to be outliers and were excluded from the data file. After all outlying values were removed, 427 (186 female and 241 males) cases remained and were used in the tabulation of the norms. Additionally, due to small numbers, ages 12–14 were collapsed into a single category.
The majority of the participants 397 (93.0%) were right hand dominant and 30 (7.0%) were left hand dominant matching some findings of the rate of handedness in the general population (Corballis, Reference Corballis1989), while some more recent findings indicate rates around 10% (Papadatou-Pastou et al., Reference Papadatou-Pastou, Ntolka, Schmitz, Martin, Munafò, Ocklenburg and Paracchini2020). Participants were born between 2001 and 2012. Race and sex frequencies are reported in Table 1.
Table 1. Demographics

Instrumentation and Procedure
Following ethics approval, parent consent, and participant assent, the three measures of motor performance were administered to participants in one session, and data were collected between October 2017 and May 2019. Parents were asked to indicate hand preference of their children, and participants were also asked which hand they write with to confirm handedness at the time of testing; all participants indicated the same handedness as their parents reported. While some studies used specific tests to determine handedness (Emerson et al., Reference Emerson, Harrison, Everhard and Williamson2001; Knights & Moule, Reference Knights and Moule1967), several asked the participants (Butterfield et al. Reference Butterfield, Butterfield, Lehnard, Loovis, Coladarci and Saucier2009; Omar et al., Reference Omar, Alghadir, Zafar and Al Baker2018) or did report any handedness data (Bohannon et al., Reference Bohannon, Wang, Bubela and Gershon2017; Cohen et al., Reference Cohen, Voss, Taylor, Delextrat, Ogunleye and Sandercock2011; Fredriksen et al., Reference Fredriksen, Mamen, Hjelle and Lindberg2018; Gray et al., Reference Gray, Marshall, Livingston and Haak2000; Häger-Ross & Rösbland, Reference Häger-Ross and Rösbland2002; Hogrel, Reference Hogrel2015; Moliner-Urdiales et al, Reference Moliner-Urdiales, Ruiz, Ortega, Jiménez-Pavón, Vicente-Rodgiguez, Rey-López and Moreno2010; Tremblay et al., Reference Tremblay, Shields, Laviolette, Craig, Janssen and Gorber2010). All data were collected by the authors or trained research assistants and entered into SPSS. Following the assessment session, participants were entered for a draw to receive one of three tablets. Figure 1 provides details about the measure administration procedures, which were administered in a standard order to provide the required breaks between tasks.
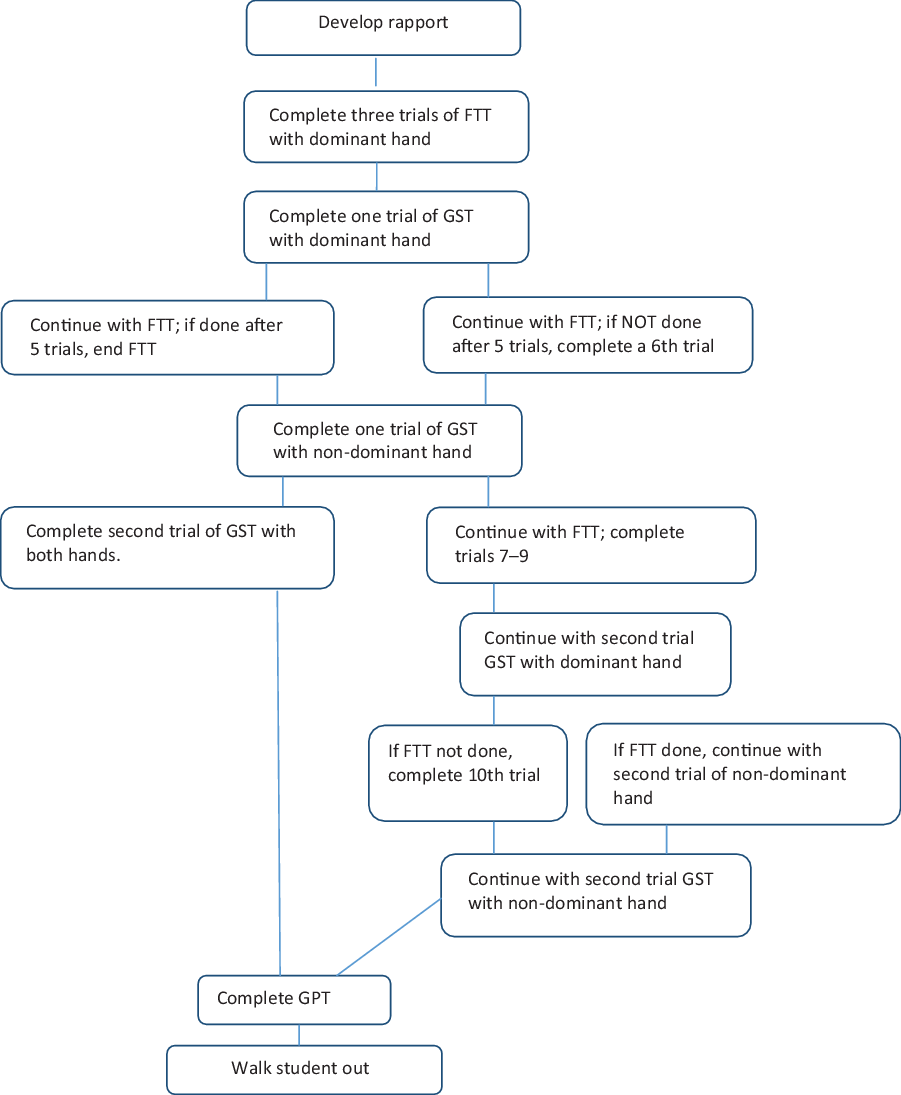
Fig. 1. Motor task order.
Finger Tapping Test (FTT)
A manual finger tapper was used for this study. The FTT was administered according to the Reitan and Wolfson (Reference Reitan and Wolfson1985) procedures, which were also described by Strauss, Sherman, and Spreen (Reference Strauss, Sherman and Spreen2006). Participants were asked to begin with their dominant hand to tap with their index finger as quickly as they could for 10 s after which the number of repetitions was recorded and the counter was cleared. A brief break was given after every third trial. The participants continued with tapping trials until five trials were within a 5-point range or after 10 trials were complete, whichever came first. After completing all trials with the dominant hand, the procedure was repeated with the non-dominant hand. Average number of taps per 10 s was recorded.
Grip Strength Test (GST)
The Smedley Dynamometer, which displays both pounds and kilograms with a maximum weight of 220 lb (100 kg), was used for this study. The grip was adjusted for hand size. GST was administered according to the Reitan and Wolfson (Reference Reitan and Wolfson1985) procedures, which were also described by Strauss and colleagues (2006). Participants were asked to stand and hold the dynamometer by their side with a straight arm beginning with their dominant hand. Participants were asked to squeeze as hard as they could while keeping their arm straight, and the examiner demonstrated that the pointer would stay after they let go. After the first trial, the examiner recorded the number and cleared the dynamometer, then the participant completed a second trial with the same arm. If the second trial was more than 5 kg different, the participant completed a third trial. After completing trials with the dominant hand, participants completed the same procedure with their non-dominant hand. Average grip strength performance across trials was reported.
Grooved Pegboard Test (GPT)
The Grooved Pegboard Model 32025 from Lafayette Instrument was used for this study. The GST was administered according to the directions in the manual (Lafayette Instrument, 2014), which were also described by Strauss colleagues (2006). Participants were instructed to begin with their dominant hand picking up pegs and placing them in the holes one at a time across rows beginning on the opposite side of the row (e.g., Right hand: left to right; Left hand: right to left). Time to complete placing all pegs across five rows was recorded in seconds starting after the examiner said “begin now,” and ending when the student placed the last peg or when the examiner said “stop” (Strauss et al., Reference Strauss, Sherman and Spreen2006); however, if the participant did not complete the task within five minutes it was discontinued. The task was then completed with the non-dominant hand. Similar to Rosselli, Ardila, Bateman, and Guzman (Reference Rosselli, Ardila, Bateman and Guzman2001) five rows were completed for all age groups.
RESULTS
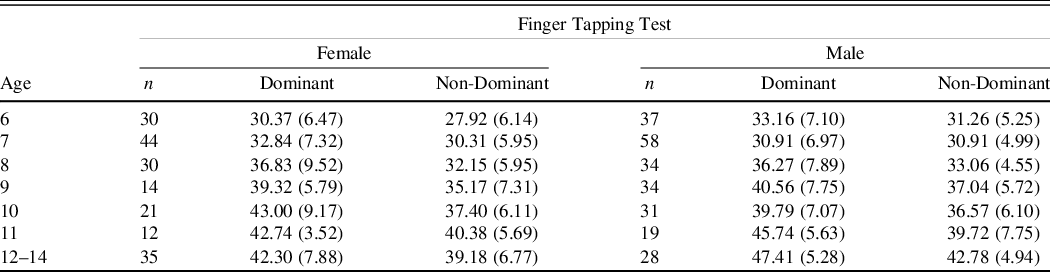
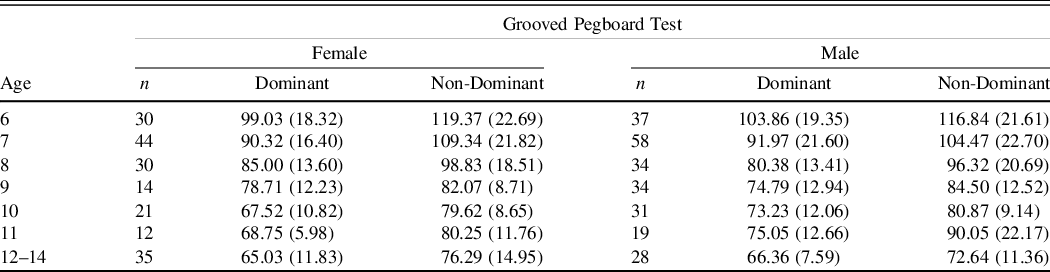
The means and standard deviations for FTT, GST, and GPT are presented separated by gender and hand dominance followed by gender comparisons of each measure. Alpha-controlled 2 × 2 analysis of variance (ANOVAs) were calculated for each of the variables, and there were no significant differences based on race when comparing White and with all other races combined due to the smaller numbers in other categories. Tables 2–4 provide normative data including means and standard deviations for FTT, GST, and GPT by age group. Independent-sample t-tests were conducted to compare performance in males and females on each of the measures using Bonferroni adjusted levels of .005. No significant differences were found for GPT on either dominant or non-dominant hands. No significant differences were found for FTT on dominant or non-dominant hand. There was a significant difference between males and females on GST for dominant hand in the 12–14 year olds t(61) = −3.01, p < .001, d = .69 with males demonstrating greater hand strength demonstrating with an absolute mean difference of 3.98 kg.
Table 2. Finger Tapping test mean number of taps (SDs) age and gender

Table 3. Grip strength test means in kilograms (SDs) age and gender
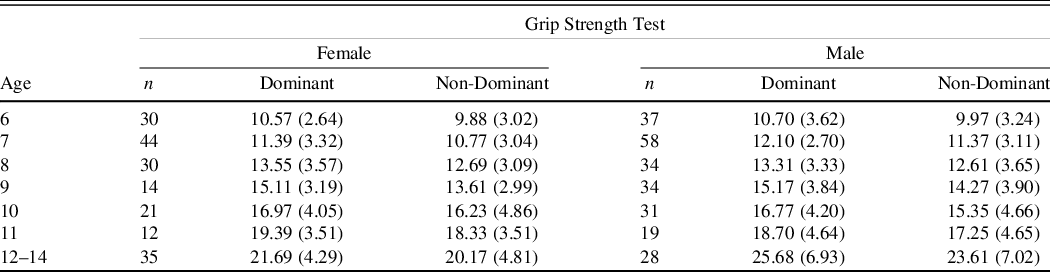
Table 4. Grooved Pegboard test mean time in seconds (SDs) by age and gender

The results demonstrate that performance generally improved across the developmental trajectory with number of taps in 10 s increasing and the number of kilograms of pressure exerted increasing while the number of seconds required to put the pegs in the holes decreasing (see Figures 2–4).
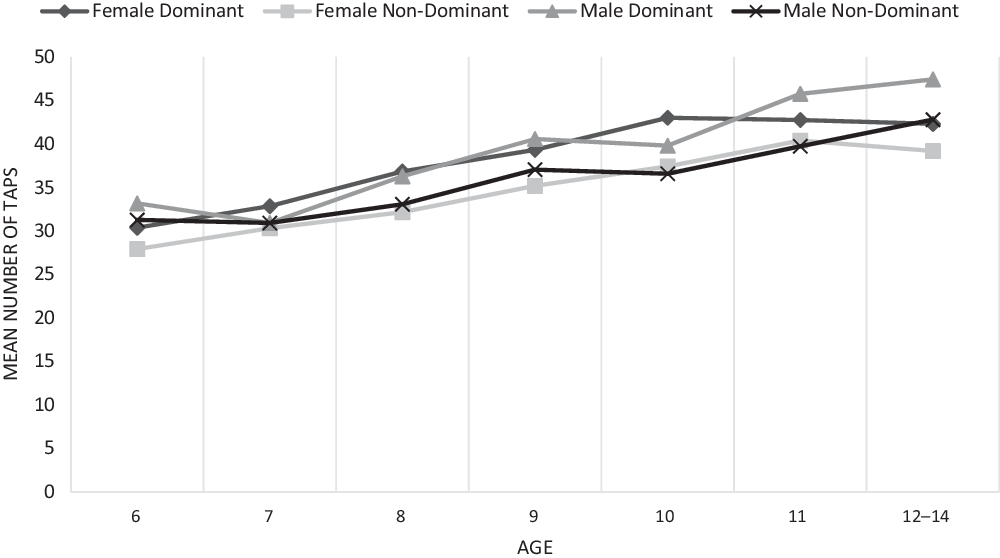
Fig. 2. Finger tapping test total taps.

Fig. 3. Grooved pegboard test completion time in seconds.
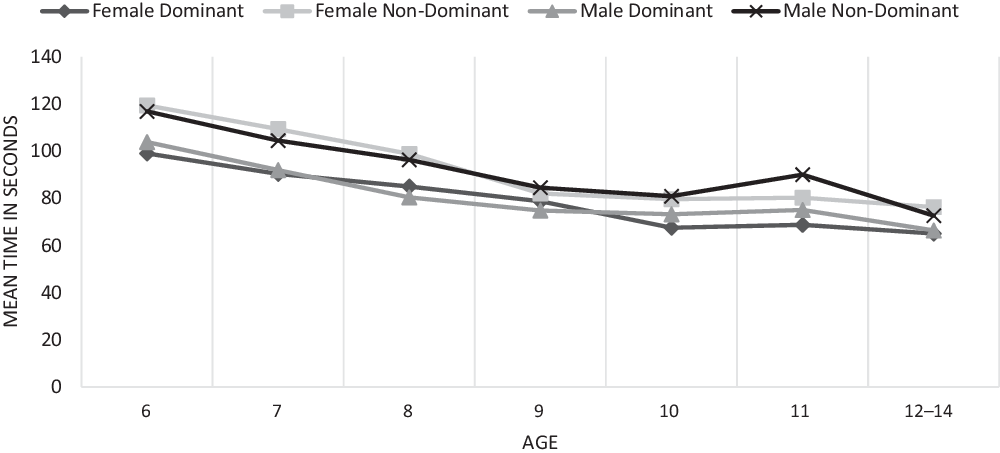
Fig. 4. Grip strength test performance in kilograms.
Correlations among the tests were calculated using the Pearson correlation coefficient. Table 5 lists the correlations among the variables in the study showing a positive correlation between FTT and GST, a negative correlation between GPT and both of FTT and GST, and a positive correlation was present for all three tests for dominant and non-dominant hands. Faster times on GPT indicates better performance, but higher scores are better on FTT and GST resulting in the negative correlation.
Table 5. Pearson correlations among FTT, GST, and GPB

* Correlation is significant at the 0.01 level (2-tailed).
DISCUSSION
In this study, co-normed data for FTT, GST, and GPT are provided for a community sample of Canadian children aged 6–14, providing an equivalent normative sample for the three tasks for clearer clinical comparison of performance across measures (Russell et al., Reference Russell, Russell and Hill2005) as well as a more diverse sample of participants. The results demonstrate that performance generally improves across ages. Skogan and colleagues found that performance on GPT appeared to stabilize around age 13–15 and FTT appeared to stabilize around age 14–16. Similarly, performance on FTT seemed to begin stabilizing around 11–14 on FTT but less so for GPT. It is important to note that our sample only went up to age 14, and we combined ages 12–14 due to small sample sizes. In our study GST performance was not yet stabilizing similar to findings in other studies (Fredriksen et al., Reference Fredriksen, Mamen, Hjelle and Lindberg2018; Häger-Ross & Rösbland Reference Häger-Ross and Rösbland2002; Omar et al., Reference Omar, Alghadir, Zafar and Al Baker2018).
There were no significant dominant versus non-dominant nor male versus female differences on GPT or FTT, but on GST 12–14-year-old boys were stronger on dominant their hand. Past research on pediatric performance suggests that, typically, boys are either stronger than girls (Frederickson et al. Reference Fredriksen, Mamen, Hjelle and Lindberg2018; Mandernach et al., Reference Mandernach, Gfeller and Cobia2004; McQuiddy et al., Reference McQuiddy, Scheerer, Lavalley, McGrath and Lin2015; Omar et al., Reference Omar, Alghadir, Zafar and Al Baker2018) or that they are similar until age 10 or 12, after which boys’ performance is higher than girls (Bohannon et al., Reference Bohannon, Wang, Bubela and Gershon2017; Butterfield et al., Reference Butterfield, Butterfield, Lehnard, Loovis, Coladarci and Saucier2009; Häger-Ross & Rösbland Reference Häger-Ross and Rösbland2002; Ploegmakers et al., Reference Ploegmakers, Hepping, Geertzen, Blustra and Stevens2013). In our findings, the significant difference appeared at ages 12–14, which is similar other research. Skogan and colleagues (Reference Skogan, Oerbeck, Christiansen, Lande and Egeland2018) found that performance on GPT was similar in males and females until age 10, when females begin performing faster, and they found no significant gender differences on FTT. We also found no gender differences on FTT. However, we also found no differences between males and females on GPT. As most studies did not report demographic information on race or had fairly homogenous samples, there is a possibility that there is less difference in performance on GPT for some races that resulted in no significant differences in our findings. However, this would need further study to determine if it was a possible contributor.
Our results demonstrated generally lower performance in grip strength compared with older data when looking at absolute scores (Butterfield et al., Reference Butterfield, Butterfield, Lehnard, Loovis, Coladarci and Saucier2009; Häger-Ross & Rösbland, Reference Häger-Ross and Rösbland2002); however, Butterfield et al. (Reference Butterfield, Butterfield, Lehnard, Loovis, Coladarci and Saucier2009) reported performance in right versus left hand rather than dominant versus non-dominant hand. Our results are similar to more recent finding (Fredriksen et al., Reference Fredriksen, Mamen, Hjelle and Lindberg2018) and similar to Ploegmakers et al. (Reference Ploegmakers, Hepping, Geertzen, Blustra and Stevens2013) for girls, but boys in our study performed more poorly. While on the surface, our results support previous claims (Cohen et al., Reference Cohen, Voss, Taylor, Delextrat, Ogunleye and Sandercock2011; Moliner-Urdiales et al, Reference Moliner-Urdiales, Ruiz, Ortega, Jiménez-Pavón, Vicente-Rodgiguez, Rey-López and Moreno2010; Tremblay et al., Reference Tremblay, Shields, Laviolette, Craig, Janssen and Gorber2010), it is important to more systematically study this phenomenon to determine whether these decreases are actually continuing and to include FTT and GPT.
While many studies indicate that about 10% of the population are left handed (see Papadatou-Pastou et al., Reference Papadatou-Pastou, Ntolka, Schmitz, Martin, Munafò, Ocklenburg and Paracchini2020), only 7% our sample were left-handed. Research into handedness has demonstrated variability in handedness rates based on geographical locations, with individuals from some areas demonstrating lower levels of left handedness likely due to negative perceptions of left-handedness. For example, Asia reported 7%, and Africa reported 8% of left handedness (Porac, Reference Porac2016). Our sample included students from a charter school with a large immigrant population, primarily from Africa and Asia. This could account for the lower percentage of participants in our study who were left-handed.
Strengths and Limitations
This study provided a more racially diverse sample than has previously been published. Past studies have largely not provided any information on the race of participants (Butterfield et al., Reference Butterfield, Butterfield, Lehnard, Loovis, Coladarci and Saucier2009; Emerson et al., Reference Emerson, Harrison, Everhard and Williamson2001; Omar et al, Reference Omar, Alghadir, Zafar and Al Baker2018; Ploegmakers et al., Reference Ploegmakers, Hepping, Geertzen, Blustra and Stevens2013) or reported predominantly White participants (Eng et al., Reference Eng, Fazio, Biddle, O’Grady and Denney2013; Gray et al., Reference Gray, Marshall, Livingston and Haak2000). Less than 50% of the participants in this study reported being White, which more closely reflects the increasing diversity of North America, especially in large urban areas, provides preliminary data of pediatric motor performance from a more diverse group of children, and provides additional transparency regarding the race of the participants (de Castro Mangalhães et al., Reference de Castro Mangalhães, Cardoso, Guimarães and Van Petten2015). While this study increased both diversity and transparency in diversity of its sample, work needs to continue to better stratify race and ethnicity to fit the population.
Other studies providing norms for FTT and that have large numbers of participants are often older (Findeis & Weight, Reference Findeis and Weight1994; Knights & Moule, Reference Knights and Moule1967: Mandernach et al., Reference Mandernach, Gfeller and Cobia2004); additionally Mandernach’s and colleagues’ work was only with adolescents collapsing data across both age and gender. A recent study provides FTT and GPT norms for a large sample of Norwegian children and youth but does not include GST (Skogan et al, Reference Skogan, Oerbeck, Christiansen, Lande and Egeland2018). While there are more recent studies providing norms for GST alone (Bohannon et al., Reference Bohannon, Wang, Bubela and Gershon2017; Fredriksen et al., Reference Fredriksen, Mamen, Hjelle and Lindberg2018; Ploegmakers et al., Reference Ploegmakers, Hepping, Geertzen, Blustra and Stevens2013), this study also provides normative data for smaller age bands of participants for FTT and GPT with more recent norms (Baron, Reference Baron2018; Findeis & Weight, Reference Findeis and Weight1994;) and included GST norms, increasing their clinical utility. Although, there are recent studies with larger norms for GST (Ploegmakers et al., Reference Ploegmakers, Hepping, Geertzen, Blustra and Stevens2013), they were not co-normed with the other motor tests. This study provides updated norms across all three of these commonly administered motor tests.
Participants in this study were entered for a draw to receive a tablet; there were two tablets given away in this study. Recent research has examined the impact of using incentives for vulnerable children and youth and found that it significantly increased participant response rates but that there were not significant differences between their responses on a survey (Pejteresen, Reference Pejteresen2020). The participants in this study were from a community sample rather than from vulnerable populations, so incentives were not likely to introduce bias and likely increased participant response rates.
Additionally, all tests were administered in the same order rather than counterbalancing them. However, studies of motor tasks generally do not report counterbalancing (Denckla, Reference Denckla1974; Fredriksen et al., Reference Fredriksen, Mamen, Hjelle and Lindberg2018; Gray et al., Reference Gray, Marshall, Livingston and Haak2000; Mandernach et al., Reference Mandernach, Gfeller and Cobia2004; Skogan et al., Reference Skogan, Oerbeck, Christiansen, Lande and Egeland2018), so it was unlikely to make our results differ from previous findings. Additionally, the tests have breaks built into them to decrease fatigue; the task order was designed so that other tasks were completed during the breaks to reduce fatigue from a specific test and to increase efficiency as a number of our participants were removed from class to complete tasks.
Clinicians using the norms in this study in their practice should consider that there were small numbers of participants at older ages which required us to collapse ages 12–14 into one grouping; consequently, it is important to use the norms for these ages cautiously when determining the performance of children in clinical settings as they span several years. Participants were recruited from community events (e.g., summer camps and sports arenas) and local charter (large immigrant population) and private schools (serving students with learning disabilities, students who were gifted, and schools with no specialization). As a result the participants from community events and private schools were likely to be from homes with higher socio-economic status and more involved parents. In the community events settings, many of the teenagers who demonstrated interest in the study were there without their parents and, consequently, were not able to participate, contributing to our lower numbers in older age bands. As a result, there is a potential for selection bias in the students and their families who participated; however, there was also a wide range of students included in the recruitment. Additionally, as data was collected at only one time, no test-retest reliability information is available. However, past information suggests strong test retest reliability for FTT (.78–.88; Knights & Moule, Reference Knights and Moule1967) and for GST (.81; Omar et al., Reference Omar, Alghadir, Zafar and Al Baker2018) and more variable test–retest reliability for GPT (.67 dominant; .73 non-dominant; Levine, Miller, Becker, Selnes, & Cohen, Reference Levine, Miller, Becker, Selnes and Cohen2004). Future research should aim to co-norm commonly co-administered assessment measures to ensure equivalency across normative samples. Norms with diverse demographic compositions are also necessary considering the increasingly diverse composition of school-aged children.
CONCLUSIONS
This study utilized data from 427 children from community settings aged 6 to 14 providing co-normed reference values for FTT, GST, and GPT. Motor tests are commonly used by neuropsychologists (Camara et al., Reference Camara, Nathan and Puente2000) as motor functioning is important for activities of daily living and acquisition of academic skills for children and are sensitive to pathology in pediatric populations; however, there are continued limitations with these measures including small numbers, outdated norms, and lack of co-norming between motor tests. This study contributes to the literature by providing updated norms that are co-normed for FTT, GST, and GPT with greater racial diversity.
Acknowledgements
None.
AUTHOR CONTRIBUTIONS
Both authors designed the study, collected and analyzed data, and wrote the paper.
FINANCIAL SUPPORT
This study was partially study by a University of Calgary Academic Research Support Grant 10012571. This research was approved by the University of Calgary Conjoint Faculties Research Ethics Board REB17-0478.
CONFLICTS OF INTEREST
The authors have nothing to disclose.