Introduction
For decades now, it has been known that traumatic brain injury (TBI) is associated with initial gross decreases in brain volume due to contact and acceleration/deceleration, hemorrhage, and edema related injuries. Animal studies demonstrate that via a variety of mechanisms traumatic brain injury leads to both necrosis and apoptosis throughout the brain, which following removal of cellular debris by macrophages result in gross loss of brain tissue (Chen, Fong, Lee, & Chiu, Reference Chen, Fong, Lee and Chiu2011; Farkas & Povlishock, Reference Farkas and Povlishock2007; Kelley, Farkas, Lifshitz, & Povlishock, Reference Kelley, Farkas, Lifshitz and Povlishock2006; Kelley, Lifshitz, & Povlishock, Reference Kelley, Lifshitz and Povlishock2007; Maxwell, Povlishock, & Graham, Reference Maxwell, Povlishock and Graham1997; Povlishock, Reference Povlishock1993; Povlishock & Christman, Reference Povlishock and Christman1995; Takeuchi & Nawashiro, Reference Takeuchi and Nawashiro2011). Results from animal studies have been convergent with findings in humans, both in studies using ex vivo immunohistochemical methods and in studies using in vivo neuroimaging techniques (Bigler, Anderson, & Blatter, Reference Bigler, Anderson and Blatter2002; Bigler & Maxwell, Reference Bigler and Maxwell2011; Bombardier et al., Reference Bombardier, Fann, Temkin, Esselman, Barber and Dikmen2010; Ding et al., Reference Ding, Marquez de la Plata, Wang, Mumphrey, Moore, Harper and Diaz-Arrastia2008; Gale, Burr, Bigler, & Blatter, Reference Gale, Burr, Bigler and Blatter1993; Gale, Johnson, Bigler, & Blatter, Reference Gale, Johnson, Bigler and Blatter1995; MacKenzie et al., Reference MacKenzie, Siddiqi, Babb, Bagley, Mannon, Sinson and Grossman2002; Sidaros et al., Reference Sidaros, Skimminge, Liptrot, Sidaros, Engberg, Herning and Rostrup2009; Takeuchi & Nawashiro, Reference Takeuchi and Nawashiro2011; Trivedi et al., Reference Trivedi, Ward, Hess, Gale, Dempsey, Rowley and Johnson2007; Warner et al., Reference Warner, Youn, Davis, Chandra, Marquez de la Plata, Moore and Diaz-Arrastia2010). Despite an extensive body of previous work indicating both initial volume loss and long-term cognitive change, there is a paucity of studies longitudinally examining brain change from the subacute to the chronic phase of recovery extending past 1 year post-injury. The present study investigates the specific pattern of regional volume loss beyond the first year post-injury and whether regional volumetric losses correlate with changes in cognitive and motor abilities.
Tensor-based morphometry (TBM) has previously been shown to be sensitive to longitudinal volume changes induced by TBI (Kim et al., Reference Kim, Avants, Patel, Whyte, Coslett, Pluta and Gee2008; Sidaros et al., Reference Sidaros, Skimminge, Liptrot, Sidaros, Engberg, Herning and Rostrup2009). TBM derives a tensor map that reflects the amount of stretching or contraction needed to exactly transform an anatomically anchored voxel in an initial brain image into the corresponding voxel in a later image of the same brain. The transformations, known as Jacobian determinants, are represented as a spatial map depicting where the brain has expanded or contracted over an interval of time (Leow et al., Reference Leow, Klunder, Jack, Toga, Dale, Bernstein and Thompson2006). These Jacobian maps provide information concerning the progression of brain changes post-injury, and could be useful for patient monitoring and for assessing the effectiveness of drug or behavioral therapies.
The current study is an extension of prior work on this cohort of TBI patients. One previous report, Bendlin et al. (Reference Bendlin, Ries, Lazar, Alexander, Dempsey, Rowley and Johnson2008), included voxel-based morphometry (VBM) analyses demonstrating initially decreased brain volume in TBI patients compared to controls, as well continuing volume loss among the TBI patients during an interval spanning 2 months to 1 year post-injury. A related report on participants from this cohort, Trivedi et al. (Reference Trivedi, Ward, Hess, Gale, Dempsey, Rowley and Johnson2007), showed large-scale decline in total brain volume with concomitant improvements in cognition from baseline to 1 year follow-up. For the current study, we contacted the prior participants and invited them to take part in a third round of studies approximately 4 years post-injury. We adopted the TBM methodology for this study to investigate the fine-grained longitudinal changes that occurred between three measurements at 2 months post-injury, 1 year post-injury, and 4 years post-injury. These detailed analyses provided novel longitudinal information beyond whole brain measurement, or VBM, reported in our prior papers and extend the follow-up window from 1 year to 4 years.
The primary goal of the present study was to assess the nature and localization of volumetric contraction that occurs beyond the first year post-injury in TBI patients. The existing study most similar to the present work, by Sidaros and colleagues (2009), used TBM to examine regional volume change during the first year post-injury and demonstrated diffuse white matter contraction and clinical improvement during this 1-year interval. Based on this excellent work and other previous research indicating early volume loss in both diffuse regions of white matter and injury-specific regions of gray matter, (Levine et al., Reference Levine, Kovacevic, Nica, Cheung, Gao, Schwartz and Black2008; Siren et al., Reference Siren, Radyushkin, Boretius, Kammer, Riechers, Natt and Ehrenreich2006), and subtle late phase (beyond the first year) cognitive recovery that is similar across patients with heterogeneous injury localizations (Anderson, Godfrey, Rosenfeld, & Catroppa, Reference Anderson, Godfrey, Rosenfeld and Catroppa2012; Demir, Altinok, Aydin, & Koseoglu Reference Demir, Altinok, Aydin and Koseoglu2006; Keren, Reznik, & Groswasser, Reference Keren, Reznik and Groswasser2001; Stern & Stern, Reference Stern and Stern1985; Whitnall, McMillan, Murray, & Teasdale, Reference Whitnall, McMillan, Murray and Teasdale2006), we predicted that late phase volume loss would be similar across subjects and concentrated in brain white matter. Additionally, this study sought to investigate whether neuropsychological testing after injury could be used to predict spatial patterns of volume loss over time, and whether changes in regional brain volume correlated with changes in neuropsychological test performance. Specifically, we expected poorer performance on cognitive tasks to be associated with brain change in regions relevant to the tasks, and that impaired performance would predict volume loss as compromised task relevant regions progressively atrophied. This hypothesis was based on previous studies indicating that removal of damaged tissue and cellular debris is an important part of recovery from TBI (Clark et al., Reference Clark, Bayir, Chu, Alber, Kochanek and Watkins2008; Johanson, Stopa, Baird, & Sharma, Reference Johanson, Stopa, Baird and Sharma2011; Liu, Chen, Dietrich, & Hu, Reference Liu, Chen, Dietrich and Hu2008; Zhang et al., Reference Zhang, Li, Chen, Yang, Zhang, Liu and Tao2008).
Methods
TBI Patients
Forty-six TBI patients participated in an initial magnetic resonance imaging (MRI) scan, 36 returned for a second visit. Twenty of these returned for an invited study extension and completed a third visit. Useable images were acquired in 17 TBI patients at all three visits. Two subjects were excluded due to acquisition errors, and one more was excluded due to a second head injury sustained in a motor vehicle accident between visits 2 and 3. The mean age of the final group was 34.5 ± 12.0 years at the beginning of the study; mean education was 12.9 ± 1.8 years. The final TBI group consisted of three women and fourteen men. The majority of the patients included in the study received acute treatment at the University of Wisconsin Hospital and Clinics level 1 trauma center and were referred from the departments of Neurosurgery, Trauma and/or Rehabilitation. The inclusion criteria for TBI consisted of involvement in a rapid impact injury to the brain (such as a motor vehicle accident or fall) causing a loss of consciousness, and subsequent admission for emergency medical attention. Patients sustaining penetrating or open head injuries were excluded from the study. Depressed skull fracture was not excluded (one patient). The average GCS score of patients at hospital admission was 7.2. For a detailed overview of clinical characteristics and injury descriptions, see Table 1. All TBI patients were less than 3 months post-injury at their first visit, and most were studied between 8 and 12 weeks post-injury, depending on their availability and other medical issues related to their injury. Exclusion criteria consisted of current major Axis I psychiatric disease or history of non-injury related major medical conditions (cancer, diabetes, or previously diagnosed neurological condition). All patients gave informed written consent under a protocol approved by the University of Wisconsin Health Sciences Institutional Review Board.
Table 1 Individual level subject demographics for patients and controls and select patient injury characteristics

Note. Age of participants indicates the age of participants at the start of the study. P-values are based on the results of two-tailed independent-samples t-tests for age and education and a chi-squares test for gender proportions. Abbreviations are as follows: GCSad = Glasgow Coma Scale score at hospital admission; GCS24 = Glasgow Coma Scale score 24 hours post-injury; Hrs15 = number of hours before patient reached a GCS score of 15; Scan1 = number of days between injury and initial scanning; DAI = diffuse axonal injury; T = patient was intubated at the time of GCS assessment.
Healthy Controls
Thirty-six control participants were recruited from the community and from the University of Wisconsin campus via advertisement. Seventeen of these participants returned for two additional visits. Useable scans were acquired in 13 participants at all visits (differences in acquisition necessitated the exclusion of four scans). The mean age of the final group was 26.8 ± 8.9 years at the beginning of the study; education was 15.2 ± 2.6 years; and there were five men and eight women. Exclusion criteria were identical to the TBI group, with the exception that head injury was also exclusionary for controls. MR scanning of control participants occurred on approximately the same schedule as that of TBI patients. All participants gave informed written consent under a protocol approved by the University of Wisconsin Health Sciences Institutional Review Board.
Procedures
Volunteers participated in three testing sessions, each consisting of neuropsychological testing and MR imaging. TBI patients were tested at three visits. Visit 1 was acquired approximately 2 months post-injury (m = 75 days post-injury, ranging from 25 days to 139 days). Visit 2 was acquired approximately 1 year post-injury and slightly less than 1 year after visit 1 (m = 395 days post-injury and 319 days after visit 1, for an interval ranging from 226 days to 414 days). Visit 3 was acquired approximately 4 years post-injury and slightly over 3 years after visit 2 (m = 1612 days post-injury and 1217 days after visit 2, for an interval ranging from 956 days to 1651 days). Controls also participated in three visits with approximately 1 year (m = 249 days) between visit 1 and visit 2 (ranging from 74 days to 374 days) and 3 years (m = 1203 days) between visit 2 and visit 3 (ranging from 778 days to 2011 days). The difference in inter-scan duration was not significant between groups for either scan interval.
Neuropsychological Examination
On the day of each scan (at each of the three visits), a neuropsychological battery that included: COWAT (Controlled Oral Word Association Test), WRAT-III (Wide Range Achievement Test) Reading Subtest (an approximation of pre-injury intellectual attainment), Finger Tapping, WAIS-III (Weschler Adult Inteligence Scale) Digit Span, and Trail Making Tests A and B was administered to each participant. These tests were selected based on previous research in our lab that suggested their probable relevance to TBI-induced behavioral changes. Analyses were conducted using raw scores and age, gender and education were included as covariates in the image analysis models. Participants were also administered several questionnaires, including a health history questionnaire, the BDI-II (Beck Depression Inventory), and the STAI (State-Trait Anxiety Inventory).
Magnetic Resonance Imaging
All participants underwent magnetic resonance imaging on a General Electric 3.0 Tesla MRI system with a quadrature birdcage head coil. Structural scans included an axial whole brain three-dimensional (3D) T1-weighted inversion recovery-prepped spoiled gradient echo scan with the following parameters: inversion time = 600 ms, repetition time/echo time/flip angle = 9 ms/1.8 ms/20°; acquisition matrix = 256 × 256 × 124; field of view (FOV) = 240 mm; slice thickness = 1.2 mm (124 slices); receiver bandwidth = ±16 kHz; acquisition time = ∼7.5 min.The reconstruction voxel size of 3D T1-weighted images was .94 mm × .94 mm × 1.2 mm. A neuroradiologist (H.R.) reviewed all structural MR images to identify the location and extent of lesions associated with the TBI and to identify non-injury related brain abnormalities that might exclude subjects from the statistical analyses.
Image Preprocessing
To create the Jacobian maps used for TBM for each interval, the following steps were taken (Figure 1): (1) visit 1 T1-weighted (T1W) images and visit 3 T1W images were co-registered to visit 2 T1W images using Statistical Parametric Mapping (SPM8; Wellcome Department of Imaging Neuroscience, University College London, UK) linear rigid-body co-registration; (2) high-dimensional warping was used to produce warped images and Jacobian images of the deformations for each subject; (3) warped T1W images were averaged together; (4) the averaged T1W image was then normalized to the Montreal Neurological Institute (MNI) International Consortium for Brain Mapping (ICBM) template in SPM8; (5) the normalization parameters from this process were applied to the Jacobian images; (6) the Jacobians were smoothed with an 8-mm isotropic Gaussian (Figure 1). Visit 1 and visit 3 images were co-registered and warped to visit 2 images to minimize the effect of interval-related interpolation. The visit 3 to visit 2 Jacobian images were inverted such that change signified by these images was in the same direction as that signified in the visit 1 to visit 2 images (meaning both sets of Jacobians indicated atrophy). Smoothing was used to facilitate inter-subject comparisons and enhance the signal to noise ratio.

Fig. 1 Shows a schematic of image processing steps used to create Jacobian maps. Boxes containing processing steps are numbered and in white text, while boxes containing sets of images are in black text.
Statistical Analyses
Statistics assessing demographic differences and differences in neuropsychological task performance between groups and within groups over time were carried out in SPSS19. Differences in mean age and education were assessed using independent-samples two-tailed t tests, differences in group gender proportions were assessed using a χ2 test, between-groups differences in neuropsychological task performance were calculated using independent-samples two-tailed t tests, and within-groups differences in neuropsychological task performance over time were calculated using paired-samples two-tailed t tests.
TBM statistical tests were performed on Jacobian maps using factorial analysis of variance (ANOVA) models in SPM8. Age, gender, education (in years), and interval length (in days) were used as covariates in all models. A false discovery rate (FDR) of p < .05 was used in all statistical maps, and the cluster threshold was set at 500 contiguous voxels. We hypothesized that there would be group differences in brain volume loss during both the first and second interval, and that the specific pattern of volume loss within the TBI group would be different during the first interval compared to the second. This was tested using a factorial design with interval (Interval 1 Jacobian maps; Interval 2 Jacobian maps) as the first factor and group (TBI, Control) as the second factor. We hypothesized that there would be overall group differences in patterns of volume loss and that these differences would vary between the two intervals, manifesting as a significant interaction between group and interval. We also hypothesized that the TBI group would demonstrate significant regional volume contraction compared to the control group during both the first and second intervals, and that the pattern of this volume change within the TBI group would be different in the first compared to the second interval. Simple effects analyses within the Factorial ANOVA model were used to investigate between-groups differences in patterns of volume loss during each interval. Paired samples t tests were used to investigate within-groups differences in patterns of volume loss between the two intervals. Percentage volume loss in key regions (as shown in Figure 4) was calculated by extracting the values of 3-mm spherical regions of interest (ROIs) at peak points within key regions at the same coordinates for each subject and subsequently averaging values across groups and converting them into percentage change.
Total brain volume was calculated by using SPM to segment individual T1W images into gray matter, white matter, and cerebrospinal fluid, and then adding the gray and white matter measurements. Percentage change in brain volume between time points was calculated by subtracting earlier volumes from later volumes, and then dividing the result by the initial volume. Between groups differences in percentage of brain volume loss and annual rates of brain volume loss were calculated using independent samples two-tailed t tests in SPSS 19. Within-groups differences in percentage brain volume loss and annual rates of brain volume loss were calculated using paired-samples two-tailed t tests in SPSS 19.
Our hypotheses regarding correlations with neuropsychological test scores were investigated using linear regression implemented in SPM8, where test scores were independent variables and Jacobian maps were dependent variables. This approach has been used in multiple previous studies (Hua et al., Reference Hua, Leow, Lee, Klunder, Toga, Lepore and Thompson2008; Leow et al., Reference Leow, Yanovsky, Parikshak, Hua, Lee, Toga and Thompson2009; Tao et al., Reference Tao, Datta, He, Nelson, Wolinsky and Narayana2009). For descriptive purposes, numerical correlations between structural change and neuropsychological task performance were calculated in regions shown to be significant in our SPM analyses. Correlational values were calculated by extracting the values of 3 mm spherical ROIs at peak points within regions at the same coordinates for each subject and subsequently averaging values across groups and converting them into percentage change. The percentage change values were then correlated with task scores or changes in task scores. We also sought to investigate whether correlations existed between total brain volume change and neuropsychological task performance. We investigated whether neuropsychological task performance was predictive of subsequent rates of total brain atrophy. Correlations between neuropsychological measures and whole brain volume changes were carried out in SPSS 19.
Results
Demographic and Behavioral Results
Group demographics are shown in Table 1. There was no significant age difference between TBI patients and controls. Controls had more education than TBI patients (t = 2.76; df = 20.49; two-tailed p = .012). In addition, there was a significantly lower proportion of females in the TBI group compared to the control group (χ2(1,30) = 6.111; p = .0134). Patient injury characteristics are also shown in Table 1. Neuropsychological test performance summaries are shown in Table 2. TBI patients performed significantly worse than controls on several tests at visit 1 (DSPAN, Trails A, Trails B, COWAT) and one test at visit 3 (Trails A). There were no significant between groups differences at visit 2. TBI patients did not differ significantly from controls on measures of pre-morbid intelligence (WRAT-III Reading Subtest) or emotional functioning (BDI-II, STAI-Trait and STAI-State).
Table 2 Neuropsychological test performance

Note. Means are of raw scores. Between-groups differences were calculated using independent samples two-tailed t-tests, and significance levels are *p < .05, **p < .01, ***p < .001. Between groups differences are noted by the patient average scores only. Within-groups differences were calculated using paired samples two-tailed t-tests and a significance level of p < .05 was used. Differences between time 1 and time 2 are denoted by †, differences between time 2 and time 3 are denoted by ‡, and differences between time 1 and time 3 are denoted by °. Because there were missing values the sample sizes in the paired tests varied. Test abbreviations are as follows: WRAT-III (Reading) = Wide Range Achievement Test III, Reading Subtest-raw score, DSPAN = Digit Span Test from the Weschler Adult Intelligence Scale, Third Edition, Trails A = Trail Making Test A, Trails B = Trail Making Test B, COWAT = Cognitive Oral Word Association Test, FT DOM = Dominant Hand Finger Tapping Test, FT NON = Non-Dominant Hand Finger Tapping Test, BDI-II = Beck Depression Inventory, STAI-S = State-Trait Anxiety Test state score, STAI-T = State-Trait Anxiety Test trait score.
TBM Results: Interaction
All imaging reports are bilateral unless otherwise noted. The results of the group by interval interaction produced significant clusters in large surface regions of all four major cortices (frontal, temporal, occipital, and posterior/inferior parietal) as well as a medial inter-hemispheric cortical region, in medial and right lateral cerebellum, and in white matter regions including anterior and superior corona radiata, superior longitudinal fasciculus, posterior inferior longitudinal fasciculus, genu and splenium of the corpus callosum, forceps minor, right internal capsule, superior external capsule, and sagittal stratum (Figure 2).

Fig. 2 A significant interaction between group and interval was observed within the factorial analysis of variance (ANOVA) model. There were inter-interval dissimilarities in group-wise differences in volumetric contraction in all regions shown in red. A false discovery rate (FDR) of p < .05 was used (corresponding to an F statistic of greater than 8.086), and a cluster threshold was set at 500 contiguous voxels.
TBM Results: Simple Effects
TBI patients demonstrated greater volume loss than control subjects in the following regions during the first interval: left frontal, temporal, posterior parietal, occipital and inter-hemispheric cortices, parahippocampal gyrus, lateral cerebellum, brainstem, thalamus, external capsule, and splenium of corpus callosum (Figures 3 and 4). TBI patients also demonstrated greater volume loss than control subjects in the following regions during the second interval: left parahippocampal gyrus, brainstem, thalamus, inferior longitudinal fasciculus, superior longitudinal fasciculus, external capsule, forceps minor, superior and anterior corona radiata and splenium, body and genu of the corpus callosum (Figures 3 and 4). There were no brain regions where the control group showed significantly greater volume loss than the TBI group during either interval. Paired samples t tests revealed that there were no significant differences between the pattern of volume loss observed in the first interval compared to the second interval within the TBI group. Analogous paired-samples t tests in the control group also failed to yield significant clusters.

Fig. 3 The traumatic brain injury (TBI) group demonstrated significantly more volume loss than the control group during both the first interval (shown in red) and the second interval (shown in blue). Yellow signifies regions where TBI subjects demonstrated significantly more contraction during both intervals. A false discovery rate (FDR) of p < .05 was used (corresponding to a t statistic of greater than 2.659 in the first interval contrast and 2.624 in the second interval contrast), and a cluster threshold was set at 500 contiguous voxels.

Fig. 4 To demonstrate the degree of volume loss exhibited by traumatic brain injury (TBI) patients in different structures, values were extracted from 3-mm spherical regions of interest (ROIs) in several key regions at the same coordinates in each subject's Jacobian maps. These values were converted to percentages and averaged. Second interval volume loss is shown as a percentage change from total volume at visit 2, and, therefore, total volume loss in a structure within a group for the study duration is equal to the sum of volume loss in the structure during each of the two intervals. ILF = inferior longitudinal fasciculus, SLF = superior longitudinal fasciculus. Control 1 = average percentage regional volume change among control participants during interval 1, Control 2 = average percentage regional volume change among control participants during interval 2, TBI 1 = average percentage regional volume change among TBI patients during interval 1, TBI 2 = average percentage regional volume change among TBI patients during interval 2.
Total Brain Volume Loss
Independent-samples two-tailed t tests demonstrated that there were no significant differences in the total amount of brain volume loss nor in the annual rate of whole brain volume loss between the two groups during either interval (Interval 1 Total: TBI patients, 2.1% ± 4.6%; Controls, 0.2% ± 6.9%; Interval 1 Annual: TBI patients, 2.8% ± 5.4%; Controls, 0.2% ± 2.5%; Interval 2 Total: TBI patients, 3.3% ± 3.6%; Controls, 1.3% ± 2.5%; Interval 2 Annual: TBI patients, 1.1% ± 1.1%; Controls, 0.4% ± 0.8%). During the entire 4-year study period, however, TBI patients demonstrated significantly greater total volume loss than controls (TBI: 5.4% ± 3.3%; Control: 1.2% ± 2.5%; p = .0006). The average annual volume loss for TBI patients during the 4-year study period was also significantly greater than that of controls (TBI: 1.3% ± 0.7%; Control: 0.3% ± 0.7%; p = .0007). Paired-samples t tests revealed that there were no significant within-groups differences in total or annual whole brain volume loss between the two intervals studied. All whole brain volume results are reported in Table 3.
Table 3 Annual and total percentage brain volume loss

Note: Bold numbers indicate mean volume loss and numbers in parentheses indicate the standard deviation of the mean. “Total” indicates total volume loss during the specified period and “Annual” indicates annualized volume loss during the specified period. Independent samples two-tailed t-tests were used to determine between-groups differences on all measures included in the table, and the significance level is *p < .05.
Neuropsychological Correlations
Of the six neuropsychological measures included in the study, two held some predictive value for volume loss among TBI subjects. Slower completion speed on the Trails A visuomotor speed task at visit 1 predicted greater volume loss in brainstem and cerebellum, both regions relevant to the task, during both the first interval and the second interval (Brainstem 1: r = .762; p = .00037; Cerebellum 1: r = .792, p = .00015; Brainstem 2: r = .880, p = .000003; Cerebellum 2: r = .755; p = .000001) (Figure 5). The second task that demonstrated predictive value for volume loss in TBI patients was Trails B. This tasks requires subjects to trace a path connecting alternating letters and numbers as quickly as possible (i.e., 1, A, 2, B, 3, C, etc.). Although there was no correlation between volume loss and Trails B performance during the first interval, slower completion speed of Trails B at visit 2 (1 year post-injury) predicted subsequent volume loss in the anterior cingulate cortex during the second interval (r = .856; p = .00001) (Figure 6).
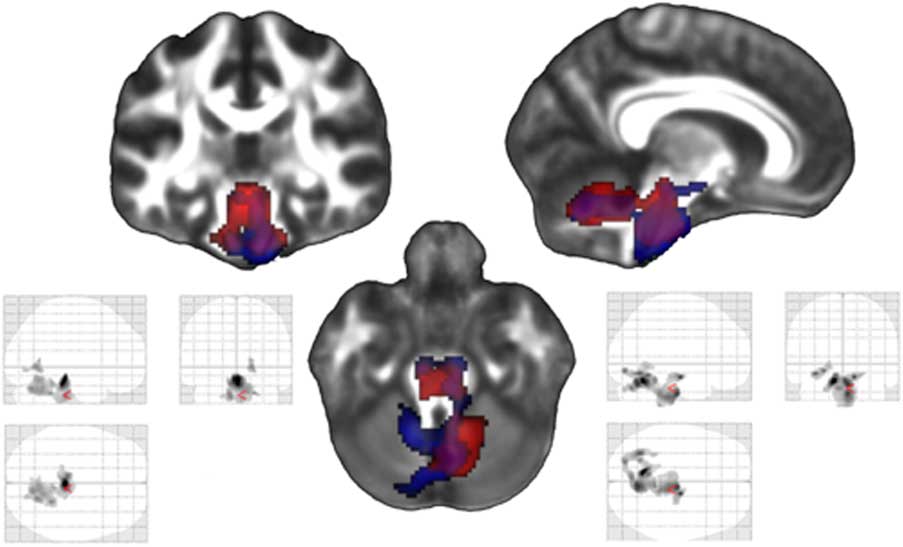
Fig. 5 Within the traumatic brain injury (TBI) group, there was a significant correlation between poorer Trails A score at time 1 and volume loss in the brainstem and cerebellum during the first interval. Results of this contrast are shown in the glass brain on the bottom left (which shows all significant regions on a transparent map) and in red on the combined figure in the center. There was also a significant correlation between poorer Trails A performance at time 1 and volume loss during the second interval in the same general regions. Results of this contrast are shown in the glass brain on the bottom right and in blue on the combined figure in the center. A false discovery rate (FDR) of p < .05 was used (corresponding to a t statistic of greater than 4.271 in the first interval contrast and 3.814 in the second interval contrast), and a cluster threshold was set at 500 contiguous voxels.

Fig. 6 There was a significant correlation between poorer Trails B scores (slower time to completion) at 1 year post-injury and greater volume loss in the anterior cingulate during the subsequent 3-year period. The results of this contrast are shown in the glass brain on the bottom right, which includes all significant regions depicted on a transparent map, and in red on the three representative orthogonal sections. A false discovery rate (FDR) of p < .05 was used (corresponding to a t statistic of greater than 3.732), and a cluster threshold was set at 500 contiguous voxels.
Correlations with whole brain volume loss demonstrated that among TBI patients, poorer scores on DSPAN, Trails A and Trails B at the first time point were associated with greater subsequent whole brain volume loss during the first interval, Trails B and COWAT scores from the second time point were associated with greater subsequent whole brain volume loss during the second interval, and none of the first time point cognitive task scores were associated with greater whole brain volume loss during the 4-year study duration. There were no significant correlations between neuropsychological test performance and subsequent whole brain volume loss among controls. For a complete review of whole brain volume correlations see Table 4.
Table 4 Neuropsychological test performance and subsequent whole brain volume loss

Note: Interval 1 whole brain volume loss was tested for correlation with neuropsychological task performance at the first time point, Interval 2 whole brain volume loss was tested for correlation with neuropsychological task performance at the second time point, and Total Study (Interval 1 and Interval 2 combined) whole brain volume loss was tested for correlation with neuropsychological task performance at the first time point. Significance levels are *p < .05, **p < .01, ***p < .001. Test abbreviations are as follows: WRAT-III (Reading) = Wide Range Achievement Test III, Reading Subtest, DSPAN = Digit Span Test from the Weschler Adult Intelligence Scale, Third Edition, Trails A = Trail Making Test A (motor), Trails B = Trail Making Test B, COWAT = Cognitive Oral Word Association Test.
Discussion
We studied longitudinal brain atrophy occurring from 2 months to 1 year and 1 year to 4 years post-injury in TBI patients, using TBM to evaluate the presence of regional contraction. The results of the group by interval interaction indicate that there was inter-interval dissimilarity in group-wise differences in volumetric contraction in large regions of all four major lobes (frontal, temporal, occipital, and posterior parietal) as well as a medial inter-hemispheric cortical region, in medial cerebellum, and in white matter regions including anterior and superior corona radiata, superior longitudinal fasciculus, posterior inferior longitudinal fasciculus, corpus callosum, forceps minor, left internal capsule, external capsule and sagittal stratum. Combining this result with our simple effects results (which demonstrate that different sets of regions exhibited greater contraction among TBI patients compared to controls in the first versus the second interval) indicates that while some regions exhibited contraction that was greatest during the first interval (such as the parietal and occipital cortices); other regions, primarily in white matter, demonstrated contraction that was greatest during the second interval (such as white matter of the superior and inferior longitudinal fasciculi).
Whole brain volumetric analyses indicated that while TBI patients did not exhibit greater volume loss than controls during either interval examined independently, patients did exhibit both greater total volume loss and a higher annual rate of volume loss during the 4-year study duration. These findings, combined with the factorial models, support our hypothesis that volumetric contraction continues to occur in TBI patients at a level in excess of that observed in controls beyond the first year post-injury, and that late chronic phase atrophy is localized differently than volume loss observed during the first year.
We found that TBI patients experienced a greater rate of atrophy than controls in frontal, temporal, posterior parietal, occipital and inter-hemispheric cortices, lateral cerebellum, brainstem, thalamus, parahippocampal gyrus, external capsule and splenium of corpus callosum during the first year post-injury. This pattern of volumetric contraction that encompassed both gray and white matter is consistent with previous work indicating that TBI patients as a whole experience a common pattern of atrophy as well as multi-focal cortical changes, (Bendlin et al., Reference Bendlin, Ries, Lazar, Alexander, Dempsey, Rowley and Johnson2008; Ding et al., Reference Ding, Marquez de la Plata, Wang, Mumphrey, Moore, Harper and Diaz-Arrastia2008; Kiraly & Kiraly, Reference Kiraly and Kiraly2007; Sidaros et al., Reference Sidaros, Skimminge, Liptrot, Sidaros, Engberg, Herning and Rostrup2009; Trivedi et al., Reference Trivedi, Ward, Hess, Gale, Dempsey, Rowley and Johnson2007).
Animal studies and ex vivo immunohistochemical studies in humans show that several necrotic and apoptotic processes (calcium influx caused by initial insult and secondary edema, edema-induced cytoskeletal disassembly, early and late axonal disconnection) as well as extensive Wallerian degeneration occur during the sub acute period and first year following TBI (Engel et al., Reference Engel, Schluesener, Mittelbronn, Seid, Adjodah, Wehner and Meyermann2000; Farkas & Povlishock, Reference Farkas and Povlishock2007; Fox & Faden, Reference Fox and Faden1998; Gale et al., Reference Gale, Johnson, Bigler and Blatter1995; Kelley et al., Reference Kelley, Farkas, Lifshitz and Povlishock2006, Reference Kelley, Lifshitz and Povlishock2007; Lifshitz, Kelley, & Povlishock, Reference Lifshitz, Kelley and Povlishock2007; Singleton, Zhu, Stone, & Povlishock, Reference Singleton, Zhu, Stone and Povlishock2002). These processes represent potential mechanisms for contraction observed in our study.
The second interval (between 1 and 4 years post-injury) was characterized by diffuse and extensive white matter atrophy in TBI patients and a relative lack of cortical contraction. Specifically, we observed significantly greater contraction in TBI patients compared to controls in brainstem, parahippocampal gyrus, thalamus, inferior longitudinal fasciculus, superior longitudinal fasciculus, internal capsule, external capsule, forceps minor, superior and anterior corona radiata and splenium, body and genu of the corpus callosum. Based on previous work indicating that the TBI patients continue to exhibit subtle cognitive improvements for many years after injury and other previous work demonstrating that regional white matter microstructural improvements in TBI are co-occurring with volume loss, it is conceivable that the volumetric contraction in white matter may be at least partially reorganizational or adaptive (Cernich, Kurtz, Mordecai, & Ryan, Reference Cernich, Kurtz, Mordecai and Ryan2010; Dikmen et al., Reference Dikmen, Corrigan, Levin, Machamer, Stiers and Weisskopf2009). This is a hypothesis for future work. Alternatively, there is a recent hypothesis that TBI is not merely an event but rather the initiation of a disease state with lifelong systemic impacts (Masel & DeWitt, Reference Masel and DeWitt2010). Continuing white matter atrophy may confer risk for post-trauma psychiatric diseases, metabolic disorders or neuroendocrine dysregulation, all of which are commonly associated with TBI (Anderson, Bigler, & Blatter, Reference Anderson, Bigler and Blatter1995; Bombardier et al., Reference Bombardier, Fann, Temkin, Esselman, Barber and Dikmen2010; Dikmen et al., Reference Dikmen, Corrigan, Levin, Machamer, Stiers and Weisskopf2009; Kiraly & Kiraly, Reference Kiraly and Kiraly2007; Whitnall et al., Reference Whitnall, McMillan, Murray and Teasdale2006). Regardless of the exact causes of atrophic changes, these novel data support an emerging picture of continuing long-term change that may inform treatment and rehabilitation in TBI.
Our hypothesis that impaired performance on neuropsychological measures (presumably caused by damage to brain regions necessary to complete the tasks) would predict volume loss in task relevant regions among TBI patients was partially supported by results of the Trails A and Trails B correlations. We theorize that other tasks tested for predictive value failed to produce significant correlational results because the other tasks tested are not as sensitive to TBI-induced neurological and cognitive changes as the Trails tasks, and, therefore, were not associated with specific undetectable initial damage (Frencham, Fox, & Maybery, Reference Frencham, Fox and Maybery2005). Slower completion speed on Trails A at the initial visit predicted atrophy in the white matter of the brainstem and cerebellum in both the first and second intervals (Figure 5), likely reflecting common downstream effects secondary to diffuse and variable injury in the cerebrum and cerebellum that coalesce in these dense white matter areas (middle cerebellar peduncle and cortical spinal tract). At the second visit, slower completion speed on the Trails B task, which requires subjects to engage in set shifting, was associated with volume loss in the anterior cingulate (a structure known to be required in set shifting and mental conflict resolution) during the subsequent interval (Figure 6). Whether this is related to gradual volume loss as cellular debris was slowly cleared away, or a plasticity-related process cannot be determined by these data, and would be an interesting topic for further research.
In addition to region specific correlations between regional volume loss and the Trails A and Trails B tasks, poorer performance on each of these tasks at visit 1 was associated with greater whole brain volume loss during the subsequent year. While it is difficult to interpret the precise meaning of these findings from imaging analyses alone, these results do underscore the sensitivity of the Trails A and B tasks to TBI induced damage. Other correlations between neuropsychological task performance and subsequent whole brain volume loss included visit 1 DSPAN performance and visit 2 Trails B and COWAT performance. No such correlations were observed among controls, indicating that the association between poorer task performance and subsequent whole brain volume loss is specific to TBI patients, and that these tasks may be sensitive to damage not easily observed on initial MRI.
Limitations
Some limitations of this study deserve mention. One limitation is that gender composition and education level differed between the two groups, possibly affecting results. Ideally, patients should be compared to matched controls; however, the TBI population is generally more heavily male and less educated than the general population, and previous studies of volumetric change in TBI patients that use gender and/or education matched controls (Kim et al., Reference Kim, Avants, Patel, Whyte, Coslett, Pluta and Gee2008; Sidaros et al., Reference Sidaros, Skimminge, Liptrot, Sidaros, Engberg, Herning and Rostrup2009) and those that use controls that are not thusly matched (Bendlin et al., Reference Bendlin, Ries, Lazar, Alexander, Dempsey, Rowley and Johnson2008; Trivedi et al., Reference Trivedi, Ward, Hess, Gale, Dempsey, Rowley and Johnson2007) return similar results. Furthermore, we included gender and education as covariates in our statistical models to decrease the effect of these differences. While there was no significant difference in the age distributions of the two groups, there is a trend toward a group difference. Additionally, the results of this study may be limited by the small size of the final groups. The TBI population and college aged controls are both itinerant populations, and, therefore, difficult to track for long periods of time. While statistical analyses indicated there were not significant differences in age, education or injury severity within either group between those who dropped out of the study and those who completed all three visits, the high attrition in both groups could still have biased our results. Finally, while we used a voxel-wise method for correction for multiple comparisons, this was done within contrasts only and not across the multiple contrasts performed.
Conclusion
This study demonstrates that TBI patients experience diffuse atrophy that is far in excess of age-matched controls for at least 4 years after injury. Several studies have shown that volume loss occurs in the first year following TBI, however, this study is among the first to show that contraction occurs well beyond the first year post-injury. Our results show that, as opposed to widespread volume loss observed in the first year post-injury, late-phase volume loss is centered almost exclusively in brain white matter. This late-phase white matter volume loss is pervasive, as most large white matter tracts in the brain are affected. Furthermore, our neuropsychological results indicate that volume loss following TBI should be considered in a broader context of ongoing neurological and functional change. Future work combining neuropsychological testing, morphometry, and potentially fMRI, as well as work in animal models, over an extended follow-up period will yield greater insight into the mechanisms underlying cognitive changes following TBI.
Acknowledgments
This study was supported by a Merit Review Grant from the Department of Veterans Affairs, the NIH MH65723 (SCJ), NIH AG000213, and by the facilities and resources of the William S. Middleton Memorial Veterans Hospital. The authors declare no conflict of interest. The assistance of Robert Dempsey, MD, Jack Sherman, PhD, Tisha Kawahara, Taylor Schmitz, Lisa Newman, Amy Hawley, and Erik Kastman is greatly appreciated. We also greatly appreciate the support of researchers and staff at the Waisman Center, University of Wisconsin, Madison, where MR imaging took place. Donald McLaren, PhD, is now affiliated with Harvard University Medical School and the Massachusetts General Hospital, Department of Neurology. Finally, we thank all the patients who took part in this study. The contents of this study do not represent the views of the Department of Veterans Affairs or the United States Government.