


INTRODUCTION
A major challenge in the field of cognitive aging is differentiating disease-related cognitive change from the more gradual decline expected in normal aging, which is particularly difficult during the preclinical stage of cognitive decline. A new research framework for diagnosing and staging Alzheimer’s disease (AD) posits such a period, “Clinical Stage 2,” which encompasses significant within person change from a previous level of functioning that is not yet severe enough to be categorized as mild cognitive impairment (MCI; Jack et al., Reference Jack, Bennett, Blennow, Carrillo, Dunn, Haeberlein and …Silverberg2018). However, precise guidance on how this preclinical change should be operationalized is not yet established.
While most normed neuropsychological instruments intended for use in geriatric populations publish performance norms for several age bands (e.g., Steinberg, Bieliauskas, Smith, Ivnik, & Malec, Reference Steinberg, Bieliauskas, Smith, Ivnik and Malec2005), with or without adjustments for relevant demographic features such as sex, education, or intelligence, they rarely account for a patient’s prior cognitive performance on the instrument itself. The clinician or researcher must resort to using reliable change or deviation estimates that may not fully account for underlying age-associated change or practice effects (Temkin, Heaton, Grant, & Dikmen, Reference Temkin, Heaton, Grant and Dikmen1999). Norms that adjust for a test-taker’s prior performance as well as demographic features would improve the validity of the interpretation in such circumstances.
One approach to this problem has been the use of a regression-based approach to predicting change (Attix et al., Reference Attix, Story, Chelune, Ball, Stutts, Hart and Barth2009; Crawford, Garthwaite, Denham, & Chelune, Reference Crawford, Garthwaite, Denham and Chelune2012; Duff et al., Reference Duff, Schoenberg, Patton, Paulsen, Bayless, Mold and … Adams2005; Hermann et al., Reference Hermann, Seidenberg, Schoenfeld, Peterson, Leveroni and Wyler1996; Maassen, Bossema, & Brand, Reference Maassen, Bossema and Brand2009). In this approach, participants’ demographics and baseline scores are used to calculate expected scores on follow-up tests. The difference between predicted and observed values is then compared against an estimate of the standard error of prediction (
 $SE_{p} $
); individual scores exceeding some threshold (e.g.,
$SE_{p} $
); individual scores exceeding some threshold (e.g.,
 $\,\pm\,1.5SE_{p} $
) are considered evidence of reliable change. Although influential, this approach assumes that the relationships between predictors and test scores are constant across all predictor strata. It is also rather indirect, since it relies on estimating the mean to understand individual performance that is far from the mean.
$\,\pm\,1.5SE_{p} $
) are considered evidence of reliable change. Although influential, this approach assumes that the relationships between predictors and test scores are constant across all predictor strata. It is also rather indirect, since it relies on estimating the mean to understand individual performance that is far from the mean.
Methodologies first developed for anthropometric indices (e.g., height and weight) provide an alternative approach. The first reference curves for height were published over a century ago using heights of Massachusetts schoolchildren (Bowditch, Reference Bowditch1891; Cole, Reference Cole2012). Similar curves are used still today to evaluate children’s development (WHO Multicentre Growth Reference Study Group, 2006). Although reference curves are commonly termed growth curves, in reality they are often produced using cross-sectional anthropometric data, and provide little information about individual height trajectories (Tanner, Whitehouse, & Takaishi, Reference Tanner, Whitehouse and Takaishi1966).
When considering the growth of an individual child, the quantity of most interest is typically how usual or unusual their stature is now, given previous measurements. We refer to reference curves developed in this way as conditional, in contrast with the unconditional reference curves produced with cross-sectional information only. Conditional curves can be developed by regressing stature at time
 $t_{j} $
on stature at time
$t_{j} $
on stature at time
 $t_{{j{\minus}1}} $
, controlling for the interval between observations (Berkey, Reed, & Valadian, Reference Berkey, Reed and Valadian1983; Cameron, Reference Cameron1980; Cole, Reference Cole1995; Healy, Reference Healy1974). The earliest analyses of conditional curves used parametric methods, making them conceptually similar to the regression-based methods described by Maassen et al. (Reference Maassen, Bossema and Brand2009); however, more recent work has instead used quantile regression, which requires fewer distributional assumptions (Wei, Pere, Koenker, & He, Reference Wei, Pere, Koenker and He2006). Moreover, these methods produce estimates that are more directly relevant to the problem at hand, namely, specifying thresholds that delineate unusual performance.
$t_{{j{\minus}1}} $
, controlling for the interval between observations (Berkey, Reed, & Valadian, Reference Berkey, Reed and Valadian1983; Cameron, Reference Cameron1980; Cole, Reference Cole1995; Healy, Reference Healy1974). The earliest analyses of conditional curves used parametric methods, making them conceptually similar to the regression-based methods described by Maassen et al. (Reference Maassen, Bossema and Brand2009); however, more recent work has instead used quantile regression, which requires fewer distributional assumptions (Wei, Pere, Koenker, & He, Reference Wei, Pere, Koenker and He2006). Moreover, these methods produce estimates that are more directly relevant to the problem at hand, namely, specifying thresholds that delineate unusual performance.
Through these methods, researchers can obtain curves describing the expected median cognitive trajectory, as well as trajectories for more extreme quantiles that denote unexpected loss or gain. In contrast, standard linear regression models the mean, and thresholds for extreme performance must be determined by extrapolation. Selection of quantiles is based upon their intended use and the amount of information available, as larger datasets enable the estimation of more extreme quantiles than smaller ones.
Conditional reference curves have recently been applied to the field of cognitive aging. Cheung and colleagues demonstrated the development of unconditional and conditional references using the Mini Mental State Exam (MMSE; Cheung et al., Reference Cheung, Xu, Feng, Feng, Nyunt, Chong and … Ng2015). Using quantile regression, they established smooth, age-linked reference curves for several percentiles of interest adjusting only for baseline covariates. A second set of per-person conditional reference curves was then created, adjusting both for covariates and previous MMSE performance. The conditional references provided a much narrower scope for normative performance than the unconditional references, as well as a clear visual aid for identifying potentially concerning change.
In this work, we extend the conditional reference methodology of Cheung and colleagues to the Wisconsin Registry for Alzheimer’s Prevention (WRAP) dataset. WRAP is a longitudinal cohort study of middle-aged and older adults who complete cognitive testing at regular intervals. This cohort is enriched with risk for Alzheimer’s disease (AD) due to parental family history (Johnson et al., Reference Johnson, Koscik, Jonaitis, Clark, Mueller, Berman and …Sager2018; Sager, Hermann, & La Rue, Reference Sager, Hermann and La Rue2005). Their mean age at first visit was 54, making WRAP an ideal population in which to examine preclinical cognitive decline.
Our goals in this study were to: (1) extend the unconditional and conditional reference methods using a range of tests known to be sensitive to preclinical decline; (2) develop a graphical tool for contextualizing individual performance over time; (3) begin reviewing validity evidence for the method by examining how abnormal conditional performance (ACP) relates to cognitive status and subjective functioning; and last, (4) explore differences between individuals that are flagged for abnormal unconditional and conditional performance. The overarching goal of these analyses is to develop a procedure that can be used in this and other cohorts to identify Stage 2 (preclinical) decline.
METHODS
Participants
The WRAP cohort currently includes neuropsychological data from 1561 participants who enrolled at midlife (~40–65 years of age) and were free of dementia at baseline. Follow-up visits are conducted at 2- to 4-year intervals. Participant retention is approximately 81%; median follow-up is 9 years for active participants (Johnson et al., Reference Johnson, Koscik, Jonaitis, Clark, Mueller, Berman and …Sager2018). This ongoing study is conducted in compliance with ethical principles for human subjects research defined in the Declaration of Helsinki, including review and approval by the University of Wisconsin Institutional Review Board, and the provision of informed consent by all participants.
Inclusion/exclusion criteria
When constructing growth curves, whether conditional or unconditional, the question of whom to include in the sample is paramount (Cole, Reference Cole2012; Corvalan, Reference Corvalan2014). A reference curve aims to describe typical growth, whereas a standard uses a sample selected for optimal health (e.g., WHO Multicentre Growth Reference Study Group, 2006; Xu, Luntamo, Kulmala, Ashorn, & Cheung, Reference Xu, Luntamo, Kulmala, Ashorn and Cheung2014). The protracted preclinical phase and variable age of onset associated with AD-related dementia and other dementias make it difficult to apply these strategies for sample selection, because it is not clear which members of a given sample are truly free of disease.
Instead, many studies exclude only people already evincing clinically significant impairment, such as those having a diagnosis of probable AD dementia or Parkinson’s disease (Kenny et al., Reference Kenny, Coen, Frewen, Donoghue, Cronin and Savva2013) and those with baseline scores on other neuropsychological tests suggestive of MCI (Cheung et al., Reference Cheung, Xu, Feng, Feng, Nyunt, Chong and … Ng2015). Because our exclusion criteria included a clinical/neurocognitive component, we refer to the curves we describe in this study as standards; however, we acknowledge that this sample likely contains many with preclinical disease, and that this terminology is thus an imperfect fit.
For these analyses, we selected the subset of WRAP participants who were free of clinical MCI or dementia through their first two study visits and were free of neurological conditions that could affect cognition. Exclusionary criteria (n) included: consensus diagnosis of MCI or dementia (n = 14), or self-reported diagnosis of epilepsy, stroke, multiple sclerosis, or Parkinson’s disease (n = 58), before Visit 3; had not yet completed Visit 3 (n = 376); had missing outcome or predictor data (n = 10); or were outside target age range (40–75 years) for any of the first three visits (n = 14). After exclusions, 1089 participants were included in the standards development sample.
Measures
Cognitive and clinical outcomes
At each visit, participants complete a comprehensive neuropsychological battery (details in Johnson et al., Reference Johnson, Koscik, Jonaitis, Clark, Mueller, Berman and …Sager2018). For these analyses, we created standards for the following tests and items: Rey Auditory Verbal Learning Test (AVLT; Schmidt, Reference Schmidt1996), learning trials sum and delayed recall trial (Form 1, list A); Trail-Making Test (TMT; Reitan, Reference Reitan1958), part A and part B; WAIS-III Digit Span (Wechsler, Reference Wechsler1997), forward and backward; Stroop Test (Trenerry, Reference Trenerry1989), Color and Color-Word trials. These tests were selected based on the sensitivity of these domains to early cognitive impairment (Hedden, Oh, Younger, & Patel, Reference Hedden, Oh, Younger and Patel2013) and the completeness of data, as all were administered at the participant’s baseline.
We also created standards for discrepancy scores calculated as follows: AVLT, delayed recall minus the last learning trial (trial 5); Trail-Making Test, part A minus part B; Digit Span, backward minus forward; and Stroop, color-word minus color. These discrepancy scores were of interest to us based on earlier evidence from our sample that intraindividual cognitive variability may be indicative of cognitive deterioration (Koscik et al., Reference Koscik, Berman, Clark, Mueller, Okonkwo, Gleason and … Johnson2016).
Informant-based assessments of clinical symptoms were also collected, including the Quick Dementia Rating System (QDRS; Galvin, Reference Galvin2015) and/or the Clinical Dementia Rating Scale (CDR; Morris, Reference Morris1997), combined as described in Berman et al. (Reference Berman, Koscik, Clark, Mueller, Bluder, Galvin and Johnson2017) (range = 0 to 3, 0.5 indicates MCI), and the Informant Questionnaire on Cognitive Decline in the Elderly, or IQCODE (Jorm & Jacomb, Reference Jorm and Jacomb1989) (range = 16 to 80, 48 represents no change, higher scores indicate worsening functioning). Subjective complaint measures included two items representing participants’ self-report of memory functioning: “Do you think you have a problem with your memory?” (0 = no, 1 = yes; Do not know coded to missing); and “Overall, how would you rate your memory in terms of the kinds of problems that you have?” (Likert scale range from 1 = “Major problems” to 7 = “No Problems”) (Memory Functioning Questionnaire; Gilewski, Zelinski, & Schaie, Reference Gilewski, Zelinski and Schaie1990).
Cognitive status determination
Participant cognitive status was determined after each study visit via a consensus conference review of cognitive performance, medical history, and other factors (for details, see Johnson et al., Reference Johnson, Koscik, Jonaitis, Clark, Mueller, Berman and …Sager2018; Koscik et al., Reference Koscik, Berman, Clark, Mueller, Okonkwo, Gleason and … Johnson2016). Cognitive statuses included: Cognitively Normal; Early MCI (i.e., scores that are at least 1.5 SD below expected on one or more test compared to our internal robust norms but which do not cross objective thresholds for MCI and are accompanied by few or no subjective cognitive complaints or clinically significant deficits); MCI; Dementia; or Impaired Not MCI. This latter category is assigned to a small number of participants whose history suggests longstanding impairment (e.g., history of learning disability) rather than a more recently acquired impairment. We included these participants in the standards development sample since they represent normal variation in the population. The standards developed in this study are not used during the consensus process; however, the corresponding raw scores are considered along with other tests, medications, and health factors in the cognitive status determination.
Statistical Methods
Software
Data management tasks were done using R (R Core Team, 2017) and SAS software version 9.4. Analyses were conducted in R, and documented using RStudio (RStudio Team, 2016) and knitr (Xie, Reference Xie2017).
Standards development
We created two sets of standards: unconditional standards, which summarize the distribution of each outcome within demographic strata, but do not consider previous measurements of that outcome; and conditional standards, which take into account both demographics and past performance on that test and so can be thought of as norms for evaluating change. To build both sets, we constructed regression quantiles using the R package quantreg (Koenker, Reference Koenker2017; R Core Team, 2017). We selected nine quantiles of interest to include the median, the 25th and 75th percentiles, and three quantiles in each tail which, for a normally distributed outcome, correspond to approximately
 $\,\pm\,1$
,
$\,\pm\,1$
,
 $\,\pm\,1.5$
, and
$\,\pm\,1.5$
, and
 $\,\pm\,2$
SD away from the mean (2%, 7%, 16%, 25%, 50%, 75%, 84%, 93%, 98%). For each outcome, preliminary unconditional models including only linear and quadratic age terms were constructed for the selected quantiles. If the quadratic term was nominally significant (p <.05) for at least two quantiles, it was retained in the model for all percentiles.
$\,\pm\,2$
SD away from the mean (2%, 7%, 16%, 25%, 50%, 75%, 84%, 93%, 98%). For each outcome, preliminary unconditional models including only linear and quadratic age terms were constructed for the selected quantiles. If the quadratic term was nominally significant (p <.05) for at least two quantiles, it was retained in the model for all percentiles.
Following model selection, we constructed unconditional standards for each cognitive outcome using selected age terms plus three categorical covariates: sex (0 = male; 1 = female), college completion (0 = no bachelor’s degree; 1 = has degree), and baseline WRAT reading score (Wilkinson, Reference Wilkinson1993) (here categorized as 0 = 66–89; 1 = 90–99; 2 = 100–109; 3 = 110–120), included as a proxy for education quality and verbal ability (Manly, Touradji, Tang, & Stern, Reference Manly, Touradji, Tang and Stern2003). We then modeled conditional standards by further controlling for an individual’s mean score on a given outcome at Visits 1 and 2, along with their number of prior test exposures (to represent practice effects).
For both conditional and unconditional standards, we constructed regression quantiles for all percentiles from 1 to 99. Estimated subject-specific conditional and unconditional percentiles were then derived by comparing each true score to the 99 predicted regression quantiles and selecting the quantile with the minimum absolute error. Cluster-robust bootstrap standard errors were used to control for the inclusion of multiple measurements per subject (Hagemann, Reference Hagemann2017).
Abnormal unconditional and conditional performance
For any given visit and cognitive test, a participant’s performance was referred to as abnormal unconditional performance (AUP) if the test score fell below the 7th unconditional percentile. For a normally distributed outcome, this percentile corresponds to approximately −1.5 SD below the expected mean for that stratum, a cutoff we and others have used in previous work evaluating MCI (Clark et al., Reference Clark, Koscik, Nicholas, Okonkwo, Engelman, Bratzke and … Johnson2016; Cook & Marsiske, Reference Cook and Marsiske2006; Koscik et al., 2014). Similarly, from Visit 3 onward, participants whose score fell below the 7th conditional percentile were flagged as exhibiting abnormal conditional performance (ACP) at that visit. Henceforth, each test score was associated with two binary variables indicating its abnormality compared to unconditional (0 = normal; 1 = AUP) or conditional (0 = normal; 1 = ACP) standards. A participant flagged for ACP or AUP at one visit for a given test was not necessarily flagged on the same test at the next visit.
Graphical tool
We developed a graphical tool to contextualize individual performance over time. Built on ggplot2 (Wickham, Reference Wickham2009), this module plots a participant’s individual test scores over time against a series of age-based curves representing unconditional regression quantiles for that participant’s sex, education, and literacy level. Test scores receiving ACP flags are circled. We present four cases in the results to illustrate use of the graphical tool.
Construct validity
To assess whether ACP on a given test measured increased risk of abnormal cognitive status (one aspect of construct validity), we asked two questions: Do our quantile-regression-based abnormal conditional performance (ACP) indicators at a given visit correlate with cognitive status at the same visit? And does ACP at an early visit, controlling for AUP, predict a person’s cognitive status at the last visit? To answer these questions, we constructed generalized linear models for each outcome, using data from Visit 3 onward (the first visit for which ACP information was available).
For models linking ACP to concurrent diagnoses, we estimated the relationship using generalized estimating equations for ordinal outcomes (multgee package; Touloumis, Reference Touloumis2015). For the question relating first-available ACP and AUP indicators to future diagnoses, we estimated the relationship using ordinal regression (MASS package, function polr; Venables & Ripley, Reference Venables and Ripley2002). For these analyses, we eliminated anyone whose cognitive status was Impaired Not MCI.
Evidence regarding the utility of subjective complaints in identifying cognitive impairment is mixed (Roberts, Clare, & Woods, Reference Roberts, Clare and Woods2009). However, people’s complaints may indicate that they have noticed a drop in their own performance that still leaves them above conventional thresholds for impairment, in which case we would expect ACP to be associated with these subjective measures. To test this, we modeled ACP as a function of each of three subjective measures using generalized estimating equations for binary outcomes (geepack package; Højsgaard, Halekoh, & Yan, Reference Højsgaard, Halekoh and Yan2006).
Each of the above questions regarding cognitive status and subjective cognitive complaints involved constructing 12 models (1 for each of 8 test scores, plus 1 for each of 4 discrepancy scores); for each set of 12, we adjusted p-values for multiple comparisons using the Benjamini-Hochberg method for controlling the false discovery rate (Benjamini & Hochberg, Reference Benjamini and Hochberg1995). This method assumes that outcomes are either independent or positively dependent, an assumption these analyses generally met (minimum pairwise
 $r{\equals}{\minus}.07$
).
$r{\equals}{\minus}.07$
).
Joint distribution of ACP and AUP indicators
For all outcomes, we categorized participants’ Visit 3 performance as follows: normal by both standards; AUP only; ACP only; and both ACP and AUP. We expected that approximately 6–7% should meet criteria for each, but had no a priori hypothesis about the overlap between the two. Exploratory graphical analysis compared point estimates and 95% confidence intervals (CIs) for proportions in each of these groups having a clinical status at their last visit, using Wilson’s method for calculating CIs for binomial proportions (Brown, Cai, & DasGupta, Reference Brown, Cai and DasGupta2001).
RESULTS
Participant Characteristics
Baseline characteristics for this sample are shown in Table 1 overall and by sex. More men had college degrees. Men and women differed at baseline on most of the cognitive measures, except Stroop Color, Stroop Discrepancy, Digit Span Backward, and Digit Span Discrepancy.
Table 1 Baseline characteristics of sample, overall and separated by sex

For continuous variables, p-values reflect between-sample t-tests comparing men and women; for categorical variables, they reflect
 $\chi ^{2} $
tests of independence.
$\chi ^{2} $
tests of independence.
Unconditional Standards
Coefficients for unconditional regression quantiles at median and 7th-percentile performance are listed in Table 2 for all outcomes. Notably, after adding demographic terms, the coefficients for age were near zero (indicating minimal change per year) in several models.
Table 2 Regression coefficients for median and 7th-percentile unconditional models

Quadratic age terms were retained when nominally significant (p <.05) in preliminary models for at least two quantiles. Models were otherwise unselected, in that all coefficients were retained regardless of significance.
Int = intercept; %ile = percentile.
Conditional Standards
Coefficients for conditional regression quantiles at median and 7th-percentile performance are listed in Table 3. Among these models, the linear age coefficient was near zero for Digit Span Backward (median) and Stroop Discrepancy (7th percentile). Coefficients for practice indicated benefit from previous exposures, except for Stroop Color-Word.
Table 3 Regression coefficients for median and 7th-percentile conditional models

Quadratic age terms were retained as in unconditional models. Models were otherwise unselected, in that all coefficients were retained regardless of significance.
Int = intercept; %ile = percentile.
Graphical Display of Example Cases
The R programming platform was used to develop a graphical display of an individual participant’s performance superimposed on the unconditional standards with scores falling below our conditional 7th percentile cutoff being demarcated by a black circle. In Figure 1, longitudinal performance of four participants are shown for AVLT Total, AVLT Delayed, and Stroop Color-Word.
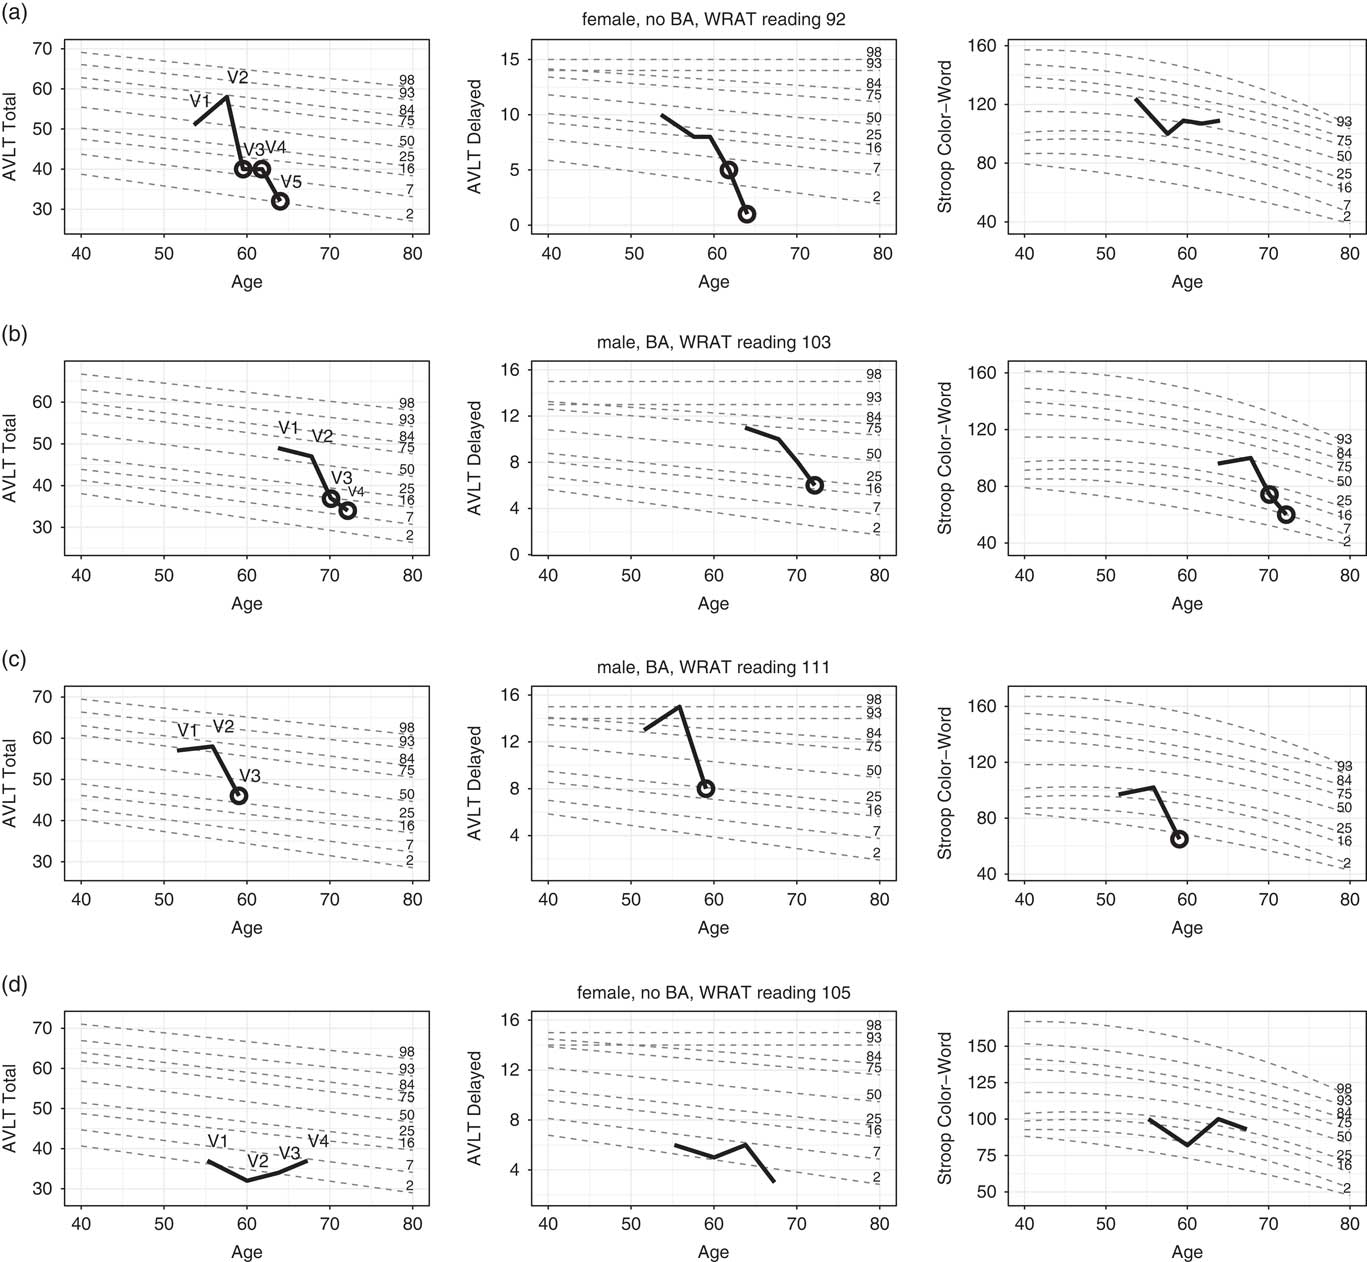
Fig. 1 Longitudinal performance of four individuals (thick black) on each of three cognitive tests. Performances are plotted against demographically-adjusted unconditional standard lines for several percentiles (grey dotted lines). Circles (black) indicate abnormal conditional performance (ACP). Additional case details: a: Full-scale IQ = 107 (68th percentile); has been involved with caregiving for family members since enrollment (including a parent with AD from Visits 1 to 3); worked as a manager at enrollment and retired between Visits 3 and 4. No self-report of significant history of mental health problems; CES-D scores in normal range for all visits. Significant back pain at Visit 5 required a minor testing accommodation. b: Full scale IQ 113 (88th percentile); retired teacher/coach at enrollment; history of depression and anxiety (began taking buproprion between Visits 3 and 4); most recent CES-D score was 34, indicating moderate depressive symptomatology; also reports hearing difficulty (evident in testing at Visit 4). c: Full-scale IQ of 133 (99th percentile); works as a management consultant (full-time at enrollment, part-time at and after Visit 2); no self-report of significant mental health history, and normal CES-D scores at all WRAP visits; stroke between Visits 2 and 3. d: Full-scale IQ of 114 (81st percentile); former director of a company (retired between visits 3 and 4); treated for a tick-borne illness prior to third WRAP visit and diagnosed with cancer shortly after third visit. No behavioral observations noted during visits other than patient having time constraints.
Figure 1a illustrates the performance of a woman with a parental history of AD (PH+) who enrolled in WRAP at age 53, had WRAT-3 reading standard score of 92, had some college education, and has been followed for five visits over 10 years. She was judged to be cognitively normal via consensus conference for the first four visits, and given a diagnosis of MCI at Visit 5. However, she exhibited ACP on at least one test at Visit 3 (the first for which ACP information was available and more than 4 years previous to MCI diagnosis) and at all subsequent visits. The earliest test to show change was AVLT Total. By Visit 4, she was also exhibiting ACP on AVLT Delay, Trails Discrepancy, and Stroop Color. At Visit 5 (concurrent with her first clinical diagnosis), ACP emerged on AVLT Discrepancy.
Figure 1b illustrates the performance of a man with no parental history of AD (PH-) who enrolled in WRAP at age 63, had a WRAT-3 reading standard score of 103, had some graduate school training, and has been followed for four visits over 8 years. He was judged at consensus conference to be cognitively normal for three visits and Early MCI at Visit 4 (i.e., subclinical deficits). However, he exhibited ACP on AVLT Total and Stroop Color-Word at Visit 3, 2 years previously, and on several tests at Visit 4, including AVLT Total, AVLT Delay, TMT Part A, TMT Part B, Stroop Color, and Stroop Color-Word.
Figure 1c illustrates the performance of another man (PH-) who enrolled in WRAP at age 51, had a WRAT-3 reading standard score of 111, had completed some graduate school and has been followed for three visits over 7 years. His consensus conference diagnosis has been cognitively normal at all visits, but at Visit 3 (his most recent), he exhibited ACP on AVLT Total, AVLT Delay, TMT Part B, Stroop Color, and Stroop Color-Word.
Figure 1d illustrates the performance of a woman who enrolled in WRAP at age 55 (PH+, WRAT-3 = 105, 14 years of education), and has participated in four visits over 12 years. She was judged via consensus conference to be cognitively normal at visit 3 and early MCI at visits 1, 2, and 4. She had UCP on both AVLT Total and Delay at all four visits and no visits with ACP on any tests.
Validity of ACP
Concurrent cognitive status
Although the study is still ongoing with relatively few conversions to MCI and dementia (N = 27), we can begin to assess validity by comparing ACP flags to cognitive statuses. Figure 2 depicts odds ratios (ORs) and their CIs from an ordinal generalized estimating equation (GEE) regression linking participants’ ACP flags (0 = normal; 1 = ACP) to their concurrent statuses (0 = Cognitively Normal; 1 = Early MCI; 2 = MCI/Dementia). OR CIs greater than 1 indicate increased risk of impairment among those with ACP vs normal conditional performance on that test. ACP on AVLT Total, AVLT Delayed, AVLT Discrepancy, TMT Part A, TMT Part B, Stroop Color, and Stroop Color-Word were each associated with higher odds of a concurrent cognitive status indicating impairment (Early MCI or MCI/Dementia). No relationships were observed with any flag based on Digit Span. CIs for most discrepancy scores overlapped 0, and no discrepancy score offered more information than its component scores.
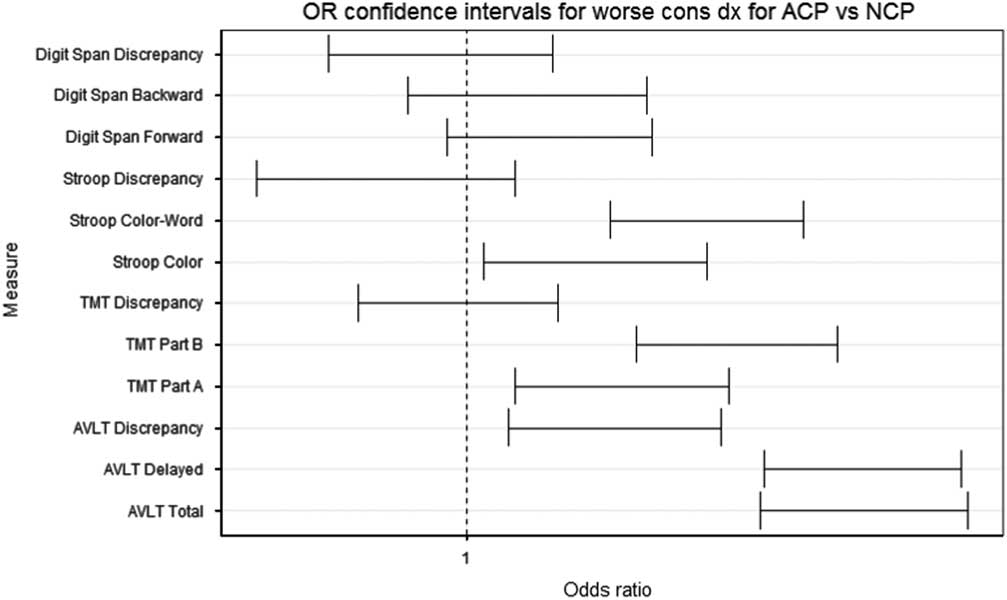
Fig. 2 Confidence intervals on odds ratio estimates for ordinal regression predicting cognitive status from concurrent ACP.
Prospective cognitive status
We can also begin to ask whether ACP on a given test at an early visit improves prediction of later cognitive outcomes, after controlling for AUP on the same test. Among the subset that was cognitively normal at Visit 3 and had a final cognitive status at Visit 4 or later (N = 709), we examined whether first available ACP (at Visit 3) was predictive of last available cognitive status [at visit 4, 5, or 6; 0 = Cog Normal (N = 651), 1 = Early MCI (N = 53), 1 = MCI/Dementia (N = 5)], controlling for Visit 3 AUP. In no analysis was this predictive relationship significant. AUP itself was predictive of final diagnosis for AVLT Delayed and TMT part B. Results are summarized in Table 4.
Table 4 Summary of ordinal regression results predicting most recent cognitive status from Visit 3 ACP and AUP

Reported p p-values have been adjusted using the Benjamini-Hochberg procedure. Note that this step-down procedure follows the constraint
 $p.adj_{i} \leq p.adj_{{i{\plus}1}} $
, which may result in identical values when raw p-values are large and/or closely spaced.
$p.adj_{i} \leq p.adj_{{i{\plus}1}} $
, which may result in identical values when raw p-values are large and/or closely spaced.
In a secondary analysis on the larger subset whose cognitive status was not clinically impaired (inclusive of normal and early MCI at visit 3; N = 830), we examined whether first available ACP and concurrent AUP on a given test were significant predictors of the last available clinical status [0 = Cog Normal or Early MCI (N = 815), 1 = MCI/Dementia (N = 15)]. As in the ordinal results, clinical status was not related to Visit 3 ACP for any of the neuropsychological measures, and only related to Visit 3 AUP for AVLT Delayed.
Subjective Memory Complaints and Informant Reports
After adjustment for multiple comparisons, Likert-scale self-ratings of memory showed significant relationships with ACP on AVLT Total and AVLT Delayed, and with AUP on AVLT Delayed and TMT part B (Supplementary Table 1; Figure 3). Similarly, participants’ responses to the binary question, “Do you think you have a problem with your memory?” were significantly related to ACP on AVLT Total and AVLT Delayed, but not to ACP in other non-memory domains (Supplementary Table 2). Finally, models using informant scores on the IQCODE to predict concurrent ACP are summarized in Table 5. Whereas subjective memory related most strongly to ACP on memory measures, IQCODE related instead to ACP on the challenge-conditions from three different tests: AVLT Delayed, TMT part B, and Stroop Color-Word.

Fig. 3 Predicted probability plots for models of ACP (first panel) and AUP (second panel) on AVLT Total as a function of subjective memory performance (x-axis). The linear predictor is shown in filled, and the observed proportions at Visit 3 in open; the label indicates the total N observed at Visit 3 for each x-value.
Table 5 Summary of GEE model predicting ACP from informant reports of cognitive functioning (IQCODE)

Higher scores on this measure indicate worse functioning; accordingly, ORs represent change in risk associated with one-point increase in reports of worsened function. Reported p-values have been adjusted using the Benjamini-Hochberg procedure. Note that this step-down procedure follows the constraint
 $p.adj_{i} \leq p.adj_{{i{\plus}1}} $
, which may result in identical values when raw p-values are large and/or closely spaced.
$p.adj_{i} \leq p.adj_{{i{\plus}1}} $
, which may result in identical values when raw p-values are large and/or closely spaced.
Summary Statistics: Numbers Flagged Under Each Method
Table 6 contains numbers of participants identified at Visit 3 as exhibiting ACP, AUP, or both. If regression quantiles are well-constructed, approximately 6–7% of measurements should be flagged as either ACP or ACP+AUP; similarly, 6–7% of measurements should be flagged as either AUP or ACP+AUP. Conditional models performed as expected, flagging 6–7% of observations at Visit 3 for all neuropsychological outcomes. Unconditional models were a bit more variable, generally flagging 5–8% of observations, but more for Digit Span Forward (10%) and Digit Span Backward (10.1%). We see substantial overlap between the categories, with disproportionate numbers receiving both flags; however, for most of the tests, AUP and ACP each detect evidence of poor performance when the other does not.
Table 6 Frequency of ACP and AUP flags at Visit 3, by subtest

AUP indicates an observed score at or below the sixth unconditional percentile; ACP, an observed score at or below the sixth conditional percentile; ACP and AUP, a score falling below both sixth percentile cutoffs; and Normal, a score at or above both seventh percentile cutoffs.
Figure 4 illustrates the proportions in each group presenting with a clinical diagnosis (MCI or Dementia) at their last observed visit (Visit 3+). Compared to the 95% CI for the Normal subset, higher proportions with clinical diagnoses were found in the AUP Only group on four tests; ACP only on six tests; and AUP+ACP on nine tests. This suggests ACP may add information. However, the wide CIs around these estimates are a reminder of the small number of clinical conversions at this point in the study and the need for caution in interpretation.

Fig. 4 Proportions in each of four groups (Normal, AUP Only, ACP Only, ACP and AUP) with a final consensus diagnosis indicating a clinical status (MCI or Dementia). 95% confidence intervals were calculated using Wilson’s method (Brown et al., Reference Brown, Cai and DasGupta2001).
DISCUSSION
This study presents a novel method for detection of preclinical cognitive changes based on a method first developed for anthropometric indices, namely, longitudinal reference curves (Bowditch, Reference Bowditch1891; Healy, Reference Healy1974). Unconditional and conditional standards for an age range of 40–75 were derived from longitudinal assessments of the WRAP cohort of cognitively healthy individuals enriched for parental history of AD dementia. Both sets of standards incorporate sex, literacy, age, and education in development of equations representing percentiles spanning from low to high functioning. However, because they also account for past performance, the conditional standards can function as norms for change.
We illustrate the utility of these standards by plotting longitudinal performance of four WRAP participants superimposed on the unconditional percentiles, with highlighted scores representing potentially troubling within-person change according to conditional standards. In these cases, abnormal conditional performance on one or more tests heralded an abnormal consensus conference diagnosis associated with MCI or probable AD (cases 1 and 2) or stroke (case 3). The fourth case illustrates performance of a person who has shown stable but low performance relative to unconditional standards at all study visits. We found that test performance outside of expected ranges based on unconditional and conditional standards for cognitive change were associated with subjective and informant reports of cognitive decline, and a concurrent consensus conference diagnosis of cognitive impairment. However, conditionally low performance was not associated with prospective consensus conference diagnosis. We discuss potential reasons for this null finding below in Limitations.
The application of quantile regression methods to these tests represents a significant extension of earlier work presenting unconditional and conditional standards for MMSE (Cheung et al., Reference Cheung, Xu, Feng, Feng, Nyunt, Chong and … Ng2015). Compared to WRAP, their sample was older (mean baseline age = 65 years) and had less follow-up data (maximum of three visits). By extending the method to tests sensitive to early cognitive change, we can begin to evaluate its utility in populations most likely to benefit from prevention efforts.
Currently, there is no agreed-upon method for identifying worrisome change in clinical or research settings. The development of conditional standards presents one approach that can be tied directly to stage 2 of the newly published Alzheimer’s pathophysiological continuum (Jack et al., Reference Jack, Bennett, Blennow, Carrillo, Dunn, Haeberlein and …Silverberg2018); in this model, stage 2 corresponds to a drop in cognitive performance that has not yet crossed objective thresholds for cognitive performance. We propose the method described in this study as a starting point to operationalize such decline. Follow-up analyses will be done using different operationalizations for decline (e.g., multiple tests with ACP or different percentile threshold for “low”).
Patterns in Figure 4 provide preliminary data suggesting these methods are sensitive to risk of subsequent cognitive impairment. It will be important to test these approaches in samples that contain enough persons who have progressed to dementia to have adequate statistical power to detect meaningful differences in risk of progressing to dementia between those who do and do not meet criteria for preclinical decline. Similarly, these approaches should be evaluated in large samples with sufficient biomarker positivity to evaluate the utility of conditional standards in the context of Jack and colleagues’ (Reference Jack, Bennett, Blennow, Carrillo, Dunn, Haeberlein and …Silverberg2018) amyloid/tau/neurodegeneration framework.
Our method is similar in some ways to earlier regression-based methods of identifying reliable change (Crawford et al., Reference Crawford, Garthwaite, Denham and Chelune2012; Maassen et al., Reference Maassen, Bossema and Brand2009). The major difference in the quantile regression approach is that it more naturally handles tests whose distributions cannot be expected to be normal, such as the MMSE (e.g., as in Cheung et al., Reference Cheung, Xu, Feng, Feng, Nyunt, Chong and … Ng2015), and situations in which relationships between predictors and outcomes varies by quantile, as may well be the case for age trajectories on cognitive tests.
When regression coefficients for the 50th percentile differ extensively from the lower percentiles, traditional regression-based methods will tend to over or under-identify abnormal performance. For example, in the Stroop Color unconditional models,
 $\beta _{{age}} $
was−.6 for the 50th percentile compared to−.06 for the 7th percentile. Similarly, in the TMT Part B conditional model, the
$\beta _{{age}} $
was−.6 for the 50th percentile compared to−.06 for the 7th percentile. Similarly, in the TMT Part B conditional model, the
 $\beta _{{TMTbaseline}} $
values for the two percentiles were 0.73 and 0.45, respectively. Future work will explore the relationship between these two methods on the same dataset to better understand the degree of overlap between them.
$\beta _{{TMTbaseline}} $
values for the two percentiles were 0.73 and 0.45, respectively. Future work will explore the relationship between these two methods on the same dataset to better understand the degree of overlap between them.
Our data suggest that the conditional standards may be sensitive to subjective changes in memory, a construct whose utility has been debated (Roberts et al., Reference Roberts, Clare and Woods2009). The existence of a modest relationship suggests that our approach has face validity, as both measures attempt to estimate cognitive change from some presumably healthy baseline. It is possible that our conditionally poor performers represent a mix of people who are aware of their deficit, and people whose decline is already advanced enough that they are experiencing anosognosia (Roberts et al., Reference Roberts, Clare and Woods2009; Vannini et al., Reference Vannini, Amariglio, Hanseeuw, Johnson, McLaren, Chhatwal and … Sperling2017).
Limitations and Future Directions
While promising, this work has limitations. Our analyses examining predictive validity were somewhat circular in nature, and also had very limited statistical power due to small numbers who had progressed to clinical endpoints in our sample. These standards reflect the performance of a single, non–population-based sample of highly educated, mostly white individuals on a limited range of tests. Our study protocol specifies use of AVLT Form 1 for all visits. Form 1 may be slightly easier than other AVLT forms although differences in average total scores across forms tend to be negligible (Hawkins, Dean, & Pearlson, Reference Hawkins, Dean and Pearlson2004). The 7th percentile threshold we specified for abnormality, while consistent with past conventional approaches, may not be the most useful for all contexts.
In addition, there may be information in either the relationship between concurrent ACP flags on different domains, or in the temporal sequencing of flags within a domain, which we have not explored in these data. Our technique shares with regression-based norms of the past the need for a large longitudinal dataset on which standards for a given test can be developed. Our use of a multiple-visit baseline limits the immediate clinical application of this technique, since ACP as we have defined it cannot be determined before a patient’s third clinic visit. The benefit of our approach is that it reduces spurious identification of patients whose apparent change represents regression toward the mean.
Finally, we caution that the conditional and unconditional standards presented here only capture test performance and thus should not be used in isolation. As always, clinical judgement is central to making any clinical or research diagnoses based on the totality of information available.
These limitations may be addressed in future analyses in one or more of the following ways. Data from multiple sources can be pooled to increase representativeness of standards and generate training and validation sets. To address issues of potential circularity between ACP tests and cognitive statuses, it will also be important to demonstrate that ACP on tests used to generate clinical diagnoses discriminate between low and high performance on cognitive tests not used in the diagnosis.
In future work, we will examine the usefulness and stability of conditional standards for the second visit. Future analyses will also explore additional operationalizations of preclinical decline using conditional and unconditional percentiles (e.g., using different percentile thresholds for defining significant change or low performance on a given test, using tallies of numbers of tests showing low performance or abnormal changes, etc.), to determine how best to leverage performance relative to the standards on multiple tests to create robust indicators of cognitive change or dementia risk.
CONCLUSIONS
In this study, we have presented application of quantile regression to development of unconditional and conditional (longitudinal) standards for performance on a variety of cognitive measures that are sensitive to cognitive decline associated with AD dementia. The graphical interface offers a clinically intuitive visualization of an individual’s cognitive performance across measures and over time and clearly identifies tests demonstrating potentially troubling within person change from baseline. Development of unconditional and conditional reference values for additional cognitive measures, investigation of alternative thresholds for abnormality (including multi-test criteria), and validation in samples with more clinical endpoints and biomarker data are needed to better understand how to operationalize preclinical declines on a trajectory toward AD and other dementias.
ACKNOWLEDGMENTS
This research was supported by the National Institutes of Health awards R01 AG027161, R01 AG021155, R01 AG054059, UL1 TR000427 and by donor funds including the Wisconsin Alzheimer’s Institute Lou Holland Fund. Portions of this research were supported by resources at the Wisconsin Alzheimer’s Institute, the Wisconsin Alzheimer’s Disease Research Center and the Geriatric Research Education and Clinical Center of the William S. Middleton Memorial Veterans Hospital, Madison, WI. Any opinions, findings, and conclusions or recommendations expressed in this material are those of the authors(s) and do not necessarily reflect the views of the NIH or the Veterans Administration. We gratefully acknowledge the WRAP study team who have carefully acquired the longitudinal data, and the WRAP participants who make this research possible. The authors of this manuscript have no conflicts of interest to report.
Supplementary material
To view supplementary material for this article, please visit https://doi.org/10.1017/S1355617718000929


