INTRODUCTION
Sports-related concussion (SRC) continues to be the most common form of mild traumatic brain injury (mTBI) in youth under the age of 19 (CDC, 2011; Bryan, Rowhani-Rahbar, Comstock, & Rivara, Reference Bryan, Rowhani-Rahbar, Comstock and Rivara2016). Among these high-impact sports with prevalence of SRC in high school athletes, American football is disproportionally represented (Gessel, Fields, Collins, Dick, & Comstock, Reference Gessel, Fields, Collins, Dick and Comstock2007; Guskiewicz, Weaver, Padua, & Garrett, Reference Guskiewicz, Weaver, Padua and Garrett2000). It has now been clearly documented that concussion, including SRC for football athletes, results in the rapid onset of a specific set of symptoms, including physical, cognitive, and behavioral symptoms (McCrea et al., Reference McCrea, Guskiewicz, Marshall, Barr, Randolph, Cantu and Kelly2003; McCrory et al., Reference McCrory, Meeuwisse, Aubry, Cantu, Dvorak, Echemendia and Sills2013). Clear diagnosis of SRC is made by trained medical professionals using self-report of symptoms and neurocognitive testing (McCrory et al., Reference McCrory, Meeuwisse, Aubry, Cantu, Dvorak, Echemendia and Sills2013), as no structural abnormalities are typically found on standard neuroimaging techniques (e.g., CT or structural MRI).
Studies have found that most athletes who have sustained an SRC report resolution of the majority of symptoms within 7 days (Lau, Collins, & Lovell, Reference Lau, Collins and Lovell2011; McCrea et al., Reference McCrea, Guskiewicz, Marshall, Barr, Randolph, Cantu and Kelly2003; McCrory et al., Reference McCrory, Meeuwisse, Aubry, Cantu, Dvorak, Echemendia and Sills2013). Nevertheless, there have been studies that emphasized increased risk for athletes with a history of SRC in regards to re-injury and memory and cognitive problems (e.g., Guskiewicz et al., Reference Guskiewicz, McCrea, Marshall, Cantu, Randolph, Barr and Kelly2003, Reference Guskiewicz, Marshall, Bailes, McCrea, Cantu, Randolph and Jordan2005).
Although still relatively novel, neuroimaging techniques could have the potential to inform better return-to-play guidelines, especially in youth athletes who have different recovery trajectories from adults (Toledo et al., Reference Toledo, Lebel, Becerra, Minster, Linnman, Maleki and Borsook2012). Resting state functional MRI (rs-fMRI) has specific advantages over certain limitations of task-based fMRI, namely task constraints and variability in participant performance (Greicius, Krasnow, Reiss, & Menon, Reference Greicius, Krasnow, Reiss and Menon2003; Raichle & Snyder, Reference Raichle and Snyder2007). The network that has been most extensively studied is the Default Mode Network (DMN; Raichle et al., Reference Raichle, MacLeod, Snyder, Powers, Gusnard and Shulman2001; Greicius et al., Reference Greicius, Krasnow, Reiss and Menon2003; Fox et al., Reference Fox, Snyder, Vincent, Corbetta, Van Essen and Raichle2005).
Whereas altered DMN activity has been shown in several neurological disorders (Broyd et al, Reference Broyd, Demanuele, Debener, Helps, James and Sonuga-Barke2009), only recently has rs-fMRI been used for assessment of recovery from SRC (Yuh, Hawryluk, & Manley, Reference Yuh, Hawryluk and Manley2014). Johnson et al. (Reference Johnson, Zhang, Gay, Horovitz, Hallett, Sebastianelli and Slobounov2012) assessed DMN connectivity in collegiate athletes (±10 days post-SRC) compared to control athletes and found hyperconnecvitiy of medial prefrontal cortex and hypoconnectivity of posterior cingulate and lateral parietal regions. Czerniak et al. (Reference Czerniak, Sikoglu, Navarro, McCafferty, Eisenstock, Stevenson and Moore2015) also assessed DMN rs-fMRI in collegiate athletes (mean of 112 days post-SRC) and compared to control athletes showed hyperconnectivity of anterior cingulate and dorsolateral prefrontal cortex. Lastly, Orr et al. (Reference Orr, Albaugh, Watts, Garavan, Andrews, Nickerson and Hudziak2016) assessed ice hockey players with and without a history of concussion (ranging from one to four previous concussions) and found hypoconnectivity of the DMN in the medial frontal cortex and hyperconnectivity in the precuneus and middle cingulate in athletes with a history of SRC compared to controls.
However, all of these studies assess athletes at one time point at varying times since SRC, making comparisons among them difficult. To our knowledge only one other study has used a longitudinal design to assess specifically rs-fMRI in SRC (Meier, Bellgowan, & Mayer, Reference Meier, Bellgowan and Mayer2017). They found local connectivity differences between athletes with SRC and controls, but no global connectivity differences both acutely and one month post-SRC. Given these variable findings, namely both hypoconnectivity and hyperconnectivity, further assessment of DMN disruption in younger ages and specific to SRC across time is extremely important for better assessing neural changes post-SRC.
In comparison to rs-fMRI, DTI has been a neuroimaging technique more commonly used in different populations with mTBI (Kamins et al., Reference Kamins, Bigler, Covassin, Henry, Kemp, Leddy and McLeod2017). Results from studies specifically assessing SRC show variable results, which is not surprising, as SRC has been suggested to be one of the mildest forms of mTBI with the greatest fluctuations and constellation of symptom presentation (Murugavel et al., Reference Murugavel, Cubon, Putukian, Echemendia, Cabrera, Osherson and Dettwiler2014). Results have included findings of both altered DTI parameters (Henry et al., Reference Henry, Tremblay, Tremblay, Lee, Brun, Lepore and Lassonde2011; Lancaster et al., 2016) and of no differences between participants with SRC and controls (Maugans, Farley, Altaye, Leach, & Cecil, Reference Maugans, Farley, Altaye, Leach and Cecil2012; Zhang et al., Reference Zhang, Johnson, Pennell, Ray, Sebastianelli and Slobounov2010). Studies assessing a single time point farther out from SRC have found altered DTI metrics at 2-months post-SRC in adolescents (Virji-Babul et al., Reference Virji-Babul, Borich, Makan, Moore, Frew, Emery and Boyd2013) and even greater than 6-months post-SRC in adults (Churchill, Caverzasi, Graham, Hutchison, & Schweizer, Reference Churchill, Caverzasi, Graham, Hutchison and Schweizer2017) when compared to control groups.
However, few studies have assessed longitudinal effects of altered DTI parameters in SRC. Lancaster et al. (2016) found acute differences in DTI metrics 24 hr after SRC that continued to become even more widespread by 8-days post-SRC. Murugavel et al. (Reference Murugavel, Cubon, Putukian, Echemendia, Cabrera, Osherson and Dettwiler2014) found similar acute differences, but at 2-weeks post-SRC found no differences in DTI metrics between college athletes with SRC and controls. Across these studies several white matter tracks have been implicated, including corpus callosum, corticospinal tract (CST), internal capsule, superior longitudinal fasciculus (SLF), and inferior longitudinal fasciculus (Gardner et al., Reference Gardner, Kay-Lambkin, Stanwell, Donnelly, Williams, Hiles and Jones2012, for review). These findings emphasize the need to study SRC separately from other forms of mTBI to assess DTI changes specific to athletes participating in youth sports.
Given the state of the current literature, much of the variability of fMRI and DTI findings in studies assessing SRC are due in part to different methodology and specific ROIs examined. With more novel multivariate methods that take a data-driven approach, further exploration into neurological changes in adolescents with SRC can be conducted to help with identification of brain regions and white-matter tracks differences while avoiding these potential biases. For rs-fMRI, our study uses a group independent component analysis (GICA) approach to identify spatially distinct, temporally correlated brain networks (Calhoun, Adali, Pearlson, & Pekar, Reference Calhoun, Adali, Pearlson and Pekar2001).
With regard to DTI data, we used a generalized q-sampling for fiber orientation estimation using a deterministic fiber tracking method (Yeh, Tang, & Tseng, Reference Yeh, Tang and Tseng2013). One of the advantages of using this technique is that it is less susceptible to partial volume effects, and is more accurate in assessing fibers in dense white-matter areas with multiple crossing fibers (Oouchi et al., Reference Oouchi, Yamada, Sakai, Kizu, Kubota, Ito and Nishimura2007; Yeh, Verstynen, Wang, Fernández-Miranda, & Tseng, Reference Yeh, Verstynen, Wang, Fernández-Miranda and Tseng2013). The advantage to our approach for analyzing rs-fMRI using GICA and group connectometry for DTI is both are data-driven approaches without the need for selecting a priori ROIs.
In the current study, we assessed male high school football players using complementary techniques in a prospective longitudinal design to investigate alterations in functional connectivity and white matter integrity due to SRC. We assessed both changes at the acute phase (time 1) and at 21 days later (time 2), as well as, differences between athletes with SRC and controls. In addition, we correlated these brain changes with cognitive performance using the Immediate Post-Concussive Assessment and Cognitive Testing (ImPACT) neurocognitive battery (Lovell, Reference Lovell2015). At the acute phase, we anticipated that the SRC group when compared to the control group would exhibit significant differences, both hypoconnectivity and hyperconnectivity, of DMN regions as well as disrupted diffusion using group connectometry. At time 2, we expected that the SRC group would no longer be reporting symptoms of SRC, nor evidence differences in DMN functional network or white matter connectivity relative to the control group. We predicted time 2 cognitive performance would return to baseline performance and be comparable to controls.
We investigated two competing hypotheses based on the variability of reported findings in the current literature: (1) continued disruption of the DMN network and more widespread diffusion differences in the SRC group (e.g., Dettwiler et al., Reference Dettwiler, Murugavel, Putukian, Cubon, Furtado and Osherson2014; Virji-Babul et al., 2014), or (2) resolution of neuroimaging changes with no differences between the SRC group and control group (e.g., Murugavel et al., Reference Murugavel, Cubon, Putukian, Echemendia, Cabrera, Osherson and Dettwiler2014).
MATERIALS AND METHODS
Participants
Thirty adolescent male football players (ages 14–18 years) were recruited from the Sports Medicine Department at Children’s Healthcare of Atlanta to participate in this study. Participants included 16 adolescents who had sustained a SRC and 14 adolescent controls who had never sustained a SRC. Each control participant was age-matched and from the same football team as the participant with SRC. The participants with SRC received a concussion diagnosis as determined by a sideline assessment by the athletic trainer during a football game. Criteria used included having a Glasgow Coma Scale (GCS) score of 13–15 as well as having less than 5 min of loss of consciousness. For the participants with SRC, imaging at time 1 was conducted within 7 days of the concussion and the participants endorsed at least two concussive symptoms at the time of the imaging scan (e.g., nausea, headache, dizziness, fatigue). Both the control group and SRC group were imaged twice, 21 days apart (time 2) with the same imaging parameters.
Participants were excluded from the study on the basis of inability to participate in the scan, such as having metal implanted in their bodies, and left handedness. All participants were screened using a background history questionnaire filled out by the primary caregiver and participants were excluded if they had ever been diagnosed with a seizure disorder or other neurological condition, attention deficit hyperactivity disorder, learning disability, intellectual disability, depression, anxiety, substance abuse, or Tourette’s/tic disorder.
There were two participants in the SRC group that had 1 prior concussion, and 1 participant with 2 prior concussions. No controls experienced any prior concussions. Two of the control participants had incidental findings on their neuroimaging scans and were excluded from the final analyses. One participant with SRC did not return to the time 2 imaging scan and so was excluded from the analyses comparing time 1 and time 2. One participant with SRC evidenced poor effort on the impulse control composite at time 2 and this score was excluded from analyses.
The final number of participants included in this study for imaging analyses was 16 participants with SRC (15 for time 2) and 12 control participants. It should be noted that not all control participants who participated in the imaging portion of the study returned for neurocognitive testing (see Table 1). All participants and their legal guardians provided written informed consent and/or assent, approved by the Georgia State University/Georgia Institute of Technology Joint Center for Advanced Brain Imaging Institutional Review Board, to participate in this study.
Table 1 Demographic information and ImPACT cognitive composite scores and total symptom score across all time points

Note. Between group analyses (statistic and p value) are shown for each demographic variable and ImPACT cognitive composite score and total symptom score.
WASI FSIQ=Wechsler Abbreviated Scale of Intelligence Full Scale Intelligence Quotient; SRC=Sports-related concussion; Verb. Mem.=ImPACT Verbal Memory Composite Score; Vis. Mem.=ImPACT Visual Memory Composite Score; Vis. Motor=ImPACT Visual Motor Speed Composite Score; RT=ImPACT Reaction Time Composite Score; Impulse=ImPACT Impulse Control Composite Score; TSS=ImPACT Total Symptom Score.
*p ≤.05.
**p ≤.01.
a Baseline ImPACT scores were acquired from the participants’ high school, and missing data are noted for four control participants.
b Time 1 and time 2 ImPACT scores were completed as part of the study, and missing data are noted from one control participant at time 1 and three control participants at time 2.
c One participant in the SRC group was excluded due to poor effort within the Impulse Control Composite at time 2.
MRI Data Acquisition
The MRI data were collected using a Siemens 3.0 Tesla Trio Scanner (Siemens Medical, Erlangen, Germany). In addition to routine localizer and calibration scans, the following MRIs were collected at time 1 and time 2: (1) clinical T2-weighted scan, (2) 3D T1-weighted anatomical scan, (3) rs-fMRI scan, and (4) diffusion tensor imaging (DTI) scan. The T2-weighted MRI was used to make sure that participants were able to hold still during the study, and along with T1 MRI, to verify that no structural abnormalities were present. T1-weighted scans were acquired using a four-echo (TE=1.74, 3.6, 5.46, 7.32 ms) 3D MPRAGE (Magnetization Prepared Rapid Gradient Echo) sequence with TR=2530 ms, FA=7°, and isotropic 1mm spatial resolution. rs-fMRI images were acquired using a single-shot T2*-weighted gradient-echo EPI pulse sequence with the following acquisition parameters: repetition time (TR)=2130 ms, echo time (TE)=30 ms, flip angle (FA)=90, and resolution=3×3×3 mm3. A total of 192 volumes were acquired for the rs-fMRI scan, resulting in a total scan time of roughly 7 min for the series.
The DTI data were acquired using a 30-direction (plus 5 b=0 volumes) diffusion weighted spin echo EPI sequence with the following imaging parameters: TR=9200 ms, TE=95 ms, isotropic 2 mm spatial resolution, and b=1000 s/mm2. Additionally, a b=0 volume with the same acquisition parameters as the DTI data but opposing phase encoding polarities was also acquired to help correct distortions induced by susceptibility.
Data Preprocessing
Functional images for the rs-fMRI scan were preprocessed using Statistical Parametric Mapping (SPM12) software (Wellcome Department of Cognitive Neurology, London, UK). Slice-timing correction was applied to the data. Images were then motion corrected, spatially normalized to standard MNI brain space, and spatially smoothed using a 3D Gaussian kernel of 8 mm full-width half-maximum (FWHM). The normalized and smoothed images were then low bandpass filtered to between 0.008 and 0.08 Hz.
To address potential confounds and control for motion artifacts, excessive head motion was labeled as greater than .2 mm with deviation being calculated using the Euclidean distance from the six rigid-body motion parameters for two consecutive time points. Based on this criterion, for all of the remaining participants, less than 10% of their total number of volumes exceeded the movement threshold. As such, all participants were included in subsequent analyses. Additional correction for head motion is described below.
Diffusion data were preprocessed using FMRIB Software Library (FSL; version 5.0.6). After converting data from dicom to nifti, susceptibility induced distortions were corrected in the DTI data using the TOPUP tool of FSL. TOPUP was conducted using a separate b0 acquisition with reversed direction of the phase gradient, this was combined with a b0 acquisition from the complete diffusion set to generate the TOPUP distortion map. The complete DTI data were then corrected for distortion, head motion and eddy current induced distortion. Motion correction of the image was performed by applying an affine transform of each diffusion volume to the b0 volume and rotating the b-vectors.
Group Independent Component Analysis
The fMRI Group ICA Toolbox (GIFT; icatb.sourceforge.net, version 1.3e) was used to conduct GICA on both the control participants and the participants with SRC combined (n=28), and for the SRC group at both time 1 and at time 2 (n=31). Component analyses are combined in this way as to provide unbiased selection of components not overly weighted by any one group/time point. GICA was conducted in three main steps using the preprocessed data detailed above: (1) each participant’s data were reduced using principal component analysis, (2) ICA was then applied to the entire data set at the group level, and (3) then each individual participant’s time courses were back reconstructed to derive an individual level spatial map and time course for each component (Calhoun et al., Reference Calhoun, Adali, Pearlson and Pekar2001; Calhoun, Kiehl, & Pearlson, Reference Calhoun, Kiehl and Pearlson2008).
Stability analysis was conducted using ICASSO to estimate reliability of components and using this, unstable components were eliminated, defined by over 10 iterations of the ICA algorithm. A total of 20 independent components were estimated for control and SRC groups at time 1, and for SRC group at time 1 and time 2 using minimum descriptive length criteria (Li, Adali, & Calhoun, 2007). Components were then visually inspected for artifacts, including activation patterns indicative of eye movements or head motion, and activation primarily in the ventricles or white matter with well-established, previously validated guidelines (Griffanti et al., Reference Griffanti, Douaud, Bijsterbosch, Evangelisti, Alfaro-Almagro, Glasser and Beckmann2017). Specific to head motion artifacts, this technique has been shown to be as robust as other traditional techniques (e.g., spike regression or motion scrubbing) in removing motion artifacts from rs-fMRI data (Pruim, Mennes, Buitelaar, & Beckmann, Reference Pruim, Mennes, Buitelaar and Beckmann2015).
Dynamic range and low/high frequency ratio graphs are provided in supplementary material (Supplementary Figure S1, S2). The surviving components were then spatially correlated with the DMN. We used a spatial map based on the anatomical regions identified as being core nodes within the DMN. These included the medial prefrontal cortex, ventral anterior cingulate cortex, posterior cingulate cortex, inferior parietal lobules, angular guyrus, and precuneus (Fox et al., Reference Fox, Snyder, Vincent, Corbetta, Van Essen and Raichle2005; Greicius et al., Reference Greicius, Krasnow, Reiss and Menon2003; Raiche et al., 2001). Four components were identified as having a correlation value over 0.3 (see Supplementary Figure S3).
For each participant, individual subject component maps for four components were transformed to Z scores and then entered into SPM12. GIFT uses Pearson’s correlation coefficients and conversion to Z scores was conducted using the Fisher transform, and then contrasted between conditions using the Students t test. A series of two-sample t tests were conducted: SRC group contrasted with control group at both time 1 and time 2. Paired t tests were conducted to compare the SRC group at time 1, during the acute SRC phase, to time 2, when SRC symptoms should have resolved. We corrected for multiple comparisons using a false discovery rate (FDR) cluster correction of p<.05.
Correlation With ImPACT Scores
To further examine the relationship between neural correlates of SRC recovery, we examined the relationship between functional connectivity and performance on the Immediate Post-Concussive Assessment and Cognitive Testing (ImPACT) neurocognitive battery (Lovell, Reference Lovell2015). The ImPACT assesses neurocognitive functioning using five composite scores, measuring verbal memory, visual memory, visual-motor coordination, impulse control, and reaction time, and total symptom score (TSS). The performance on the ImPACT for these five component scores and TSS was examined for changes over three time points (Baseline pre-SRC, Time 1, and Time 2).
Diffusion Connectometry Approach
To assess differences in diffusion MRI data between the control and SRC group connectometry analyses were conducted using DSI Studio (http://dsi-studio.labsolver.org). A generalized Q-ball imaging (GQI) reconstruction into common stereotactic space was performed on the diffusion dataset for each participant (Yeh Wedeen, & Tseng, Reference Yeh, Wedeen and Tseng2010). A diffusion sampling length ratio of 1.25 was used, and the output resolution was 2 mm. Diffusion MRI group connectometry (Yeh, Badre, & Verstynen, Reference Yeh, Badre and Verstynen2016) was conducted separately to compare group differences between (1) control group vs. SRC group at time 1, (2) control group vs. SRC group at time 2, and (3) SRC group at time 1 vs. time 2. A deterministic fiber tracking algorithm (Yeh, Verstynen et al., Reference Yeh, Tang and Tseng2013) was conducted to connect the fiber directions using exploratory whole brain parameters. A length threshold of 40 mm was used to select tracks, with seeding density of 1 seed per mm3 across the whole brain. To estimate the FDR, a total of 2000 randomized permutations were applied to the group label to obtain the null distribution of the track length. These results yielded the selected segments within a track that were statistically different between the two groups.
RESULTS
Behavioral Results on the ImPACT
Paired t tests within the SRC group revealed significant lower performance at time 1 compared to time 2 for verbal memory (t(13)=−3.93; p=.002) and visual memory (t(13)=−2.62; p=.021). No other differences were found between time 1 and time 2. In addition, performance at time 2 improved to baseline performance across visual memory, visual-motor coordination, impulse control, and reaction time (all p’s>.2). Verbal memory performance was actually better at time 2 than at baseline (t(13)=−2.37; p=.034) (Table 1).
Independent t tests to assess between group differences revealed the SRC group at time 1 showed significantly lower performance than the control group on verbal memory (t(25)=2.45; p=.022) and visual memory (t(25)=2.89; p=.008). The SRC group also endorsed a greater number of symptoms (TSS) at time 1 compared to the control group (p=.01). No significant differences were found between the control group and SRC group at time 2 (Table 1). Given these results, only verbal memory and visual memory correlations with functional connectivity results are reported here. We also assessed correlations between imaging data and TSS, which were not significantly correlated with imaging data at time 1 or time 2. We conducted additional exploratory analyses to determine if there were any other significant correlations between imaging data and ImPACT composite scores, even though there were no behavioral differences between the control group and SRC group for these measures. Results were only seen with one other composite score, visual-motor coordination (see Supplementary Table S1).
GICA Results: Control Group Compared to SRC Group
Comparing the DMN components between the control and SRC groups at time 1 revealed reduced functional connectivity in the SRC group compared to the control group (control>SRC) in the right inferior frontal gyrus (IFG), middle frontal gyrus (MFG), middle temporal gyrus (MTG), and posterior cingulate. Hyperconnectivity in the SRC group (SRC<control) was predominately seen in posterior regions, including left cerebellum and precuneus, and right middle occipital gyrus (MOG). No differences were found between the control and SRC groups at time 2 (Table 2; Figure 1).
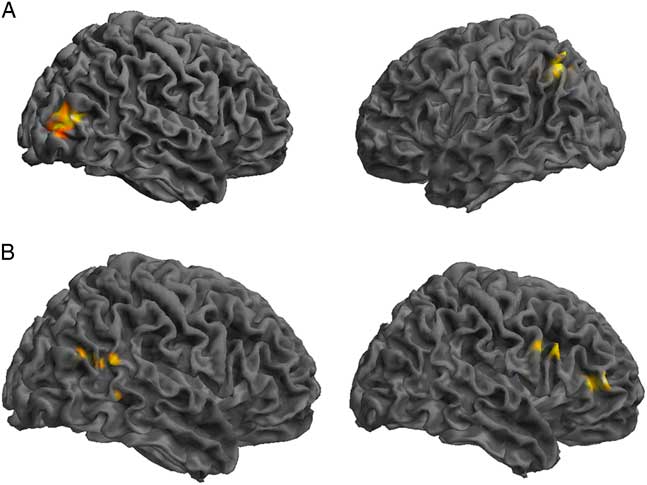
Fig. 1 Significant differences in rs-fMRI functional connectivity between the SRC group and the control group at time 1. (A) Greater connectivity and (B) reduced connectivity in the SRC group compared to the control group. (A) Shown: right MOG and left precuneus; Not shown: left cerebellum. (B) Shown: right IFG, MFG, MTG, posterior cingulate.
Table 2 Differences at time 1 between the control group and the SRC group within the DMN component derived using GICA, in which greater functional connectivity in the SRC group is indicated by SRC>Control, and reduced functional connectivity in the SRC group is indicated by SRC<Control
L=left hemisphere; R=right hemisphere; BA=Brodmann area; MOG=middle occipital gyrus; IFG=inferior frontal gyrus; MFG=middle frontal gyrus; MTG=middle temporal gyrus.
GICA Results: SRC Group Post-concussion Over Time
Assessment of the SRC group at time 1 (acute phase of SRC) compared to time 2 (when SRC symptoms should be resolved), revealed greater functional connectivity in the DMN components at time 1 compared to time 2 within the right IFG, MTG, precentral gyrus, and angular gyrus (AG), and left lingual gyrus, MFG, and middle cingulate gyrus (MCG). Decreased connectivity at time 1 compared to time 2 was found within the left anterior prefrontal cortex and MOG (Table 3; Figure 2).
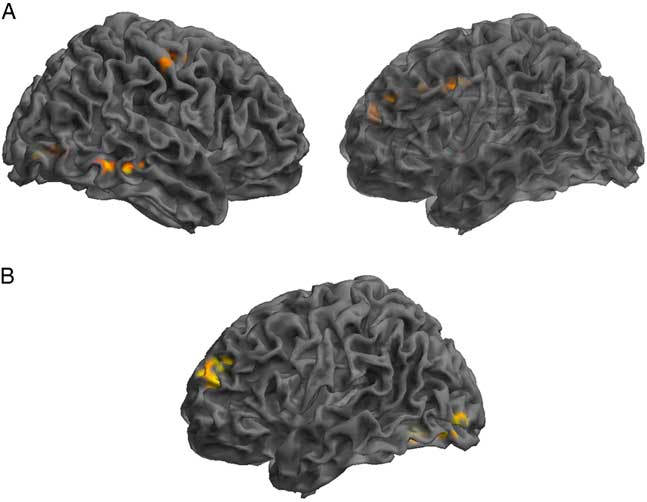
Fig. 2 Significant changes in functional connectivity from time 1 to time 2 in the SRC group. (A) Greater connectivity and (B) reduced connectivity in the SRC group from time 1 to time 2. (A) Shown: right MTG, right precentral, left lingual gyrus, left MFG, left middle cingulate; Not shown: right angular gyrus. (B) Shown: left anterior PFC and MOG.
Table 3 Changes across time within the DMN component derived using GICA, assessing SRC group at time 1 compared to time 2

Time 1>Time 2 indicating brain regions with greater functional connectivity at time 1 compared to time 2 and Time 1<Time 2 indicating reduced functional connectivity at time 1 compared to time 2.
L=left hemisphere; R=right hemisphere; BA=Brodmann area; MOG=middle occipital gyrus; IFG=inferior frontal gyrus; MFG=middle frontal gyrus; MTG=middle temporal gyrus; PFC=prefrontal cortex.
Multiple regression analyses were performed within the SRC group at time 1 and time 2 to assess correlations between functional connectivity and performance on visual and verbal memory composites of the ImPACT. At time 1, significant positive correlations were found between the DMN components and performance on verbal memory for right MCG, postcentral gyrus, and lingual gyrus, and bilateral inferior parietal lobule. A positive relationship was also found for visual memory in the right MTG. No significant negative correlations were seen at time 1. At time 2, a significant negative correlation was with verbal memory for the right vermis, left superior parietal lobule and superior frontal gyrus (SFG). A negative correlation was found with verbal memory for the right IPL. Visual memory at time 2 was also negatively correlated with the DMN components within the left lingual gyrus and right MFG (Table 4; Figure 3).
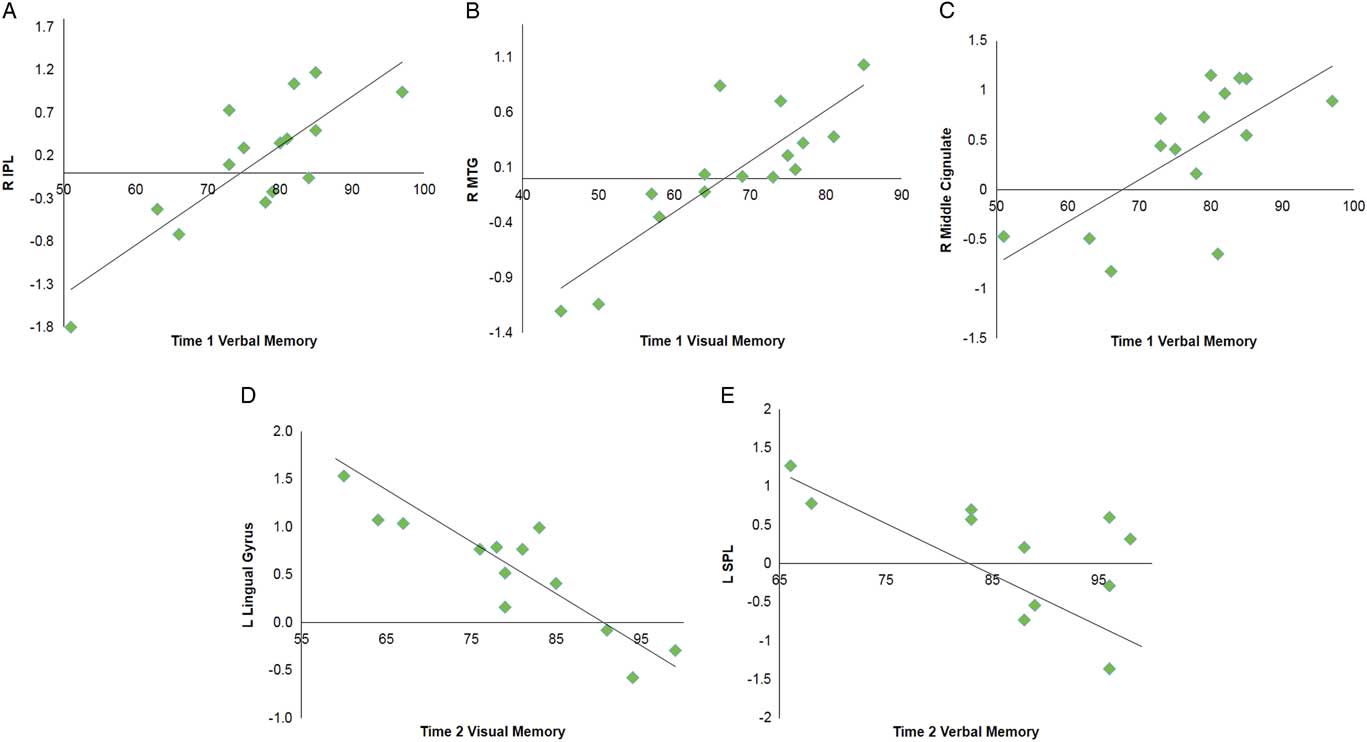
Fig. 3 Selected graphs showing correlations between select brain regions and verbal and visual memory composite scores on the ImPACT at time 1 (A–C) and time 2 (D,E). In all graphs, y-axis indicates functional connectivity Z scores for the labeled brain region, and x-axis indicates performance score on the labeled ImPACT measure, with higher scores indicative of better performance. R, right hemisphere; L, left hemisphere; IPL, inferior parietal lobule; MTG, middle temporal gyrus; SPL, superior parietal lobule.
Table 4 Multiple regression analyses within the SRC group for time 1 and time 2 separately to assess correlations between DMN component functional connectivity and performance on verbal memory and visual memory composites of the ImPACT
A positive correlation indicates better performance on ImPACT measures is associated with functional connectivity in these brain regions, and negative correlation indicates poorer performance on ImPACT measures is associated with functional connectivity in these brain regions.
L=left hemisphere; R=right hemisphere; BA=Brodmann area; MFG=middle frontal gyrus; MTG=middle temporal gyrus; IPL=inferior parietal lobule; SPL=superior parietal lobule; SFG=superior frontal gyrus.
Exploratory multiple regression analyses were performed within the control group at time 1 and time 2 to assess correlations between functional connectivity and behavioral performance for those of which ImPACT testing was available (n=11 at time 1 and n=9 at time 2). Results revealed no significant correlation between functional connectivity and any ImPACT composite scores or TSS at either time 1 or time 2.
Diffusion Group Connectometry Results
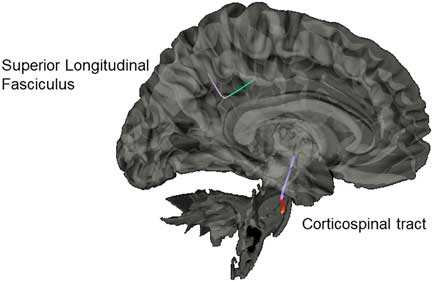
Results from the connectometry analyses revealed significant differences in isotropic diffusion between the control and SRC groups at time 1, with the SRC group showing increased isotropic value of the diffusion orientation density function along a segment of the CST (FDR=0.20) and the SLF (FDR=0.27; Figure 4). No significant correlations were found between neurocognitive performance on the ImPACT or TSS and diffusion metrics. No significant differences were seen between the control group and the SRC group at time 2.

Fig. 4 Significant difference in isotropic diffusion between the control group and SRC group at time 1, with the SRC group showing greater diffusivity in the corticospinal tract and the superior longitudinal fasciculus compared to the control group.
DISCUSSION
We investigated neural changes in adolescent football players at the acute phase of SRC (time 1) and at 21 days later (time 2) using complementary neuroimaging techniques. Our study used a GICA and one of the advantages of this approach is that our selected components are intrinsically organized networks that correlated with DMN regions, but also represented outside regions as well. Results revealed greater connectivity within posterior brain regions (e.g., precuneus, MOG, and cerebellum), and decreased connectivity in more anterior areas (e.g., IFG, MFG, MTG) when comparing the groups at time 1. Robust findings of hyperconnectivity were found in the left precuneus. Research suggests that the precuneus is the key node of the DMN that mediates intrinsic connectivity across all other nodes of the DMN (Fransson & Marrelec, Reference Fransson and Marrelec2008) and is involved in a range of cognitive tasks requiring self-referential processing (Buckner & Carroll, Reference Buckner and Carroll2007).
Additional evidence is provided by our exploratory analysis, which also revealed changes specific to altered connectivity of the precuneus and correlations with visual-motor coordination in the SRC group across time. Other posterior regions, including the cerebellum, are involved in sensorimotor and motor planning aspects of cognition (Manto et al., Reference Manto, Bower, Conforto, Delgado-García, da Guarda, Gerwig and Molinari2012). Along with the cerebellum’s role in high-order executive functioning as well (Koziol, Budding, & Chidekel, Reference Koziol, Budding and Chidekel2012), the cerebellum has also been shown to be sensitive to effects of SRC (Guskiewicz, Ross, & Marshall, Reference Guskiewicz, Ross and Marshall2001).
To our knowledge, only one other study has longitudinally assessed rs-fMRI in SRC (Meier et al., Reference Meier, Bellgowan and Mayer2016), finding similar results, with posterior regions showing increased regional connectivity compared to decreased regional connectivity of frontal regions across time. Similar to other studies assessing athletes with a history of multiple SRC, hyperconnectivity was seen in posterior regions, including cerebellum and MOG (Churchill, Hutchison, Leung, Graham, & Schweizer, Reference Churchill, Hutchison, Leung, Graham and Schweizer2017; Orr et al., Reference Orr, Albaugh, Watts, Garavan, Andrews, Nickerson and Hudziak2016). Overall, our hyperconnectivity results combined with positive correlations between rs-fMRI connectivity and verbal and visual memory performance at time 1 provide support for the hypothesis that increased activity in these areas may be an initial compensatory mechanism to maintain neurocognitive performance with peers without a history of mTBI (Czerniak et al., Reference Czerniak, Sikoglu, Navarro, McCafferty, Eisenstock, Stevenson and Moore2015).
Decreased activation in anterior frontal regions implicated in executive functioning has been well documented in task-based fMRI studies of SRC (Kamins et al., Reference Kamins, Bigler, Covassin, Henry, Kemp, Leddy and McLeod2017; Keightley et al., Reference Keightley, Singh Saluja, Chen, Gagnon, Leonard, Petrides and Ptito2014). Of interest, the frontal and temporal regions that were found to have decreased connectivity in the SRC group, are regions that are typically thought to be part of active cognition, which is anticorrelated with the DMN (Fox et al., Reference Fox, Snyder, Vincent, Corbetta, Van Essen and Raichle2005). This is counter to what some other studies have found, with hyperactivation of frontal regions and reduced activation of posterior regions using rs-fMRI paradigms (Czerniak et al., Reference Czerniak, Sikoglu, Navarro, McCafferty, Eisenstock, Stevenson and Moore2015; Iraji et al., Reference Iraji, Benson, Welch, O’Neil, Woodard, Ayaz and Liu2015; Johnson et al., Reference Johnson, Zhang, Gay, Horovitz, Hallett, Sebastianelli and Slobounov2012; Mayer, Mannell, Ling, Gasparovic, & Yeo, Reference Mayer, Mannell, Ling, Gasparovic and Yeo2011). However, these studies assessed different mTBI populations across various time points.
Our study provides additional evidence for the hypothesis posited in other studies of global alteration in rs-fMRI at the acute phase of SRC. Specifically, reduced connectivity within frontal and temporal regions during the acute recovery period may be a way for reallocation of increased connectivity within posterior regions (Orr et al., Reference Orr, Albaugh, Watts, Garavan, Andrews, Nickerson and Hudziak2016). As such, there are likely multiple resting state networks that are recruited along with the DMN in a global manner when there is disruption of cognitive balance between resting-state and task-positive networks during the acute phase of SRC (Stevens et al., Reference Stevens, Lovejoy, Kim, Oakes, Kureshi and Witt2012).
Memory measures on the ImPACT were most sensitive to differences between adolescents with and without SRC. Particularly noteworthy are the positive correlations between the memory scores and bilateral IPL (including supramarginal gyrus) at time 1. The IPL is a well-known component of the frontal-parietal network involved in sustained attention modulation necessary for working memory (Smith & Jonides, Reference Smith and Jonides1998). Additionally, neuroimaging studies have implicated disruption of IPL in SRC (Jantzen, Anderson, Steinberg, & Kelso, Reference Jantzen, Anderson, Steinberg and Kelso2004; Keightley et al., Reference Keightley, Singh Saluja, Chen, Gagnon, Leonard, Petrides and Ptito2014). Hillary and Grafman (Reference Hillary and Grafman2017) postulate that DMN hubs, of which IPL is a primary hub (the authors use graph theory analyses and refer to hubs as “rich-club nodes”), are functionally hyperconnected to the other network regions after brain injury to overcome network disruption.
While this may be adaptive in the short-term, such as allowing the individuals with SRC to function largely within normal limits, there is likely a trade-off between excessive metabolic demand of these primary “rich-club” hubs and risk of longer-term damage to these regions (Hillary & Grafman, Reference Hillary and Grafman2017). As such, specific to our results, hyperconnectivity of the DMN regions, including IPL, at time 1 suggests an initial compensation for the SRC group to maintain memory performances. Nevertheless, the SRC group continued to remain significantly different from controls with regards to performance at time 1. At time 2, cognitive performance on the ImPACT for the SRC group was not significantly different than controls and behavioral performance in the SRC group had returned to baseline performance. Nevertheless, a positive correlation with IPL remained at time 2, suggesting that the IPL is at risk for chronic hyperactivity as it continues to compensate for network disruption of the DMN. Yet at time 2, negative correlations with both frontal (e.g., SFG, MFG) and posterior (e.g., vermis, lingual gyrus) regions were also seen.
Additionally, results correlating visual-motor coordination and rs-fMRI also fit this pattern, with precuneus, another DMN hub, differentially being recruited at time 1 and time 2. Taken together, these negative correlation findings are consistent with resource allocation theory in that those individuals with increased activity in these regions showed decreased performance on memory measures. Johnson et al. (Reference Johnson, Zhang, Gay, Horovitz, Hallett, Sebastianelli and Slobounov2012) suggested that altered resting state activity post-SRC was related to dysfunction of long-distance connections between frontal and occipital cortices as seen in other neurological and neurodevelopmental clinical populations.
As such, a subsample of our SRC group who continue to have lower performance on memory measures at time 2 may be showing altered allocation of these longer anterior to posterior functional connections. This more nuanced profile of both compensatory mechanisms (activity associated with adequate performance) and resource allocation (activity associated with impaired performance) requires further examination over time, as long-term hyperconnectivity of regions may lead to detrimental hypoconnectivity and more permanent neuropathological changes in the future (Hillary & Grafman, Reference Hillary and Grafman2017).
Our group connectometry analysis revealed disrupted diffusion within the CST and the SLF at time 1 in the SRC group compared to the control group. The CST and SLF have been consistently found to be altered in mTBI, and negatively correlated with clinical measures of severity of injury (e.g., Glasgow Coma Scale; Gardner et al., Reference Gardner, Kay-Lambkin, Stanwell, Donnelly, Williams, Hiles and Jones2012). Disruption of diffusion of the CST acutely post-SRC is hypothesized to be due to compressed intracellular space along the CST due to local inflammation and cytotoxicity (Henry et al., Reference Henry, Tremblay, Tremblay, Lee, Brun, Lepore and Lassonde2011; Virji-Babul et al., Reference Virji-Babul, Borich, Makan, Moore, Frew, Emery and Boyd2013).
With regard to the SLF, our results indicate the utility of the GQI approach to being more sensitive to dense white matter areas with crossing fibers, as our results indicated differences in a directional change of the SLF. This identified segment is part of the posterior portion of the SLF as it bends inferiorly from frontal lobe projections toward the tempo-parietal junction, and then branches to project toward the IPL, specifically the supramarginal gyrus. This is a centrally localized junction of several other white-matter tracks as well, including the arcuate fasciculus and posterior cingulum. This area has been reported in other studies to be particularly vulnerable to the linear (i.e., coup- contrecoup) injury and rotational forces that can damage the integrity of the crossing fibers in this dense area (Cubon, Putukian, Boyer, & Dettwiler, Reference Cubon, Putukian, Boyer and Dettwiler2011; Churchill, Caverzasi, Graham, Hutchison, & Schweizer, Reference Churchill, Caverzasi, Graham, Hutchison and Schweizer2017).
Overall our diffusion results are in line with our rs-fMRI results, which found specific positive correlations between cognitive performance and rs-fMRI within the IPL (including supramarginal gyrus) at time 1 and time 2. It is likely that activity in the IPL, in addition to negative modulation of frontal regions (SFG, MFG), may reflect disruption of white matter tracks between these regions known to be vulnerable to injury.
There are limitations to this study that are worth noting. We choose to limit the focus of the type of SRC to increase the internal validity and reduce potential confounds that may lead to other plausible interpretations; however, with that methodologic rigor, the study is unable to generalize to other SRC populations or those with multiple concussions. In addition, although we used a well-matched control group, it is plausible that given the relatively new studies assessing the impact of subconcussive events on football players that some of our healthy control participants may have experienced an unknown subconcussive event. However, even with this possibility, we found robust differences between groups. Therefore, we may have found even more robust findings with a non-football or athletic control group.
One study assessing football players compared to non-contact sports athletes have found hyperconnectivity of the DMN in football players who report no history of SRC (Abbas et al., Reference Abbas, Shenk, Poole, Breedlove, Leverenz, Nauman and Robinson2015). Nonetheless, these are important findings to understanding the potential impact of subconcussive events on the brain in youth contact sports. As such, future research should assess multiple groups (athletes with SRC, contact sport athletes, and non-contact sport athletes) to determine the extent of neural differences among these groups. Another limitation is that given our modest sample size, we may not have been able to detect smaller effects or interactions. Additionally, given the smaller sample size of control participants on the ImPACT composite scores at time 2, this may limit our ability to detect changes between groups. However, the ability to follow these carefully screened groups longitudinally with cognitive performance and complementary advanced neuroimaging techniques contributed to the literature in a meaningful way.
In sum, our study has extended our understanding of the effects of SRC in an adolescent male population on neural functional connectivity and white matter integrity. Acute effects of SRC were associated with hyperconnectivity of posterior regions and hypoconnectivity of anterior regions, with diffusion differences in the SLF and CST. In addition, tasks involving memory were the most sensitive to these changes. Within 1 month of SRC, adolescents with SRC on average return to baseline and do not show differences in either rs-fMRI or diffusion data when compared to age- and team-matched controls. However, continued risk of chronic hyperconnectivity of these regions could place adolescents with SRC at greater risk for secondary neuropathological changes, emphasizing the need to follow these athletes across the lifespan. Our study also demonstrated the utility of using exploratory multivariate analyses using data-driven whole-brain approaches, which is especially important given the heterogeneous nature of SRC.
ACKNOWLEDGMENTS
This research was supported by a grant from the Georgia State University/Georgia Institute of Technology Joint Center for Advanced Brain Imaging (CABI) Seed Grant (PIs TZK & TB). We thank Dr. Susan McManus and Dr. Ana Arenivas for their valuable help with data collection and Dr. Ryan Brewster and the King Developmental Neuropsychology Across the Lifespan Research Team for their data scoring and data management. RB was supported by the GSU Second Century Initiative (2CI) Fellowship in Human Neuroimaging. The authors declare no conflict of interest.
Supplementary material
To view supplementary material for this article, please visit https://doi.org/10.1017/S1355617718000413