INTRODUCTION
Executive functions (EFs) are mental processes which control both our thoughts and behavior (Alvarez & Emory, Reference Alvarez and Emory2006; Fuster, Reference Fuster2000; Miyake & Friedman, Reference Miyake and Friedman2012). Miller and Cummings (Reference Miller and Cummings2007) presented a comprehensive construct of EFs which describes actions involved in volitional and physical activities. Researchers have agreed on three core EFs (Diamond, Reference Diamond2013; Lehto, Juujarvi, Kooistra, & Pulkkinen, Reference Lehto, Juujarvi, Kooistra and Pulkkinen2003; Miyake & Friedman, Reference Miyake and Friedman2012; Miyake et al., Reference Miyake, Friedman, Emerson, Witzki, Howerter and Wager2000): inhibition, working memory, and cognitive flexibility.
Pathological changes of EFs are called a dysexecutive syndrome (DS). DS is a part of the clinical picture in many neurological and psychiatric disorders and can be differentiated into cognitive and behavioral components (Godefroy et al., Reference Godefroy, Azouvi, Robert, Roussel, LeGall and Meulemans2010). Typically, the syndrome is present in neurodegenerative diseases (Barulli et al., Reference Barulli, Fontana, Panza, Copetti, Bruno, Tursi and Simone2015; Duke & Kaszniak, Reference Duke and Kaszniak2000), after a stroke (Leskela et al., Reference Leskela, Hietanen, Kalska, Ylikoski, Pohjasvaara, Mantyla and Erkinjuntti1999) or trauma (Caeyenberghs et al., Reference Caeyenberghs, Leemans, Leunissen, Gooijers, Michiels, Sunaert and Swinnen2014), in schizophrenia (Evans, Chua, McKenna, & Wilson, Reference Evans, Chua, McKenna and Wilson1997), or depression (Austin, Mitchell, & Goodwin, Reference Austin, Mitchell and Goodwin2001). The present study is based on prior research, and we use the term “frontal” as a neuroanatomical location with “executive” as a term relating to EFs and their impairment (Kudlicka, Clare, & Hindle, Reference Kudlicka, Clare and Hindle2011; Stuss & Alexander, Reference Stuss and Alexander2000).
A progressive decline of EFs is usually seen after the seventh decade of life in cognitively healthy adults, especially a decrease in focused attention, inhibition, planning, and cognitive flexibility (Turner & Spreng, Reference Turner and Spreng2012). Jurado and Rosselli (Reference Jurado and Rosselli2007) supposed that the decrease is proportional to increasing age. An evaluation of DS seems to be of significant importance considering the influence of EFs on everyday life (Bezdicek, Stepankova, Martinec Novakova, & Kopecek, Reference Bezdicek, Stepankova, Martinec Novakova and Kopecek2016; Lau, Parikh, Harvey, Huang, & Farias, Reference Lau, Parikh, Harvey, Huang and Farias2015).
Given the heterogeneity of EFs, there are several tests that assess these functions (Lezak, Howieson, Bigler, & Tranel, Reference Lezak, Howieson, Bigler and Tranel2012). However, in clinical practice, it is hard to find standardized tests that evaluate EFs which are not at the same time too time-consuming or difficult to administer. Dubois, Slachevsky, Litvan, and Pillon (Reference Dubois, Slachevsky, Litvan and Pillon2000) designed a 5-min battery of tests, the Frontal Assessment Battery (FAB), to assess cognitive and behavioral DS. The administration of the FAB is quick since it only lasts approximately 5 min. However, its psychometric properties are highly dependent on demographic factors such as age and education (Appollonio et al., Reference Appollonio, Leone, Isella, Piamarta, Consoli, Villa and Nichelli2005; Asaadi et al., Reference Asaadi, Ashrafi, Omidbeigi, Nasiri, Pakdaman and Amini-Harandi2016; Benke, Karner, & Delazer, Reference Benke, Karner and Delazer2013; Kim et al., Reference Kim, Huh, Choe, Jeong, Park, Lee and Woo2010), and the FAB has also low to moderate internal consistency, coefficients of Cronbach’s alpha in published normative studies ranged from .46 to .80 (Appollonio et al., Reference Appollonio, Leone, Isella, Piamarta, Consoli, Villa and Nichelli2005; Benke et al., Reference Benke, Karner and Delazer2013; de Paula et al., Reference de Paula, Moura, Bocardi, Moraes, Malloy-Diniz and Haase2013; Dubois et al., Reference Dubois, Slachevsky, Litvan and Pillon2000; Kim et al., Reference Kim, Huh, Choe, Jeong, Park, Lee and Woo2010; Lima, Meireles, Fonseca, Castro, & Garrett, Reference Lima, Meireles, Fonseca, Castro and Garrett2008). Concurrent validity of the FAB was indicated by high correlations between the total score of the FAB and the Wisconsin Card Sorting Test (Dubois et al., Reference Dubois, Slachevsky, Litvan and Pillon2000), the Trail Making Test part A and B, and semantic verbal fluency tests (Kim et al., Reference Kim, Huh, Choe, Jeong, Park, Lee and Woo2010; Lima et al., Reference Lima, Meireles, Fonseca, Castro and Garrett2008).
The evaluation of EFs seems to be especially relevant in Parkinson ̓s disease (PD) since typical motor disturbance commonly occurs concurrently with varied levels of cognitive impairment (Bott et al., Reference Bott, Johnson, Schuff, Galifianakis, Subas, Pollock and Possin2014; Kudlicka et al., Reference Kudlicka, Clare and Hindle2011). Mild cognitive impairment in Parkinson ̓s disease (PD-MCI) is heterogeneous, commonly characterized by a frontostriatal DS, which can be manifested together with memory or visuospatial impairment (e.g., Bronnick, Reference Bronnick2010; Williams-Gray et al., Reference Williams-Gray, Mason, Evans, Foltynie, Brayne, Robbins and Barker2013; Yarnall et al., Reference Yarnall, Breen, Duncan, Khoo, Coleman, Firbank and Burn2014). Recently, the International Parkinson and Movement Disorder Society (IPMD-S) has presented diagnostic criteria for the evaluation of PD-MCI, but the FAB was not included in Level I as an official screening instrument (Litvan et al., Reference Litvan, Goldman, Troster, Schmand, Weintraub, Petersen and Emre2012).
Previous studies confirm the FAB is sensitive to DS in PD without dementia as well as in PD-MCI (Biundo, Weis, et al., Reference Biundo, Weis, Pilleri, Facchini, Formento-Dojot, Vallelunga and Antonini2013; Lima et al., Reference Lima, Meireles, Fonseca, Castro and Garrett2008); however, none of these studies used IPMD-S PD-MCI criteria at Level II (the gold standard) and did not comprehensively compare PD-MCI patients to PD patients without cognitive deficits (PD-NC). Of note is that Biundo, Weis, et al. (Reference Biundo, Weis, Pilleri, Facchini, Formento-Dojot, Vallelunga and Antonini2013) included a group of PD-NC in their study whereas Lima et al. (Reference Lima, Meireles, Fonseca, Castro and Garrett2008) did not which may be considered as a disadvantage regarding a comprehensive psychometric analysis of Level I instruments. However, clinically, the most relevant comparison is between PD-NC and PD-MCI (Litvan et al., Reference Litvan, Goldman, Troster, Schmand, Weintraub, Petersen and Emre2012; Pirogovsky et al., Reference Pirogovsky, Schiehser, Litvan, Obtera, Burke, Lessig and Filoteo2014). These shortcomings build a rationale for undertaking the current study: the FAB is not included in Level 1 IPMD-S criteria in despite being confirmed as a sensitive tool to screen the executive dysfunction in PD-MCI, and the present study wants to establish the fact further.
Furthermore, neuroimaging findings of structural and functional correlates of the FAB in PD are scarce. A single-photon emission computed tomographic perfusion study with the frontal variant of frontotemporal dementia found a significant correlation between the FAB performance and perfusion in the medial and dorsolateral frontal cortex bilaterally, independently of age, gender, and Mini-Mental State Examination (MMSE) (Guedj et al., Reference Guedj, Allali, Goetz, Le Ber, Volteau, Lacomblez and Dubois2008). In Alzheimer’s disease and MCI, patients with low FAB scores have significant hypoperfusion in the left middle frontal gyrus and the right superior frontal gyrus (Kume et al., Reference Kume, Hanyu, Murakami, Sato, Hirao, Kanetaka and Iwamoto2011; Oshima et al., Reference Oshima, Terada, Sato, Ikeda, Nagao, Takeda and Uchitomi2012). Recently, a cortical thickness study found a wide spectrum of cognitive deficits in PD-MCI and related them to significant regional thickening in the right parietal-frontal as well as in the left temporal-occipital areas (Biundo, Calabrese, et al., Reference Biundo, Calabrese, Weis, Facchini, Ricchieri, Gallo and Antonini2013). However, a brain imaging study that would allow further investigation of local differences in gray matter (GM) in relation to the FAB performance in PD is so far missing. This approach could further underpin the relation of the FAB to morphological changes in PD and PD-MCI, respectively (Segura et al., Reference Segura, Baggio, Marti, Valldeoriola, Compta, Garcia-Diaz and Junque2014).
The aim of the present study is, therefore, three-fold. First, we aimed at investigating the discriminative properties and classification accuracy of the FAB in Level I. Second, we assessed possible morphological correlates of the FAB in PD with and without MCI. Third, we provide normative data for cognitively healthy Czech adults to be able to determine and minimize the considerable influence of age and education on the FAB performance.
METHOD
Participants
Normative participants (NP) were recruited from the general community through advertisements (non-random sampling), and a brief medical history for each subject was obtained via telephone. A cohort of 339 healthy subjects was included (Table 1). The interviews excluded participants with a history of head trauma, loss of consciousness, cerebrovascular accidents, abuse of alcohol or other psychoactive substances, and individuals with a history of neurological or psychiatric disease or ongoing delirium. Additionally, we excluded persons currently undergoing radio- or chemotherapy, with a major medical condition (myocardial infarction, diabetes mellitus, etc.), or sensory deficits.
Table 1 Characteristics of the normative participants (N=339)
Note. FAB=Frontal Assessment Battery total score (0–18 points); FAB1=first subtest; FAB2=second subtest; FAB3=third subtest; FAB4=fourth subtest; FAB5=fifth subtest; FAB6=sixth subtest; n.s.=non-significant.
* Non-significant after Bonferroni correction.
Participants meeting the above criteria were then tested for cognitive performance using the MMSE, for manifestations of depression using the Beck Depression Inventory, Second Edition (BDI-II), and instrumental activities of daily living (IADL) using the Functional Activities Questionnaire (FAQ) (Bezdicek et al., Reference Bezdicek, Stepankova, Martinec Novakova and Kopecek2016). The exclusion criteria for subjects with cognitive impairment were set on the MMSE at <25 points, that is, below the 16th percentile according to Czech normative values (Štěpánková et al., Reference Štěpánková, Nikolai, Lukavský, Bezdíček, Vrajová and Kopeček2015). To exclude subjects with a higher level of depression, the BDI-II score was limited at ≥13, and with respect to impaired IADL, the FAQ cutoff was set at >4 (Bezdicek, Lukavsky, & Preiss, Reference Bezdicek, Lukavsky and Preiss2011; Bezdicek et al., Reference Bezdicek, Stepankova, Martinec Novakova and Kopecek2016).
The clinical samples consisted of patients with PD-MCI (n=32) and PD-NC (n=41; Table 2). From the pool of NP demographically matched control samples (CS) of an equal sample size were selected to patients with PD for group comparisons. We also evaluated all PD-NC (n=41) in our clinical sample and compared them to PD-MCI (n=32). All clinical subjects were recruited non-randomly from the Movement Disorders Center, Department of Neurology, First Faculty of Medicine, and General University Hospital in Prague. All PD patients were examined by a neurologist specialized in movement disorders and met the United Kingdom PD Society Brain Bank criteria (Hughes, Daniel, Kilford, & Lees, Reference Hughes, Daniel, Kilford and Lees1992).
Table 2 Characteristics of the clinical and control samples

Note. M=mean; SD=standard deviation; CS PD-NC=control sample for Parkinson’s disease without cognitive impairment; CS PD-MCI=control sample for Parkinson’s disease with mild cognitive impairment; n.s.=non-significant; PD=Parkinson’s disease; FAB=Frontal Assessment Battery; MMSE=Mini-Mental State Examination; UPDRS-III=Unified Parkinson’s Disease Rating Scale Part III.
*p-Value for CS PD-NC vs. PD-NC.
† p-Value for CS PD-MCI vs. PD-MCI.
Exclusion criteria were as follows: PD dementia according to IPMD-S criteria (Emre et al., Reference Emre, Aarsland, Brown, Burn, Duyckaerts, Mizuno and Dubois2007), atypical or secondary parkinsonism, severe or unstable depression, with florid psychotic manifestations (hallucinations or delusions), anticholinergic medications, and other medical or neurological conditions potentially resulting in cognitive impairment (e.g., seizure, stroke or head trauma). L-dopa equivalent daily dose for each patient were calculated (Table 2) (Tomlinson et al., Reference Tomlinson, Stowe, Patel, Rick, Gray and Clarke2010). All PD patients were examined in the “on” motor state.
Only a portion of patients and controls administered with the FAB underwent an MRI examination. Therefore, the sample included in the voxel-based morphometry (VBM) analysis consists of 37 patients and 31 controls. Eight patients and four controls were not included in the final group of subjects due to a change in diagnosis (one subject with multiple system atrophy), missing neuropsychiatric data, severe vascular lesions, significant atrophy, or severe motion artefacts affecting the quality of the MRI images, which yielded a final sample of 29 patients with PD (13 women, 16 men, age: 65.90±6.6 years) and 27 controls (14 women, 13 men, 66.3±4.8 yeaars). Sixteen PD patients fulfilled PD-MCI criteria (see the Materials section and Table 2), the rest (PD-NC, n=13 + CS, n=27), that is, 40 subjects were without cognitive impairment. The cutoff for EF impairment in the FAB was <16 (the same as in ROC analysis, Tables 3 and 4).
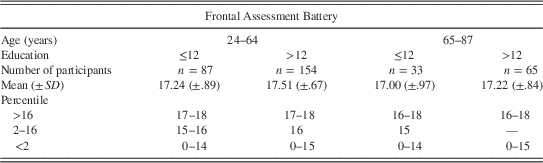
Table 3 Normative data for the Frontal Assessment Battery according to age and education

Note. SD=standard deviation. Percentile values were rounded to an integer.
Table 4 Results for selected cutoff scores of the FAB test

Note. FAB=Frontal Assessment Battery; PD-MCI=Parkinson’s disease with mild cognitive impairment; CS=control sample for Parkinson’s disease with mild cognitive impairment; PD-NC=Parkinson’s disease without cognitive impairment.
a The cutoff with maximum combined sensitivity and specificity.
b The cutoff for the FAB test as a screening test.
The study was approved by the ethics committee of the General University Hospital in Prague, and all participants provided signed informed consent. All neuropsychological tests were administered under standard neuropsychological laboratory conditions and were conducted by trained psychologists.
Materials
The patients underwent a comprehensive clinical examination that included a medical history, medication status, evaluation of functional abilities, and motor status by the Unified Parkinson’s Disease Rating Scale Part III (UPDRS-III) and standard IPMD-S Level II neuropsychological assessment for the diagnosis of PD-MCI (Litvan et al., Reference Litvan, Goldman, Troster, Schmand, Weintraub, Petersen and Emre2012). Level II (comprehensive assessment) consisted of 10 tests in five cognitive domains, one measure from each test was derived as recommended (Table 3): (1) attention and working memory (Digit Span backward from the Wechsler Adult Intelligence Scale, Third Revision (WAIS-III) and Trail Making Test-A) (Bezdicek et al., Reference Bezdicek, Moták, Axelrod, Preiss, Nikolai, Vyhnálek and Růžička2012; Wechsler, Reference Wechsler1999); (2) EF (semantic fluency (animals, clothes, shopping) and Tower of London) (Michalec et al., Reference Michalec, Bezdicek, Nikolai, Harsa, Jech, Silhan and Shallice2017; Nikolai et al., Reference Nikolai, Michalec, Bezdíček, Štěpánková, Marková and Kopeček2015; Shallice, Reference Shallice1982); (3) language (Boston Naming Test Czech version and WAIS-III Similarities) (Goodglass & Kaplan, Reference Goodglass and Kaplan1983; Wechsler, Reference Wechsler1999; Zemanová et al., Reference Zemanová, Bezdíček, Michalec, Nikolai, Roth, Jech and Růžička2016); (4) memory (Rey’s Auditory Verbal Learning Test and Brief Visuospatial Memory Test, Revised delayed recall) (Benedict, Reference Benedict1997; Bezdicek et al., Reference Bezdicek, Stepankova, Motak, Axelrod, Woodard, Preiss and Poreh2014) and (5) visuospatial function (CLOX and Judgment of Line Orientation) (Benton, Hamsher, & Sivan, Reference Benton, Hamsher and Sivan1994; Royall, Cordes, & Polk, Reference Royall, Cordes and Polk1998). Level II was applied as the gold-standard for the classification of PD-MCI and PD-NC and CS, and this classification was used for the determination of the discriminative validity of the FAB based on the ROC analysis.
The FAB test consists of six subtests which are administered in a particular order. A total score of the FAB may vary from 0 to 18 points as each subtest can be evaluated by a maximum of 3 points. First two subtests focus on the cognitive part of EFs, and other four subtests on the behavioral part. The subtests were translated into Czech (FAB-Cz) and then translated back into English, and were administered and scored as proposed in the original publication by Dubois et al. (Reference Dubois, Slachevsky, Litvan and Pillon2000).
MRI Acquisition and Image Processing
Magnetic resonance images were obtained with a 3 Tesla MR scanner (Magnetom Skyra, Siemens, Germany). For VBM analysis a T1-weighted MRI data set of the whole brain with a resolution of 1×1×1 mm3 was acquired using a sagittal 3D-MPRAGE (magnetization prepared rapid gradient echo) sequence with repetition time (TR)=2.2 s, echo time (TE)=2.43 ms, inversion time=900 ms, matrix=224×224 and flip angle=8°. In addition, the T2-weighted sequence with TR=3.2 s, TE=9 ms, resolution=0.9×0.9×3 mm were done to rule out significant brain pathological changes. Image pre-processing was performed using the CAT12 toolbox (www.neuro.uni-jena.de/cat12) and SPM12 (www.fil.ion.ucl.ac.uk/spm) in MATLAB 2015b environment (MathWorks, Nattick, MA). Images were normalized to Montreal Neurological Institute space, segmented, and modulated followed by smoothening using a Gaussian filter of 8 mm full-width at half-maximum. After pre-processing the data quality was checked using both “Check sample homogeneity” tool and quality parameters report in CAT12.
Statistical Analyses
The analyses were performed using IBM SPSS 20.0. Considering the non-normal distribution of the FAB data, we used nonparametric statistics. The association between the total FAB score performance and age and years of education was evaluated by a Spearman’s rho and by a point-biserial correlation for gender. Based on the results, we divided NP into two age (24−64 and 65−84 years of age) and educational (≤12 years and >12 years of education) cohorts and the differences between cohorts in the total FAB scores as well as in each subtest were calculated by the Mann-Whitney U test. The influence of significant demographical variables on the total FAB score was further analyzed using a stepwise regression analysis. We studied the internal consistency of the FAB’s six subtests using Cronbach’s alpha. To analyze differences in the FAB performance between participants with PD and healthy ones, and between PD-MCI and PD-NC, we ran Mann-Whitney U tests. Subsequently, to show the discriminative validity of the FAB test, we calculated a size of the area under the receiver operating characteristic curve (AUC), and values combined a maximum of sensitivities and specificities. α ≤.05 was adopted for statistical significance. For multiple comparisons, we used the Bonferroni method.
Voxel-based whole-brain statistical analyses were performed with the Statistical non-Parametric Mapping (SnPM) software (http://warwick.ac.uk/snpm), which provides a framework for non-parametric permutation and randomization tests using the General Linear Model and pseudo t-statistics. The number of permutation in our analyses was fixed to 5000. Group differences in GM density (all PD vs. CS; PD with FAB<16 vs. CS; PD with FAB ≥16 vs. CS; and PD with the FAB<16 vs. PD with the FAB ≥16) were assessed in four models using two-sample t test design. In addition, we performed an F test to investigate the amount of variance explained by the model (PD with FAB<16; PD with FAB≥16; and CS) in relation to the remaining variance of the error term. Total intracranial volume and age were entered in each design matrix as confounding factors. The results were reported using the peak-level threshold p<.001 and corrected for multiple comparisons on the cluster level (Family-Wise Error, p<.05).
Significant clusters were visualized using MRIcroGL (http://www.mccauslandcenter.sc.edu/mricrogl/) onto the T1-weighted image-specific template derived as a mean of T1-weighted skull-stripped and normalized images of all patients and control subjects which were acquired during the pre-processing procedure using CAT 12. Finally, Spearman’s non-parametric correlations regardless of groups were used to examine the relationship between GM density and the FAB score in the voxel of maximum contrast PD with FAB<16 versus CS.
RESULTS
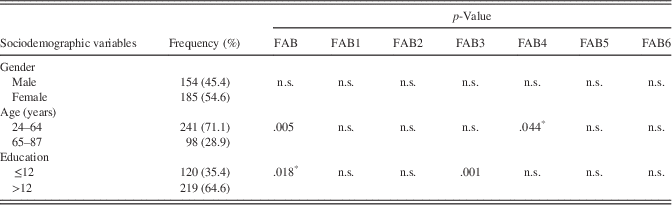
Socio-demographic data of NP are presented in Table 1. None of the clinical variables, such as PD duration (years), PD onset (years), UPDRS-III “on” state, Hoehn/Yahr stage, L-dopa equivalent correlated significantly with the FAB (Table 2). A significant correlation was found between the total FAB score performance and age (p=.013) and years of education (p=.008) and no significant influence on gender. Differences in the total FAB score and each subtest between the two age groups and the two educational groups are displayed in Table 1. In regression analysis, it was shown that education and age are significant predictors of performance in the FAB (p<.05); however, they accounted for 4.1% of the variability.
To calculate internal consistency of the FAB the sixth subtest was removed as all normative participants passed that item. Afterward, the internal consistency coefficient was α=.60. We provided normative data of the FAB according to age and education showing average performance (>16th percentile), slightly impaired (2−16th percentile; from −1 SD to −2 SD), and severely impaired performance (<2nd percentile; below 2 SD), see Table 3.
Significant differences were found between-groups differences in the patients’ total FAB score. PD-MCI was significantly different from CS and PD-NC from CS (Table 2). Moreover, the analysis revealed a distinction in the total FAB score between PD-MCI and PD-NC: U=240, p<.001 and in the MMSE performance: U=423, p=.008. However, those groups did not significantly differ in age, p=.056, or in years of education, p=.103. The AUC showed the value of .90 (95% confidence interval [CIs] [.81, .98]), p<.001 for PD-MCI vs. CS and the value of .82 (95% CI [.71, .92]), p<.001 for PD-MCI versus PD-NC. The values of sensitivities and specificities for selected cutoff scores are listed in Table 4. If the cutoff ≤16 points was established to differentiate PD-MCI from controls and PD-NC, positive predictive value of the total FAB score was 60% (95% CI [44.33%, 74.30%] and negative predictive value of the total FAB score was 82.14%; 95% CI [63.11%, 93.94%]. However, the optimal clinical cutoff for the differentiation of PD-NC from PD-MCI was <16 (Table 4).
In the VBM analysis, PD sample (n=29) was associated with a significantly lower FAB score in comparison with CS (n=27) (U=135; p=.00001). The FAB<16 had 19 PD, but only 1 CS. Contrasting PD (n=29) versus CS (n=27), the PD group showed several areas of significantly decreased density, including the right rectus gyrus, the medial orbital gyrus, the precuneus, and broad areas of occipital and parietal lobes with a slight right-hemispheric predominance (Table 5; Figure 1A). Interestingly, in contrast to CS, PD with the FAB≥16 (n=10) showed lower GM density only in parietal-occipital lobes, whereas PD with <16 (n=19) had lower GM density specifically in ventromedial and orbital prefrontal areas bilaterally with right-hemispheric predominance (Figures 1B and C; Table 5). In addition, using an F test to investigate the amount of variance explained by the model (PD with the FAB<16; PD with the FAB ≥16; and CS) in relation to the remaining variance of the error term, we found a significant amount of variance in the same regions as observed by the comparisons between both groups of patients and healthy controls.
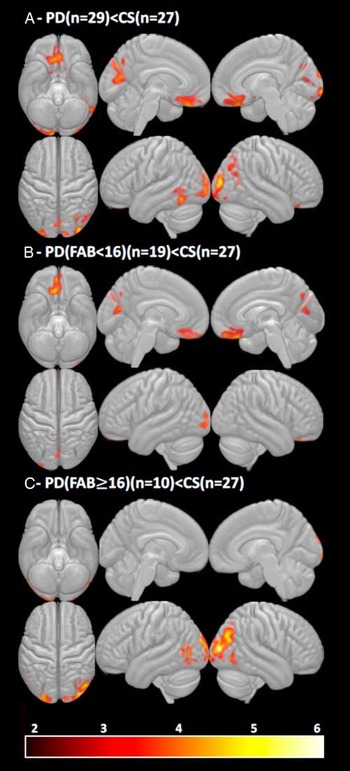
Fig. 1 (A) Significant contrasts between PD (n=29) versus CS (n=27), (B) PD with FAB<16 (n=19) versus CS (n=27), (C) PD with FAB≥16 (n=10) versus CS (n=27); corrected FWE<.05 at the cluster level. Note. FAB=Frontal Assessment Battery; PD=Parkinson’s disease patients; CS=control sample.
Table 5 Differences in grey matter density between PD and CS.
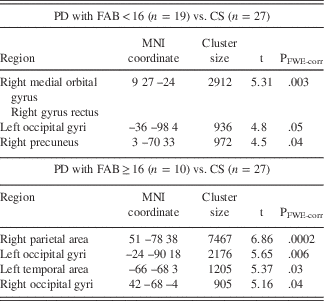
Note. FAB=Frontal Assessment Battery; PD=Parkinson’s disease patients; CS=control sample; MNI=Montreal Neurological Institute coordinate system (x, y, z coordinates represent peak voxels in whole brain analysis); PFWE-corr=corrected at cluster level. Local maxima from the different contrasts highlighting gray matter differences between the groups, obtained using voxel-based morphometric analysis.
Analysis within PD groups (PD with the FAB<16 vs. PD with the FAB≥16) did not show significant results after FWE correction on the cluster level. However, in the prefrontal region of interest based on group analysis between PD with the FAB<16 and CS (maximum at x=9, y=27, z=−24), the FAB score significantly correlated with GM density in all subjects together (PD+CS) regardless of group status (Spearman’s rho=.50; p<.0001; Figure 2).
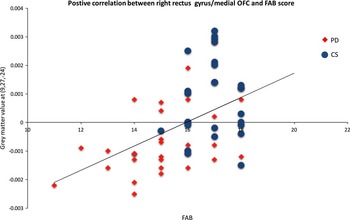
Fig. 2 A correlation of the FAB and gray matter density regardless of group status (PD=29 patients, CS=27 subjects). Note: Lower FAB score correlated with lower gray matter density in the gyrus rectus/right medial OFC (Spearman rho=.50, p<.0001). Voxel peak was based on group analysis between PD with FAB<16 and CS (maximum at x=9, y=27, z=−24). PD=patients with Parkinson’s disease; CS=control sample; OFC=orbitofrontal cortex.
DISCUSSION
The present study provides complex evidence about the Czech normative standards, validity and classification accuracy and morphological correlates of the FAB. We see that the FAB is significantly related to age and education but not gender. However, the proportion of variability in the FAB explained by these variables is rather small (less than 5%) and is lower than what is observed in other normative studies (Benke et al., Reference Benke, Karner and Delazer2013). We suppose that these findings are due to a wider age span (our normative sample is younger than the Austrian).
Furthermore, the FAB has for its simplicity a clear ceiling effect, which probably limited the influence of age on the FAB performance. The Austrian normative data (50–95 years of age) are older, and the ceiling effect was, therefore, not so pronounced. However, we suppose that normative data based on younger age groups (below 50 years of age) are also important for comparisons with the performance of patients with frontal lobe lesions, which are highly variable regarding age.
The diagnostic accuracy of the FAB based on AUC in differentiating PD-MCI from CS is high overall (>80% classification accuracy for both comparisons), thus outlining its high discriminative validity. It should be noted that the FAB was not a part of the classificatory algorithm used for determining PD-MCI, it was the neuropsychological battery at Level II to circumvent circularity in diagnostic decision making and criterion contamination. Level II is regarded as the “gold standard” for diagnostics of PD-MCI, and the reported AUC level is sufficiently conclusive to propose the FAB as a standard screening instrument for Level I in the assessment of PD-MCI.
These results so far are not reflected by current PD-MCI criteria (Litvan et al., Reference Litvan, Goldman, Troster, Schmand, Weintraub, Petersen and Emre2012). Moreover, the FAB is the least time-consuming among other PD-MCI screening instruments (such as the Parkinson’s Disease-Cognitive Rating Scale, the SCales for Outcomes in PArkinson’s disease-COGnition, Montreal Cognitive Assessment or Mattis Dementia Rating Scale). To strengthen the claim that the FAB is a reliable clinical tool, we add that it is less affected by the clinical variables (there were no correlations between the FAB and disease duration, Hoehn/Yahr stage or age of onset of PD). The average time of administration is between 4 and 5 min. For bedside diagnostic procedures to differentiate a patient with PD-MCI from PD-NC, we would recommend a cutoff<16 points. The finding that the FAB is, so far, the least time-consuming screening instrument with very high classification accuracy for PD-MCI in comparison to PD-NC gives the FAB an advantage over other Level I instruments and underlines its role in the cognitive assessment of PD (Litvan et al., Reference Litvan, Goldman, Troster, Schmand, Weintraub, Petersen and Emre2012).
Previous research indicated that the MoCA is a more sensitive instrument than the MMSE for the detection of PD-MCI (Hoops et al., Reference Hoops, Nazem, Siderowf, Duda, Xie, Stern and Weintraub2009; Nazem et al., Reference Nazem, Siderowf, Duda, Have, Colcher, Horn and Weintraub2009). The present study supports the previous finding by comparing the FAB with the MMSE when the latter one did not discriminate between CS and PD-NC and discriminated (but worse than FAB) between CS and PD-MCI. As a result, the MMSE cannot be equally predictive of PD-MCI status (in comparison to the FAB). Of note, the internal consistency of the FAB as a scale is questionable, underlining its brevity, heterogeneous items, and composition. We would not, therefore, recommend using the FAB as the sole instrument for delineating cognitive impairment in PD, rather as a brief screening measure for bedside assessment.
To underpin our behavioral data, we also assessed the brain GM differences in PD and CS relating to the FAB score. We observed that PD was associated with widespread atrophy in frontal, occipital, and parietal brain areas (Figure 1A). These findings are in agreement with studies showing similar changes in cognitively preserved or MCI patients (Uribe et al., 2016; Biundo, Calabrese, et al., Reference Biundo, Weis, Pilleri, Facchini, Formento-Dojot, Vallelunga and Antonini2013). Although we did not get significant differences between PD subgroups (PD with FAB<16 vs. PD with FAB≥16), likely due to small number of samples, group analyses of PD versus CS and PD with FAB<16 versus CS suggested that a lower FAB score might be specifically related to lower GM density in the right ventromedial prefrontal cortex and precuneus (Figures 1A and B; Table 5).
Such results would be consistent with the large body of evidence showing that both areas represent a highly complex and high degree brain hubs that that play a key role in decision-making, executive and memory functions (Bechara & Van Der Linden, Reference Bechara and Van Der Linden2005; Roy, Shohamy, & Wager, Reference Roy, Shohamy and Wager2012; Zhang & Li, Reference Zhang and Li2012). Moreover, our observation is further supported by the fact that across a range of neurodegenerative disorders these brain areas are often associated with pronounced structural or functional changes as well as cognitive deterioration (Baggio et al., Reference Baggio, Segura, Sala-Llonch, Marti, Valldeoriola, Compta and Junque2015; Buckner et al., 2009; Utevsky, Smith, & Huettel, Reference Utevsky, Smith and Huettel2014).
However, when comparing CS and PD with the FAB≥16, another the difference in posterior GM was present. This finding is potentially important as it shows that the GM difference between PD patients without executive impairment and CS cannot solely be attributed to levels of executive or cognitive functioning and might suggest at least two neurodegeneration patterns of PD with different progression. Therefore, we might speculate that early atrophy and neurodegeneration affecting ventromedial prefrontal cortex might predict not only a lower FAB (<16) score but also a faster cognitive decline in comparison with the group of patients with predominant volumetric changes in parietal-occipital areas and FAB≥16. This view is very close to “dual syndrome models” of cognitive function in PD (Kehagia, Barker, & Robbins, Reference Kehagia, Barker and Robbins2010, Reference Kehagia, Barker and Robbins2013).
The current study has several limitations. First, our normative data suffer from a lack of observations in very old people (85+); thus, we would not recommend their use above this age in clinical settings. Second, the PD and CS sample sizes were relatively small and unequal for VBM analysis, which limits our calculations and the generalization of the results. Moreover, we also did not use other possible approaches, such as cortical thickness estimation and white matter connectivity, which may bring further results related to the FAB (Hutton et al., Reference Hutton, Draganski, Ashburner and Weiskopf2009). However, this study was not primarily focused on structural neuroimaging correlates of the FAB. A larger sample size and longitudinal study may have improved detection of changes below significance. Finally, a further longitudinal study would also answer the question as to whether a lower FAB score (FAB<16) is associated with a poorer prognosis regarding cognitive and postural functions.
In conclusion, our study delineated FAB’s high discriminative validity for PD-MCI and proposed this instrument for its high classification accuracy as the new Level I screening measure for the detection of PD-MCI.
ACKNOWLEDGMENTS
The authors thank all participants for their willingness to take part in the present study. Ethical standards: The present research has been approved by the appropriate institutional board and ethics committee of General University Hospital and has, therefore, been performed in accordance with the ethical standards laid down in the 1964 Declaration of Helsinki. All persons gave their informed consent before their inclusion in the study. Disclosures: This study was supported by Charles University, PROGRES Q27 and PROGRES Q06/LF1; from the Czech Science Foundation (“Cognitive Predictors of Neurodegeneration”, grant number 16-01781S) and (“Micro- and macro-connectomics of the STN nucleus,” grant number 16-13323S). The authors report no conflicts of interest. The authors declare that there are no disclosures to report. The authors have no financial interests in the Frontal Assessment Battery Czech version.