INTRODUCTION
Huntington's Disease (HD) is an autosomal dominant, neurodegenerative disorder resulting from an expansion of the trinucleotide CAG repeat in the gene Htt coding for the protein huntingtin (The Huntington's Disease Collaborative Research Group, 1993). The genetic expansion leads to selective degeneration of basal ganglia structures, primarily the caudate and putamen, although the exact pathophysiologic mechanism of neurodegeneration is not well understood (The Huntington's Disease Collaborative Research Group, 1993). HD is characterized by a triad of clinical symptoms: chorea, cognitive decline, and personality changes (Roos et al., 1991). The diagnosis of HD, also referred to as the onset of “manifest HD,” generally coincides with the appearance of choreiform movements. The age of onset of manifest HD is partially correlated with CAG repeat length (Brinkman et al., 1997). CAG length, coupled with the at risk individual's current age, can be used to calculate the number of years to estimated onset (YEO) of manifest HD (Aylward et al., 1996; Langbehn et al., 2004). The period prior to diagnosis is commonly referred to as the preclinical HD (pre-HD) phase.
Numerous neuropsychological studies conducted on pre-HD individuals have demonstrated deficits in psychomotor speed (Campodonico et al., 1996; Paulsen et al., 2001; Paulsen et al., 2006a) and executive function (Campodonico et al., 1996; Lawrence et al., 1998; Paulsen et al., 2001), along with personality change, characterized by elevated rates of suicide (Paulsen et al., 2005; Paulsen et al., 2006a) and depression (Paulsen et al., 2006a). These neuropsychological changes can occur in pre-HD individuals as many as 9 (Campodonico et al., 1996), 11 (Lawrence et al., 1998), and 15 (Paulsen et al., 2006a) YEO. In addition, longitudinal studies have shown that cognitive performance worsens as individuals approach onset of manifest disease (Campodonico et al., 1996; Paulsen et al., 2001).
Several neuroimaging studies have examined structural brain changes in pre-HD individuals as a function of YEO. Cross-sectional MRI morphometric studies have demonstrated a significant reduction in striatal volume as early as 7 (Aylward et al., 1994; Aylward et al., 1996; Aylward et al., 2004) to 15 (Paulsen et al., 2006a) YEO. The rate of striatal atrophy increases significantly beginning 11 YEO (Aylward et al., 2004). Recent studies of pre-HD individuals found regionally specific cortical thinning (Rosas et al., 2005) and loss of gray matter (Thieben et al., 2002), suggesting that cortical changes can occur in the preclinical phase; these studies did not relate their findings to YEO. Paulsen et al. (2006b), however, found no evidence of cortical atrophy in pre-HD individuals less than 14 YEO, but did identify an abnormal thickening of cortical gray matter in individuals more than 18 YEO, suggesting that neural development in pre-HD individuals may be aberrant.
Resting functional neuroimaging studies have shown reduced striatal glucose metabolism (Feigin et al., 2001) and striatal hypoperfusion (Harris et al., 1999; Reynolds, Jr. et al., 2002) in pre-HD individuals. The Harris et al. study (1999) observed a reduction in striatal blood flow in the absence of striatal atrophy in pre-HD individuals more than 7 YEO, suggesting that functional brain changes may precede cell loss. More recently, task-activated functional neuroimaging studies have examined differences in neural activation patterns in pre-HD individuals. Using fMRI and an interference task, Reading et al. (2004) observed reduced neural activation in pre-HD individuals relative to control subjects in the left anterior cingulate; this difference occurred in the absence of group differences in task performance. No estimate of YEO was provided for their sample.
We conducted an fMRI study on pre-HD individuals (Paulsen et al., 2004) using a time discrimination (TD) task previously shown to activate corticostriatal circuitry in healthy adults (Rao et al., 2001). The TD task requires the participant to judge whether an interval of time is longer or shorter in duration than a standard interval (1200 ms). Pre-HD individuals >12 YEO exhibited a decrease in caudate activation, but they also demonstrated a larger spatial extent of activation in the pre-supplementary motor area (preSMA) and cingulate motor area (CMA) relative to healthy controls. This pattern of neural activation was observed in the absence of task performance deficits or striatal atrophy. In contrast, pre-HD individuals <12 YEO demonstrated generalized reduction in the spatial extent of activation both within the striatum and cortex; in addition, this group exhibited atrophy of the striatum and impairment on the TD task relative to healthy controls. We speculated that cortical fMRI hyperactivation in pre-HD individuals >12 YEO may serve as a compensatory mechanism for early striatal dysfunction.
The current pre-HD fMRI study extends our previous investigation (Paulsen et al., 2004) in four fundamental directions. First, we wished to determine if another temporal information processing task, time reproduction (TR), would also demonstrate sensitivity to early HD neuropathology. The TR task requires participants to tap their index finger in synchrony to an auditory metronome with a fixed inter-stimulus interval, typically less than a second. The synchronization phase is immediately followed by discontinuation of the auditory pacing stimulus and instructions to continue tapping at the same rate without benefit of the metronome (i.e., continuation phase). We have previously shown in an fMRI study of healthy adults that the TR task activates a corticostriatal circuit specifically involving the putamen and SMA proper (Rao et al., 1997). Behavioral studies using this task have shown that Parkinson's disease (PD) patients tap faster and are more variable during the continuation condition relative to control participants (Harrington et al., 1998; Ivry & Keele, 1989; O'Boyle et al., 1996), suggesting that TR is impaired in the presence of basal ganglia disease. In an fMRI study of PD patients both on and off dopaminergic medication, we (Elsinger et al., 2003) demonstrated decreased neural activation within corticostriatal circuits in PD patients off medication as compared to controls; this reduction was partially normalized when PD patients were evaluated while on their typical medication regimen. Based on findings from our previous fMRI study, we predicted impaired TR task performance and fMRI hypoactivation in the striatum and cortex of our pre-HD participants <12 YEO; in pre-HD individuals >12 YEO, we predicted normal task performance, hypoactivation within the striatum, and hyperactivation in cortical regions.
Second, our previous study examined striatal atrophy by tracing the caudate from high-resolution MR anatomical scans. In the current study, we traced both the caudate and putamen. In addition, we augmented the tracings with voxel based morphometry (VBM) conducted on the whole brain gray matter (Ashburner & Friston, 2000). Using both tracing and VBM methods, we were able to examine possible differences in cortical and subcortical anatomy across the pre-HD subgroups and healthy controls. We predicted that striatal and/or cortical atrophy would be present in a pre-HD group close to diagnosis (<12 YEO), but not in a group far from diagnosis (>12 YEO).
Third, because of the increase in sample size in the current study (13 participants per group as opposed to 7 in our previous fMRI study), we were able to perform a quantitative statistical analysis of the between group fMRI signal intensity changes as opposed to relying solely on a non-quantitative group comparison of the spatial extent of activated regions. Spatial extent of activation relies on a predetermined voxel-wise statistical cutoff that can be influenced as much by background noise as the intensity of the MR signal change within a particular group.
Finally, results from our previous study suggest that fMRI activation patterns, unlike measures of behavioral task performance and striatal atrophy, provides a unique and sensitive tool for discriminating pre-HD individuals far from diagnosis (>12 YEO) from healthy controls. To examine this issue further, we have used a hierarchical discriminant analysis to examine group classification accuracy using atrophy, task performance, and fMRI variables as predictors.
METHODS
Participants
Twenty-six pre-HD participants and 13 age- and education-matched healthy control (CONT) participants took part in this study. Fourteen pre-HD and 7 controls participated in our previous study (Paulsen et al., 2004). Prior to entry, pre-HD participants underwent genetic testing to confirm the CAG expansion of the HD gene. Pre-HD participants were excluded if they previously were given a diagnosis of manifest HD. CONT participants consisted of individuals recruited from advertisements. Participants were excluded if they had a history of neurological disturbance (e.g. seizures, head injury), learning disability or mental retardation, current major psychiatric disturbance, or active substance abuse (within the past 6 months). All were strongly right handed, as determined by scores on the Edinburgh Handedness Inventory (Oldfield, 1971). All participants gave written informed consent based on guidelines established by the Medical College of Wisconsin Institutional Review Board.
Based on a survival analysis regression equation using CAG repeat length and current age (Langbehn et al., 2004), pre-HD individuals were divided into two groups, >12 YEO (FAR, n = 13) and <12 YEO (CLOSE, n = 13), based on a median split of the sample. Group demographics are displayed in Table 1; no between group differences were observed on age, education, and gender (p > .05). As expected, CLOSE participants had a longer mean CAG repeat length (p < .01) and were closer to estimated onset of manifest HD (p < .0001) than FAR participants. The Unified Huntington Disease Rating Scale (UHDRS) (Huntington Study Group, 1996) was administered to each pre-HD individual to screen for symptoms of manifest HD. UHDRS Diagnostic Confidence Levels range from 0 (no abnormalities) to 4 (unequivocal signs of HD at a 99% confidence level). One FAR and two CLOSE participants received a 1 rating; all other pre-HD participants were rated a 0. None of the pre-HD participants, therefore, met criteria for diagnosis of manifest HD (Paulsen et al., 2001). The pre-HD and CONT participants were administered two neuropsychological components from the UHDRS: Symbol Digit Modalities Test (SDMT) and Verbal Fluency (VF).
Means (SD) of demographic data and genetic testing

fMRI Task
All participants performed the TR task followed by a TD task (Paulsen et al., 2004) during the same scanner session. The TR task consisted of a synchronization (S) condition followed immediately by a continuation (C) condition. In the S condition (30 s), participants made right index finger key presses in time with a series of pure tones (50 ms, 380 Hz) separated by a constant interval of 600 ms. In the C condition (30 s), participants were instructed to continue tapping at the same rate as the S condition but without the benefit of the auditory cue. These two conditions were followed by a rest (R) condition (18 s). The S, C, and R conditions alternated in a block design for 5 cycles (total imaging run = 6.8 min). The S, C, and R conditions were designated using the visual cues “TAP,” “CONTINUE,” and “REST,” respectively. Visual cues remained on for the duration of each condition.
The pacing tone was presented binaurally using a computer playback system. Sounds were amplified near the scanner and delivered to the participant via air conduction through 180-cm paired plastic tubes, which were threaded through occlusive ear inserts that attenuated background scanner noise to approximately 75 dB SPL. Background scanner noise consisted of pulses occurring every 136 ms throughout the imaging runs; the intensity of the tone stimuli averaged 100 dB SPL. Visual stimuli were computer-generated and rear-projected onto the center of an opaque screen located at the participant's feet. Participants viewed the screen in a darkened room through prism glasses and corrective lenses, if necessary. Responses were recorded using an MR-compatible keypress device.
Two performance measures, inter-response interval (IRI) and response variability, were used to examine behavioral differences. Response variability was evaluated using the standard deviation calculated for each participant for each condition. IRIs that were 50% higher (≥900 ms) or lower (≤300 ms) than the target duration were excluded from further analysis. Such exclusions occurred on approximately 3% of key presses; however, 99% of these could be accounted for by participants failing to fully depress the response key. Correlations between the number of key presses and behavioral performance (IRI and response variability) were not significant (p > .05). No between group differences were observed in the mean number of excluded responses.
fMRI Acquisition
Whole brain imaging was conducted on a 1.5 Tesla General Electric Signa scanner equipped with a 3-axis local gradient head coil and an elliptical endcapped quadrature radiofrequency coil. Foam padding was used to limit head motion within the coil. Echo-planar images were collected using a single shot, blipped gradient-echo echo-planar pulse sequence (TE = 40 ms, 90° flip angle, NEX = 1, FOV = 240 mm, 64 × 64 matrix). Twenty-two contiguous sagittal 6 mm thick slices were collected (voxel size: 3.75 × 3.75 × 6 mm) with a TR of 3.0 seconds. Prior to functional imaging, high resolution, three-dimensional, spoiled gradient-recalled at steady state anatomic images were collected (TE = 5 ms, TR = 24 ms, 40° flip angle, NEX = 1, slice thickness = 1.2 mm, FOV = 240 mm, matrix = 256 × 128) for anatomic localization and co-registration.
fMRI Image Processing
Functional images were generated using the Analysis of Functional NeuroImages (AFNI) software package (Cox, 1996; Cox & Hyde, 1997). Image time series were spatially registered to reduce the effects of head motion. Three-dimensional registration yielded 6 movement indices per functional imaging run (rotation in the superior-inferior, anterior-posterior, and left-right planes in degrees; translation in the superior-inferior, anterior-posterior, and left-right planes in mm). Prior to and after movement correction, mean displacement and the root mean square (RMS) difference between the baseline image and all subsequent images in the time series was computed as an index of participant head movement. No participants were removed from analysis because of excessive head motion (i.e., none exceeded 0.36 mm mean displacement). No significance between group differences in RMS emerged after movement correction [F(2,36) = 1.101, p = .343].
A deconvolution analysis was used to extract a hemodynamic response function (HRF) for each task condition (S, C) relative to the baseline state (R). The reference function consisted of impulses at the start of each S condition. Percent signal change for the S condition was calculated using HRFs from 9 to 27 seconds post trial onset. Similarly, percent signal change for the C condition was calculated using IRFs from 39 to 57 seconds post trial onset. The intervals used for these calculations were selected by examining the average HRF for all participants and selecting periods of steady state for the S and C conditions. Anatomical and functional images were then interpolated to volumes with 1 mm3 voxels, co-registered, converted to stereotaxic coordinate space (Talairach & Tournoux, 1988), and blurred using a Gaussian filter of 6-mm full-width at half-maximum.
Voxel-wise Analysis
A one-way ANOVA with post hoc t-tests using variance pooled across all participants was performed on a voxel-wise basis on the percent signal change. For each group, statistical parametric maps were generated to identify voxels where the percent signal change estimates for the S and C conditions were significantly greater than the R condition. An individual voxel probability threshold of t > 3.868 (p < 0.0005, df = 36, uncorrected) was used with a minimum 0.34 mL cluster size to determine regions of activation. This combination of individual voxel probability and minimum cluster size thresholds is equivalent to a whole brain family-wise error threshold of p < .05 based on 3,000 Monte Carlo simulations (AFNI AlphaSim).
Functional Region of Interest (fROI) Analysis
A fROI analysis was conducted to evaluate group differences in the magnitude of the percent signal change estimates in functionally active regions. A fROI map was generated by conjoining activated regions identified in the voxel-wise maps (see previous) across the three groups. Any voxel deemed “activated” in the S or C conditions in at least one of the three groups contributed to the final fROI map. For each subject, percent change in MR signal intensity was calculated for the S and C conditions for all voxels within a fROI. This mean percent change in MR signal then served as the dependent variable in a 2 × 3 ANOVA to examine main effects of condition (S, C) and group (CONT, FAR, CLOSE) for each fROI. Main and interaction effects were considered significant at α = 0.005 level. This was followed by post-hoc pairwise group comparisons (Fisher LSD, α = 0.05).
Caudate and Putamen Tracing
Volumetric tracings of the caudate and putamen were conducted on high resolution anatomical images by two raters blind to group assignment. Each structure was traced in the axial plane and remeasured in the sagittal and coronal planes. Tracing was conducted on every other slice with boundary interpolation being performed by Gyrus Finder, an AFNI software plug-in (Cox, 1996). Methodological details for tracing the caudate head and body have been previously published (Paulsen et al., 2004); a sum of the head and body volumes were used for subsequent analyses. The inferior boundary of the putamen was defined by the anterior commissure, medial boundary by the globus pallidus or genu and posterior limb of the internal capsule, the anteromedial boundary by the anterior limb of internal capsule, and the lateral boundary by the external capsule and claustrum. No volumetric differences were observed between the right and left caudate and putamen; as such, subsequent analyses combined the two measurements. A single rater traced the caudate and another rater traced the putamen. Reliability for the caudate and putamen were high (intraclass correlation coefficients = 0.95 and 0.93, respectively).
The caudate and putamen measurements were recorded as volumes (mL) and as a ratio of the caudate and putamen relative to the total brain volume. Total brain volume was obtained using the automated segmentation utility from SPM 5 (Ashburner & Friston, 2005; Good et al., 2001). In native stereotaxic space, the volume of the largest set of contiguous voxels having a significant probability of being white or gray matter (as opposed to cerebrospinal fluid) was determined to be the brain volume. SPM was unable to segment the brain of a CONT participant; as a result, caudate and putamen ratios were calculated based on 12 CONT participants.
Voxel-based Morphometry
VBM was conducted to examine potential regional differences in cortical and subcortical gray matter volume between groups. This was undertaken as a result of recent studies showing cortical abnormalities in pre-HD individuals (Paulsen et al., 2006b; Rosas et al., 2005; Thieben et al., 2002). SPM 5 (Ashburner & Friston, 2005; Good et al., 2001) was used to segment gray matter voxels. A cut-off probability <0.1 was used to remove spurious signals at gray-white matter boundaries. Gray matter volumes were then spatially normalized to a common template, preserving gray matter volume by adjusting the intensity of each voxel for the volume change resulting from the spatial normalization. The resulting “modulated” gray matter volumes were spatially smoothed with a 12-mm isotropic Gaussian kernel. A voxel-wise one-way ANOVA, variance unpooled across participants, was used to examine group main effects. Planned contrasts (CONT vs. CLOSE, CONT vs. FAR, and FAR vs. CLOSE) were performed to examine differences between groups using an individual voxel probability threshold of t = 3.75 (p < 0.001, df = 23) with a minimum cluster size of 0.63 mL. This combination of individual voxel probability and minimum cluster size thresholds was equivalent to a whole brain family-wise error threshold of p < .05 based on 3,000 Monte Carlo simulations (AFNI AlphaSim). As noted above, SPM was unable to segment the brain of one CONT participant; as such, the VBM group analysis was based on 12 controls.
Discriminant Analysis
A hierarchical discriminant analysis was used to identify classes of predictors that achieve accurate group classification. Three classes of predictors were analyzed: (1) volumetric tracings of the caudate and putamen, (2) neuropsychological testing (SDMT, VF) and fMRI task performance (IRI, variability), and (3) MR signal intensity changes derived from the functional ROI analyses (see previously).
RESULTS
Neuropsychological Testing
For SDMT and VF (see Table 2), the one-way ANOVA was significant (p < 0.05); post-hoc analyses indicated that the CLOSE group performed significantly worse than the CONT group.
Mean (SD) of neuropsychological testing, fMRI task performance, and structural MRI variables

fMRI Task Performance
A 2 × 3 ANOVA was performed on the IRI measure. The main effect of condition (S, C) and the group × condition interaction effect were not significant. As a result, Table 2 shows mean IRI for each group collapsed across condition. The main effect of group was not significant for the IRI variable.
A similar 2 × 3 ANOVA was performed on the response variability measure. The main effect of group was highly significant [F(2,72) = 12.96, p < 0.001]. Post hoc analysis indicated that the CLOSE group was more variable than both the FAR and CONT groups; the FAR group performed equivalently to the CONT group. There were no significant condition by group interaction effects for response variability (p = .91). Mean variability, collapsed over condition, is presented in Table 2.
Volumetric Measurements
Mean total brain, caudate and putamen volumes, as well as ratios of caudate and putamen volumes to total brain volume are presented in Table 2. No significant group differences were observed in total brain volume [F(2,35) = .138, p = .87]. Significant group differences were observed for the caudate [F(2,36) = 12.039, p < .001] and putamen [F(2,36) = 8.599, p < .001] volumes. Post hoc analyses revealed that the CLOSE group had smaller caudate and putamen volumes than the FAR and CONT groups. No significant caudate and putamen volumetric differences were observed between the FAR and CONT groups.
Correcting for total brain volume, the caudate and putamen ratios resulted in significant overall group differences (caudate [F(2,35) = 20.146, p < .001], putamen [F(2,35) = 11.028, p < .001]). As observed with the volume measures, the CLOSE group had smaller caudate and putamen ratios than the FAR and CONT groups. In addition, the FAR group had a smaller caudate ratio than the CONT group; the putamen ratio did not differentiate the FAR and CONT groups.
Voxel-Based Morphometry
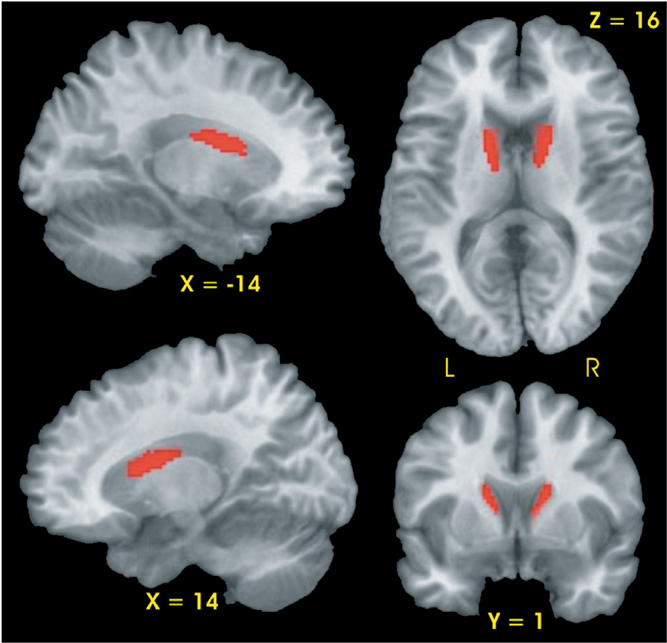
Planned contrasts demonstrated that the CLOSE group had two regions, the right and left head and body of the caudate, with smaller gray matter volumes relative to the CONT group (see Fig. 1). No differences in gray matter volume were observed between the FAR and CONT groups nor between the FAR and CLOSE groups.

Results of voxel-based morphometric analysis. Significantly smaller gray matter volume (red region) was observed in the bilateral caudate of the CLOSE group relative to the Control group.
fMRI Activation Results
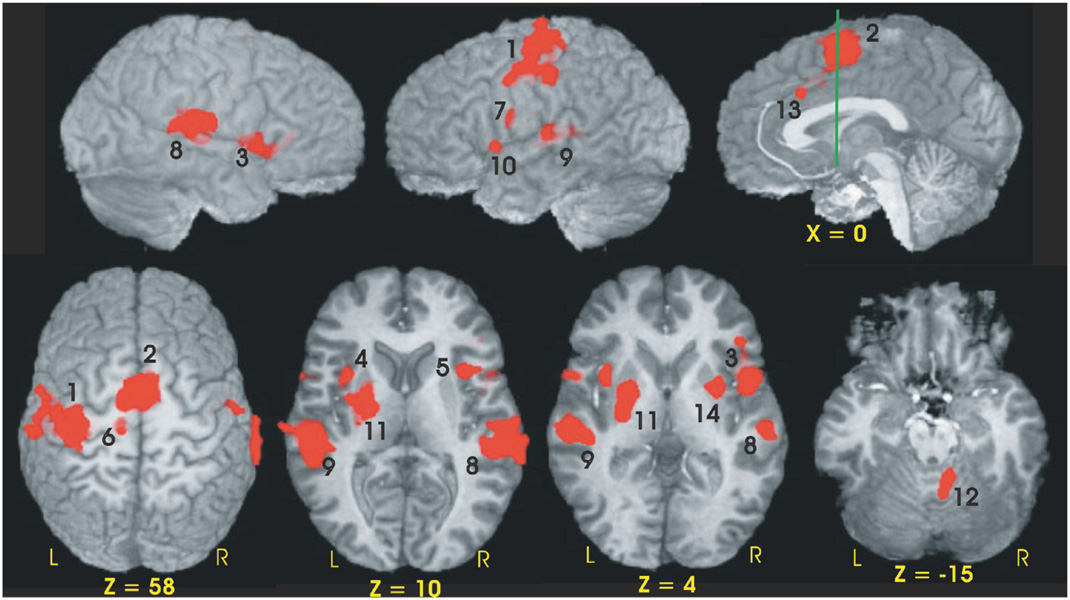
Fourteen functional ROIs were identified from the conjunction analysis performed across the three groups (see Table 3, Fig. 2). Using percent MR signal change as the dependent measure, a 2 (condition) × 3 (group) ANOVA was performed for each fROI. Four of the 14 fROIs demonstrated main effects of condition (S vs. C). As expected from our previous fMRI study of young healthy participants (Rao et al., 1997), fROIs exhibiting greater neural activation during the C condition relative to the S condition included the left sensorimotor cortex (SMC, p = .001) and medial premotor cortex (bilateral SMA/preSMA/CMA, p < .001). Greater activation during the S relative to the C condition was observed in the left and right superior temporal gyri [STG] (p < .001); this was expected since no auditory stimulus was presented during the C condition.
Functional ROIs and volumes of the conjunction mask


Functional ROIs of the conjunction map used to evaluate group differences in MR signal intensity. Numbers adjacent to activation foci correspond to numbers in brackets in Table 3. The green line in the sagittal image (x = 0) is perpendicular to the AC-PC line and is positioned at the anterior commissure (y = 0).
Twelve of the 14 fROIs demonstrated main effects of group. Post hoc analyses revealed 3 distinct patterns of group differences. The first pattern revealed that the CLOSE group had significantly less activation relative to the FAR and CONT groups. This effect was observed in the left anterior insula, right inferior frontal gyrus, bilateral medial premotor area (SMA/preSMA/CMA), and left putamen (see Fig. 3). The second pattern, observed in the right anterior cingulate and right anterior insula, was characterized by a significant stepwise reduction in activation across the three groups (CONT > FAR > CLOSE; see Fig. 4). For the third pattern, the FAR group exhibited significantly increased activation relative to the CLOSE and CONT groups. This effect was observed in the left SMC, left precentral gyrus, left medial frontal gyrus, bilateral STG, and the right cerebellum (see Fig. 5). No significant condition by group interaction effects were observed in any of the 14 fROIs.

Percent MR signal change for each ROI in which the CLOSE group showed significantly lower activation relative to the FAR and Control (CONT) groups (i.e., CONT = FAR > CLOSE). Bracketed numbers refer to brain regions displayed in Fig. 2; error bars = SEM.

Percent MR signal change for each ROI in which a stepwise reduction in activation was observed between the three groups (i.e., CONT > FAR > CLOSE). Bracketed numbers refer t brain regions displayed in Fig. 2; error bars = SEM.

Percent MR signal change for each ROI in which the FAR group showed significantly greater activation relative to the CLOSE and Control groups (i.e., FAR > CONT = CLOSE). Bracketed numbers refer to brain regions displayed in Fig. 2; error bars = SEM.
Discriminant Analysis Results
Results of the hierarchical discriminant analysis are displayed in Table 4. On the first step, four structural MRI variables were entered into the analysis: caudate and putamen volumes and % caudate and putamen ratios. % caudate ratio achieved a 60.7 percent correct group classification (p = .0001); none of the remaining structural MRI variables produced a significant increment in group classification accuracy. Although % caudate ratio was the best structural MRI classifier, it misclassified 53.8% of the FAR group.
Results of hierarchical discriminant analysis
Two neuropsychological tests (Verbal Fluency, Symbol Digit Modalities Test) and two fMRI behavioral task scores (IRI, variability) were entered on the second step of the analysis. None of the four predictors significantly improved group classification accuracy relative to % caudate ratio. These variables were therefore excluded from the subsequent analysis.
On the third and final step, MRI signal intensity changes from the 12 fROIs demonstrating a significant group effect (see above) were entered into the discriminant analysis. Three fROIs resulted in significant and non-redundant improvements in group classification relative to the % caudate ratio: left medial frontal gyrus, right anterior insula, and right cerebellum. Overall, 86.8% of participants (83.3% CONT, 84.6% FAR, 92.3% CLOSE) were correctly classified using the three fMRI and one structural MRI predictors. The addition of the fMRI variables resulted in the greatest improvement in group classification for the FAR group (46.2% without fMRI vs. 84.6% with fMRI). As noted above, the right anterior insula produced a stepwise reduction in fMRI signal across the three groups (CONT > FAR > CLOSE; Fig. 4), whereas the left medial frontal gyrus and right cerebellum demonstrated a hyperactivation pattern in the FAR group (FAR > CONT = CLOSE; Fig. 5).
DISCUSSION
Three major conclusions may be drawn from this study: (1) pre-HD individuals close to diagnosis (<12 YEO) demonstrate a global change in brain structure and function, characterized by impaired performance on a behavioral measure of time reproduction (variability), impaired neuropsychological test performance, reduced volume of the caudate and putamen, and a reduction in brain activation on fMRI; (2) pre-HD individuals far from diagnosis (>12 YEO) exhibit abnormal fMRI activation patterns in the context of minimal striatal atrophy and normal performance on measures of time reproduction and neuropsychological testing; and (3) results of the discriminant analysis demonstrate that fMRI is sensitive in distinguishing healthy from pre-HD individuals, even those more than 12 years from estimated disease onset.
The CLOSE group was not difficult to distinguish from the CONT or FAR groups based solely on behavioral, neuropsychological, and structural MRI measures, as evidenced by the large effect sizes shown in Table 2. Of these nine variables, only two, total brain volume and mean IRI on the time reproduction task, failed to identify abnormalities in the CLOSE group. The impaired performance on the variability measure of the time reproduction task, Symbol Digit Modalities Test, and Verbal Fluency is consistent with previous reports of neurobehavioral impairment in pre-HD (Kirkwood et al., 1999; Kirkwood et al., 2000; Lawrence et al., 1998; Paulsen et al., 2001). The CLOSE group also exhibited substantial atrophy of the caudate and putamen on volumetric measurements, a finding consistent with previous studies of pre-HD individuals (Aylward et al., 1994; Aylward et al., 1996; Aylward et al., 2004). On fMRI, the CLOSE group demonstrated a generalized reduction in neural activation consistent with previous studies (Paulsen et al., 2004; Reading et al., 2004). Relative to behavioral, cognitive and structural imaging measures, it would appear that the addition of task-activated fMRI provides only a modest improvement in distinguishing CLOSE pre-HD individuals from healthy participants (Table 4).
In contrast, the FAR group demonstrated fMRI changes in the relative absence of behavioral deficits or striatal atrophy. The most striking observation was the increased activation, relative to the CLOSE and CONT groups, in several brain regions: left SMC, left medial frontal gyrus, left precentral gyrus, bilateral STG, and the right cerebellum. These hyperactivation results replicate findings from our previous fMRI study (Paulsen et al., 2004) that used a different activation task (time discrimination). Like the CLOSE group, FAR pre-HD individuals also demonstrated reduced neural activation in two regions: right anterior cingulate and right anterior insula. For the FAR group, the addition of the fMRI signal intensity changes, especially from regions demonstrating a hyperactivation pattern, had a substantial impact on group classification accuracy in the discriminant analysis (Table 4). These imaging results suggest that task-activated fMRI may be sensitive to the very earliest neural changes associated with HD-related neuropathology, prior to observable cell loss and symptomatic behavioral changes.
Several explanations might be posited for the fMRI hyperactivation in the FAR group. One possibility is that increased neural activation represents a compensatory mechanism enabling individuals in the early stages of neurodegeneration to perform at a level comparable to healthy individuals. Hyperactive fMRI patterns, in the absence of structural atrophy or behavioral performance deficits, have also been observed in cognitively intact older individuals genetically at risk for Alzheimer's disease (AD) based on having an APOE ε4 allele (Bookheimer et al., 2000) or having a family history of AD (Bassett et al., 2006). It is important to note that we did not observe any evidence of hyperactivation in our CLOSE group, suggesting that the compensatory mechanism may diminish with advancement of the neurodegenerative process. Indeed, DeKosky et al. (2002) demonstrated upsurges in choline acetyltransferase activity in the hippocampus and frontal cortex in patients with mild cognitive impairment (MCI) relative to healthy controls and AD patients. This pattern is similar to Celone et al. 2006, concept of a nonlinear trajectory of fMRI activation across the continuum of disease progression, i.e. normal aging to MCI to manifest AD. Common to all is the portrayal of a dynamic state of increases and decreases in brain activation across the spectrum of impending and manifest disease. Although we did not include a sample of manifest HD patients, it would be predicted that this group would demonstrate hypoactivation. It should be noted, however, that two PET studies conducted on manifest HD patients have observed increased recruitment in the parietal (Bartenstein et al., 1997) and insular (Weeks et al., 1997) cortices during paced motor tasks. These findings, however, may reflect the impact of the movement disorder, which is not present in our pre-HD participants.
Hyperactivation may also reflect dedifferentiation or generalized spreading of activity due to reduced regional specialization (Rajah & D'Esposito, 2005). This dedifferentiation may be the result of increased neural noise. Computational modeling has demonstrated that reduced dopaminergic neuromodulation observed in older healthy adults can lead to increased noise and less distinct representations of information (Li et al., 2001). Thus, the pattern of widespread increased cortical and cerebellar activation may reflect dedifferentiation resulting from early neurodegeneration in the FAR group.
Of particular interest was the increased activation of the cerebellum. A recent study (Hoshi et al., 2005) identified direct connections from deep cerebellar nuclei to the putamen and globus pallidus externus, raising the possibility that the cerebellum may modulate basal ganglia output. Striatal hypoperfusion in the absence of striatal atrophy has been observed in pre-HD individuals more than 7 YEO, suggesting that striatal dysfunction may precede cell loss (Harris et al., 1999). Increased cerebellar activation in the FAR group may reflect upregulation to compensate for early striatal dysfunction.
Another explanation for greater neural activation may be related to the cortical morphology of the FAR group. We have previously reported that pre-HD individuals greater than 18 YEO had larger cortical gray matter volumes relative to controls (Paulsen et al., 2006b). The increased neural activation observed in cortical regions of our FAR group may be related to increased cortical gray matter volume. It should be noted that no group differences emerged between our FAR group and healthy controls on measures of total brain volume or gray matter volume using VBM.
The cortical hyperactivation observed in our FAR group could also reflect cell dysfunction occurring long before cell death (Tobin & Signer, 2000). Using mouse models of HD, abnormalities in dendritic morphology and accumulation of nuclear huntingtin within the cortex were shown to be more predictive of neurologic impairment than comparable measures derived from the striatum (Laforet et al., 2001). These alterations were observed in striatal neuron electrophysiology in response to cortical stimulation and NMDA receptor activation, which in turn covaried with abnormal cortical morphology. Other investigators have shown reduced brain-derived neurotrophic factor transport in cortical projection neurons, leading to increased neurotoxicity of striatal neurons (Gauthier et al. 2004). Gu et al. (2005) found reduced GABAergic neurotransmission in cortical interneurons, producing increased cortical pyramidal cell excitability and resulting in neuropathogenesis in the cortex and striatum. In all, these studies suggest that pathophysiologic changes in the cortex may occur early in the disease and may account for the increased cortical activation observed in our FAR group.
Our current fMRI findings, in conjunction with those from our previous fMRI study (Paulsen et al., 2004), suggest that temporal information processing tasks are sensitive to the early neuropathology evident in the preclinical stages of HD. This result has occurred despite the fact that the two tasks, time reproduction and time discrimination, activate different corticostriatal circuits in healthy individuals (Rao et al., 1997; Rao et al., 2001). The present study, however, does not provide strong support for the hypothesis that timing processes are specifically affected by HD neuropathology. Abnormal activation patterns were observed primarily in sensory and motor regions (cerebellum and sensorimotor, premotor and auditory cortices) rather than in regions commonly associated with time reproduction (putamen and SMA) (Rao et al., 1997). Likewise, the aberrant activation patterns were observed equally during the S and C conditions. The C condition, which requires the subject to reproduce the temporal pattern in the absence of a metronome, stresses internal timekeeping processes in the brain. The absence of significant condition (S, C) by group interaction effects suggests that the abnormal brain activation patterns in pre-HD may not be specifically related to timing processes.
This study of pre-HD individuals suggests a progression of changes in brain function and structure as a function of YEO. It should be emphasized that these conclusions are derived from cross-sectional data and require verification with a follow-up longitudinal study. In addition, the regression formula we used to determine YEO utilizes CAG repeat length and current age. This predictor combination, however, accounts for only 50% of the variance in predicting manifest disease (Brinkman et al., 1997). Caution should also be exercised when comparing results across pre-HD studies, since there are different methods for estimating YEO. Our method uses CAG repeat length and current age (Langbehn et al., 2004; Lawrence et al., 1998), whereas other groups add parental age of onset to CAG repeat length and current age (Aylward et al., 2000; Campodonico et al., 1996; Harris et al., 1999).
We used two methods for examining structural anatomic differences across participant groups. The first method involved tracing the volume of the caudate and putamen. The second method, VBM, was used primarily to examine regional group differences in cortical gray matter volume. In addition, the VBM method enabled a comparison with the tracing method for identifying volumetric differences in the caudate and putamen across groups. Both methods identified atrophy of the caudate in the CLOSE group, but VBM did not find atrophy of the putamen. In addition, the tracing method was able to identify a small, but significant reduction in the % caudate ratio for the FAR group (Table 2); the VBM method did not find any differences between the FAR and CONT groups. These results would suggest that despite the ease of implementing VBM on a whole brain basis, this method may not be as sensitive to identifying regional changes in gray matter volume compared to more traditional methods of tracing predefined ROIs (Davatzikos, 2004).
SUMMARY
Our results demonstrate that changes in fMRI activation can be observed in pre-HD individuals more than 12 years prior to estimated disease onset. These cross-sectional results suggest that fMRI changes precede the onset of behavioral deficits and striatal atrophy. If these results are confirmed by longitudinal research, it is conceivable that fMRI could serve as an imaging biomarker to identify the earliest stages of neural dysfunction in pre-HD individuals. In the context of clinical trials involving neuroprotective agents, such fMRI changes could be used potentially to monitor progression and assess treatment efficacy. Finally, adding fMRI results to CAG repeat length and current age may lead to more precise predictions of onset of manifest HD.
ACKNOWLEDGMENTS
This research was supported in part by grants from the High Q Foundation, National Institutes of Health (R01 NS054893) to JSP, and the Medical College of Wisconsin General Clinical Research Center (M01 RR00058). We thank the Predict-HD sites, the study participants, and the National Research Roster for Huntington Disease Patients and Families. We gratefully acknowledge the invaluable assistance of Sally Durgerian for fMRI data analysis and Nicole Klos and Becky Thompson for volumetric analysis. The information contained within this manuscript has never been published electronically or in print. The authors have no financial conflicts of interest to report.