INTRODUCTION
In recent decades, the ability to withhold a pre-potent response [response inhibition (RI), (Bari & Robbins, Reference Bari and Robbins2013)] has been widely studied in the obsessive-compulsive disorder (OCD) and a vast body of literature, involving many RI tests, has been collected. Some authors found RI deficit in patients with OCD (Boisseau et al., Reference Boisseau, Thompson-Brenner, Caldwell-Harris, Pratt, Farchione and Barlow2012; Chamberlain, Fineberg, Blackwell, et al., Reference Chamberlain, Fineberg, Blackwell, Clark, Robbins and Sahakian2007; Lilienfeld, Reference Lilienfeld2014; Menzies et al., Reference Menzies, Achard, Chamberlain, Fineberg, Chen, del Campo and Bullmore2007; Penadés et al., Reference Penadés, Catalán, Rubia, Andrés, Salamero and Gastó2007; Sohn, Kang, Namkoong, & Kim, Reference Sohn, Kang, Namkoong and Kim2014), while other studies did not find any difference when compared with healthy controls (HCs) (Cha et al., Reference Cha, Koo, Kim, Kim, Oh, Suh and Lee2008; Kalanthroff, Henik, Derakshan, & Usher, Reference Kalanthroff, Henik, Derakshan and Usher2016). Two recent meta-analyses found small to medium effects sizes for RI deficits in patients with OCD. Abramovitch, Abramowitz, and Mittelman (Reference Abramovitch, Abramowitz and Mittelman2013) concluded that these deficits were unlikely on their own to explain the OCD pathophysiology, while Snyder, Miyake, and Hankin (Reference Snyder, Miyake and Hankin2015) concluded that RI deficits are part of OCD impairment in executive control.
One of the most suitable and exploited methods in studying RI is Stop Signal Task (SST), whose theoretical background refers to Logan’s “race model” (1994). The model key point is the independence assumption between the process that responds to the stimulus and the process that responds to the stop signal. According to this perspective, SST comprises two types of tasks: a go task, during which participants have to respond as quickly as possible when a stimulus is presented; and a stop task, which requires participants to withhold the response when a stop signal is presented. Single participant’s accuracy of prior responding to the stop signal is taken into account to adjust the delay between the go stimulus and the stop signal so that the participant is able to successfully inhibit the response in half the trials. Stop-signal reaction time (SSRT) is considered the main outcome of this task and it is defined as the duration of time needed to process the stop response. The SSRT is calculated from two other SST measures: the RTs on go trials (RT GO) and the Stop Signal Delay (SSD) at which the participant is able to stop 50% of the time (Logan & Cowan, Reference Logan and Cowan1984).
In the past two decades, the race model has become increasingly popular in cognitive psychology, neuroscience and psychopathology, causing an exponential increase of SST studies in the scientific literature. In the field of mental health, RI was selected as a sub-construct within cognitive control dimension of Research Domain Criteria and SST was suggested as the main tool to assess RI (Insel et al., Reference Insel, Cuthbert, Garvey, Heinssen, Pine, Quinn and Wang2010). Multiple studies showed that patients with OCD have slower SSRT as compared to HC (Boisseau et al., Reference Boisseau, Thompson-Brenner, Caldwell-Harris, Pratt, Farchione and Barlow2012; de Wit et al., Reference de Wit, de Vries, van der Werf, Cath, Heslenfeld, Veltman and van den Heuvel2012; Lipszyc & Schachar, Reference Lipszyc and Schachar2010; McLaughlin et al., Reference McLaughlin, Kirschner, Foster, O’Connell, Rasmussen and Greenberg2016; Menzies et al., Reference Menzies, Achard, Chamberlain, Fineberg, Chen, del Campo and Bullmore2007), while other authors found no differences between the samples (Kalanthroff et al., Reference Kalanthroff, Henik, Derakshan and Usher2016). To deeply investigate the source of this inconsistency, two studies evaluated the role of symptoms severity, symptom dimensions and both anxiety and depressive symptoms in patients during SST (Lei et al., Reference Lei, Zhu, Fan, Dong, Zhou, Zhang and Zhong2015; McLaughlin et al., Reference McLaughlin, Kirschner, Foster, O’Connell, Rasmussen and Greenberg2016). Both authors found deficient RI in the whole sample of patients with OCD compared with the HCs (i.e., higher SSRT values), but this difference was associated neither with the disease severity, nor with its sub-dimensions, nor with anxiety/depressive symptoms.
Furthermore, when SST is applied to a psychiatric population, a crucial aspect that should be taken into account is the pharmacological one. Indeed, one of the most common drugs used in OCD therapy are antidepressants (i.e., Selective Serotonin Reuptake Inhibitors, SSRI). Interestingly, Schachar et al. (Reference Schachar, Logan, Robaey, Chen, Ickowicz and Barr2007) proposed a subdivision between two distinct RI mechanisms: “Action Restraint” and “Action Cancellation.” “Action Restraint” describes the inhibition before that response has been started and is measured through the go/no-go task, while “Action Cancellation,” refers to the inhibition of a motor response during its execution and is studied using SST. Based upon this RI deconstruction, Eagle, Bari, and Robbins (Reference Eagle, Bari and Robbins2008) highlighted the crucial role of serotonin (5-HT) in “Action Restraint” both in human and animals (i.e., a serotonin depletion is related to an impaired “Action Restraint”). Despite such a strong role in “Action Restraint,” the authors pointed out that there is no evidence that 5-HT plays any significant role in the modulation of the sub-construct of our interest: “Action Cancellation.”
Furthermore, Verbruggen and Logan (Reference Verbruggen and Logan2009) tested the Proactive-Adjustment (PA) hypothesis in HCs. The PA hypothesis assumed that participants would balance stopping and going by adjusting the response threshold in the go task. In other words, they found that even if researchers tell participants not to wait for a stop signal, they would slow their RTs anyway to better inhibit their response when a stop trial occurs. The authors suggest that participants would typically increase RTs, when exploiting response-strategy adjustments, therefore, some practical guidelines for researchers are discussed. Basically, they advised researchers to include a no-stop-signal control block to examine both go-task and stop-task differences.
We found that no authors investigated whether the results inconsistency in OCD literature could be related to this important methodological issue. Thus, our study wants to verify if the same source of heterogeneity found in HCs could be also found in patients with OCD. Thus, we decided to exploit hierarchical cluster analysis based on Delta Reaction Times (ΔRTs; a variable able to evaluate the presence of slowing down strategies during the task, see the Methods section), to verify PA hypothesis replicability without preconceived notions regarding diagnosis. We then proceeded with a cognitive characterization by using the Intra/Extradimensional Set Shift (IED; Lawrence et al., Reference Lawrence, Sahakian and Robbins1998) to investigate cognitive flexibility in identified clusters, as Elchlepp, Lavric, Chambers, and Verbruggen (Reference Elchlepp, Lavric, Chambers and Verbruggen2016) suggested a plausible overlap between task-switching abilities and proactive control.
METHODS
Participants
Thirty-six patients with OCD (Table 1) were recruited during the admission to the Department of Clinical Neurosciences at I.R.C.C.S. San Raffaele Ville Turro sited in Milan, over a period of 36 months. Senior psychiatrists made OCD diagnosis according to the Diagnostic and Statistical Manual of Mental Disorders-5 (American Psychiatric Association, 2014). Neurological diseases, current or past severe brain injuries, substance/alcohol abuse or dependence, and presence of schizophrenic disorder (both in first-degree patients’ relatives and patients themselves) were investigated to exclude patients presenting one or more of these criteria. Thirty-six gender, age and education-matched HCs with no psychiatric history were recruited with the same exclusion criteria of patients. We assessed the severity of the disease through the Yale-Brown Obsessive Compulsive Scale (Y-BOCS; Goodman et al., Reference Goodman, Price, Rasmussen, Mazure, Fleischmann, Hill and Charney1989).
Table 1 Participants demographic and clinical characteristics
a Z score (degrees of freedom=1).
b x 2 test.
c Statistically significant.
At the testing time, 24 patients were receiving pharmacological treatment: 15 patients (42%) were treated with SSRI, 9 patients (25%) were treated with a combination of SSRI and other drugs (Augmentation Strategy; AS), while 12 patients (33%) were drugs free and 8 patients (22%) showed comorbidity with other mental diseases (Table 1). All participants answered State-Trait Anxiety Inventory – II (STAI-II), to investigate trait anxiety (Spielberger, Reference Spielberger1970). Age of onset, illness duration and years of education were also collected. Every participant signed an informed consent and the study was conducted in accordance with the Declaration of Helsinki and the local Ethical Committee.
Materials and Neuropsychological Assessment
Both patients and HC were assessed with SST and IED, commonly used tests within the Cambridge Neuropsychological Testing Automated Battery (CANTAB; Robbins et al., Reference Robbins, James, Owen, Sahakian, Lawrence, McInnes and Rabbitt1998).
SST provides an estimate of an individual’s ability to inhibit an ongoing motor response, according to Logan’s theory. Participants’ task was to respond to a series of left- and rightward pointing arrows lasting 250 ms (i.e., “GO” stimuli) by pressing a button consistent with the direction of the arrows (i.e., “GO” trials). On a minority of trials (25%), an auditory stop signal (a 300-Hz tone beep; i.e., “STOP” trials) followed the arrow presentation. The timing of the auditory stop signal changes throughout the test, depending on the participant’s performance. This means that the delay between the stimulus and the acoustic stop signal (i.e., SSD) depends on the participant’s ability to successfully withhold the response.
Indeed, after successful stopping SSD increases, obstructing the stop process on the next stop-signal trial, while after unsuccessful stopping SSD decreases, helping the stop process on the next stop-signal trial. This SST feature is known as “tracking procedure” and it maintains the overall inhibition probability near 50%. The tracking procedure allows making participants systematically fail to inhibit their responses at half of the total task trials. Thus, the tracking procedure compensates for differences between and within participants, resulting in a similar inhibition probability for different participants (i.e., nearly 50%), tasks or conditions (Verbruggen & Logan, Reference Verbruggen and Logan2009).
All participants trained on the task with an initial “Training Block” consisting of a 16 “GO” trials block. This extra-block provided the subjective RTs of each participant in response to the “GO” stimuli. Five “Experiment Blocks” consisting of 64 trials each, followed the presentation of the “Training Block”. Each block is divided into 4 sub-blocks, composed of 12 “GO” trials and 4 “STOP” trials, making a total of 16 “STOP” trials in each “Experiment Blocks.”
Before starting the task, participants were verbally instructed by the experimenter to respond as quickly and accurately as possible on all trials and to withhold their responses whenever they heard the acoustic signal (i.e., “STOP” trials). Moreover, a feedback screen showing a graphical representation of the participants’ performance appeared at the end of every assessed block. The test administrator explained the graphical feedback representation to the participant, emphasizing that both pressing the buttons quickly and stopping at the beep are important.
IED was used to evaluate attentional set-shifting and reversal learning abilities. The stimuli used have two main features: color-filled shapes and white lines. Simple stimuli were constituted by just one of these dimensions (i.e., only shape or lines), while compound stimuli were made up of both dimensions (i.e., shape and lines). At the beginning of the test, participants performed only simple stimuli, as the test progressed, more compound stimuli (e.g., line and shape) were presented. Participants learned to select the correct dimensions based on the feedback from the computer. However, after the participants gave six correct responses consecutively the stimuli and/or rules were changed. The IED was composed of nine consecutive stages (or blocks), each of which was characterized by a specific rule and stimulus. The IED test terminated if the participant failed to learn the response criterion at any stage after 50 trials. The main outcome variables taken into account were as follows.
SST Variables
Direction Errors on Stop and Go Trials
Represent the number of total errors in selecting the direction of the arrow;
Stop Signal Delay Last Half (50%) (SSD 50% last-half)
Represent the delay (in ms) between the go stimulus and the stop signal at which the participant is able to successfully inhibit his/her response on 50% of trials;
Training Block Reaction Time (TBRT)
Represent the subjective RT (in ms) measured during the Training Block, which consists only in “GO” trials;
Stop Signal Reaction Time (Last Half) (SSRT last-half)
Represent the time interval between the point at which the stop process starts (i.e., when the stop signal is presented, based on the SSD) and the not directly measurable point at which the stop process finishes. The point at which the stop process finishes can be estimated based on the observed RTs distribution on “GO” trials and the observed probability of inhibition for a given SSD. This measure is the widely used outcome to describe RI abilities in literature;
Delta Reaction Time (ΔRT)
Is used to evaluate PA strategy. Indeed, ΔRT is computed by subtracting the mean RT of the “Training Block” from the mean of both correct and incorrect “GO” RT of the “Task Block” of interest. All the five blocks mean, “GO” RTs were exploited. If ΔRT is greater than 0, it means that participants are slowing down their RT relative to their subjective RT, indicating the presence of PA strategy; if ΔRT is less than 0, it means that participants are accelerating their RT relative to their subjective RT.
IED Variables
Total Errors (Adjusted)
Represents a measure of participant’s efficiency. Indeed, participants failing to complete the task have less opportunity to make errors. This adjusted score is calculated adding 25 points for each stage not attempted due to failure.
EDS Errors
Represent the number of errors made in the extra-dimensional stage (i.e., stage 8) of the task.
A trained neuropsychologist administered the neuropsychological tasks.
Data Analyses
Data analyses were performed using IBM SPSS predictive analytics software. The variables normality distribution was evaluated with the Shapiro-Wilk test and, since the variables result not normal distributed, nonparametric tests were run. Thresholds of significance were set at p<.05. Results will be presented as follows.
OCD vs HC
Nonparametric Mann-Whitney test for independent sample was run to compare demographic and clinical data, Direction Errors, SSD (50%) (last-half), SSRT (last-half) and TBRT and ΔRTs (for each block and last-half, IED Total Error (Adjusted) and IED EDS Errors). Specifically, for the clinical sample, we analyzed differences among different type of drugs (Drug Free; SSRI; Augmentation Strategy). Finally, we correlated all the aforementioned variables with Rho-Spearman coefficient.
Cluster analysis and clusters characterization
To draft overall profiles based on the similarities of our participants’ performances, we performed a hierarchical cluster analysis using the five blocks ΔRTs data as the input clusterization variables. We choose ΔRT as the clusterization variable as it provided representative values of a RTs acceleration or braking during the task. Moreover, as we hypothesized that PA strategy could be conceived as a behavior, which is not directly related to OCD diagnosis, this type of analysis allowed to take a different perspective on the data, with no preconceived notions regarding diagnosis.
The Ward’s method
Was used, which minimizes the total within-clusters variance and maximizes the total between-clusters variance. Given n-sets, this procedure permits the reduction to n-1 mutually exclusive sets by considering the union of all possible n(n-1)/2 pairs and selecting a union having a maximal value for the functional relation (Ward, Reference Ward1963). The agglomeration schedule, the agglomeration coefficient (Hair, Black, Babin, & Anderson, Reference Hair, Black, Babin and Anderson2009), the dendrogram and the frequency tables were reviewed to validate the appropriate number of clusters. Nonparametric Wilcoxon test for related sample was performed to compare the ΔRTs five blocks within clusters. Once we have identified the two clusters, we were interested in drawing up clusters features. Using Chi-Squared test, we analyzed the patients and HCs in the two clusters. A nonparametric Mann-Whitney test was run between the identified clusters.
Within Clusters-Between Groups and Within Groups-Between Clusters Analysis
For all the previously mentioned variables, we run two additional types of analyses using Mann-Whitney U test: the evaluation of differences within clusters and between groups (i.e., Proactive OCD vs. Proactive HCs and Not Proactive OCD vs. Not Proactive HCs) and the evaluation of differences within groups and between clusters (i.e., Proactive OCD vs. Not Proactive OCD and Proactive HCs vs. Not Proactive HCs).
IED analyses
Were located in a specific section.
RESULTS
OCD versus HC
The samples were well balanced for age, education and gender, which did not statistically differ between the two groups. The STAI-II scores were significantly higher in the OCD group as expected. The Y-BOCS scores, the duration and onset of illness are reported in Table 1, as well as the medication at the study time and the comorbidities. Since we argued that SST results inconsistency in OCD literature could be due to the presence of PA strategy, we wanted to verify if OCD and HCs differed in their SST and IED variables, using a classic case-control approach. Of interest, we did not find any differences in Direction Errors, SSD (50%) (last-half), SSRT, Training Block, ΔRTs all the Blocks including the last-half (Table 2). Furthermore, we correlated demographic information with both the ΔRTs and the IED variables and we did not find any significance correlation in both samples.
Table 2 Descriptive statistics of Direction Errors, SSD (50%) (last half), SSRT (last half), Training Block RT, ΔRT Block 1, ΔRT Block 2, ΔRT Block 3, ΔRT Block 4, ΔRT Block 5, ΔRT (last half), IED Total Errors (Adjusted), and IED EDS Errors Between HC and OCD
Note. Z-values and degrees of freedom (in brackets) are reported.
a Significantly different.
Direction errors=Direction Errors on Stop and Go Trials; SSD (50%) (last half)=Stop-Signal Delay (50%) (last half); SSRT (last half)=Stop-Signal Reaction Time (last half); Training Block RT=Training Block Reaction Time; ΔRT Block 1=Delta Reaction Time Block 1; ΔRT Block 2=Delta Reaction Time Block 2; ΔRT Block 3=Delta Reaction Time Block 3; ΔRT Block 4=Delta Reaction Time Block 4; ΔRT Block 5=Delta Reaction Time Block 5; ΔRT (last half)=Delta Reaction Time (last half); IED Total Errors (Adjusted)=Intra/Extradimensional Set Shift Total Errors (Adjusted); IED EDS Errors=IED Extra-Dimensional Shift Errors.
To check for medication’s potential role in the clinical sample, we analyzed differences among different type of drugs. We divided the OCD sample in drug free patients, SSRI patients and AS drugs patients as described in the “Participants” paragraph (see the Methods section). Then, we analyzing the ΔRTs differences between the OCDs groups and the HC we found that only drugs free patients showed higher ΔRTs Block 1 than both HCs and AS. However, these data should be interpreted with caution since the drug free group showed high variability in ΔRTs variables and the samples size were small.
Cluster Analysis and Clusters Characterization
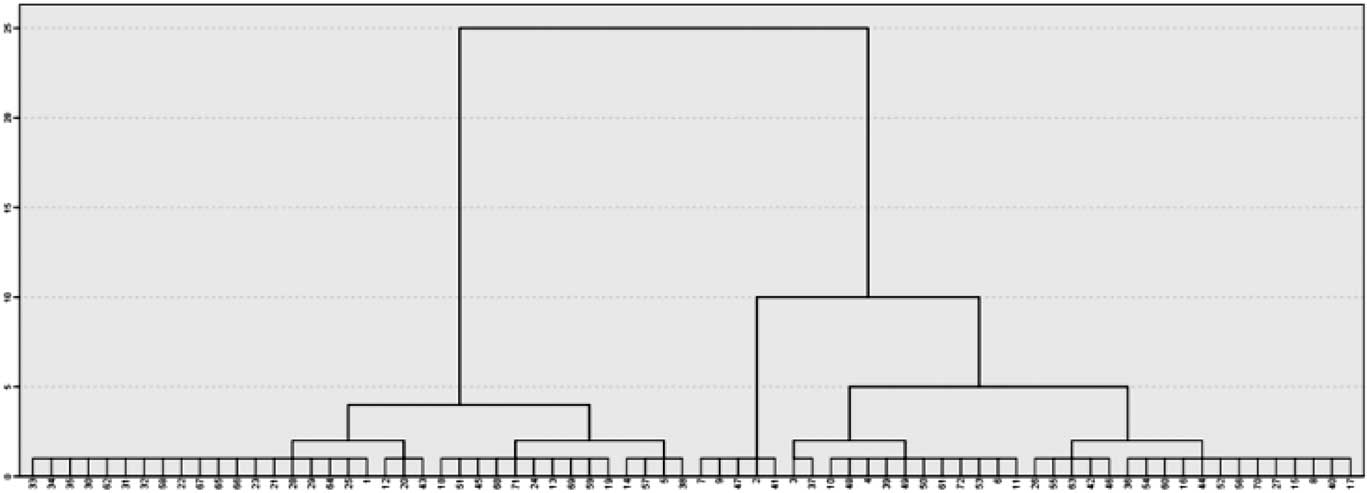
The two-cluster solution was selected according to the agglomeration schedule, the scree plot based on the agglomeration coefficient, the frequency tables and the dendrogram (Figure 1). Indeed, participants were equally distributed in the two clusters defined by their differences in ΔRTs (i.e., 36 participants in cluster 1 and 36 participants cluster 2).

Fig. 1 The figure shows the cluster dendrogram. On the x axis, all the participants involved in the analysis are ordered by their ΔRTs similarities. On the y axis, a rescaled distance is represented using a 0 to 25 scale, that gives an idea of how great the distance was between cases or aggregation that are clustered in a particular step. The dendrogram shows that in coincidence with the greater rescaled distance, the clusters generated (i.e., 2) are evenly balanced in their participants’ frequency (i.e., 36 and 36).
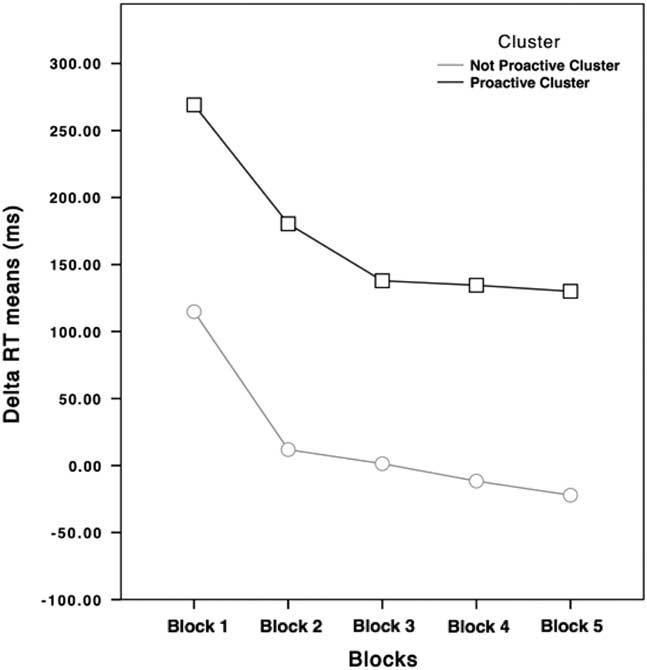
Participants with positive ΔRTs (higher than 0) were slowing down their RTs relative to their subjective RTs, while participants with negative ΔRTs (lower than 0) were going faster than their subjective RTs during the Training Block. For these reasons, from now on, the cluster featured by higher ΔRTs values will be labeled as “Proactive” cluster, while the other one will be labeled as “Not Proactive” cluster. As shown in Figure 2, the main difference is that participants belonging to the Not Proactive cluster speeded up their RTs during the execution of the task, while Proactive participants slowed down their RTs during the task.

Fig. 2 ΔRTs of Not Proactive (light gray dotted line) and Proactive clusters (black squared line) participants in the five blocks. ΔRTs means of the Proactive cluster never goes under 100 ms, while ΔRTs means of the Not Proactive cluster is around 0.
The number of OCD did not significantly differ from that of HCs between the two clusters (χ2=2.000; p=.119), suggesting that PA is not specific to diagnostic group. None of the clinical and demographic variables differed between the two clusters.
Being interested in drawing up clusters features, we found that the trend of the two clusters (Figure 2) was quite similar, specifically during the initial task blocks as highlighted by within analysis. Not Proactive cluster showed higher ΔRTs Block 1 than other ΔRTs blocks, higher ΔRTs Block 2 than ΔRTs Block 4 and 5. ΔRTs Block 3 were higher than ΔRTs Block 5 and ΔRTs Block 4 higher than ΔRTs Block 5. Among Proactive cluster the ΔRTs Block 1 were higher than all the other ΔRTs blocks, while the ΔRTs Block 2 were higher only than ΔRTs Block 5 and ΔRTs Block 3, 4, and 5 did not significantly differed among each other.
The two clusters did not differ in their SSRT, while all the other variables were significantly different. Indeed, Not Proactive cluster’s Direction Errors and TBRTs were higher than that of the Proactive cluster. Conversely, Proactive participants showed higher SSD 50% (last-half), and ΔRTs (including last half ones), than Not proactive participants (Table 3).
Table 3 Descriptive statistics of Direction Errors, SSD (50%) (last half), SSRT (Last half), Training Block RT, ΔRT Block 1, ΔRT Block 2, ΔRT Block 3, ΔRT Block 4, ΔRT Block 5, ΔRT (last half), IED Total Errors (Adjusted), and IED EDS Errors between HC and OCD

Note. Z-values and degrees of freedom (in brackets) are reported. Significant differences are highlighted in bold.
Direction Errors=Direction Errors on Stop and Go Trials; SSD (50%) (last half)=Stop-Signal Delay (50%) (last half); SSRT (last half)=Stop-Signal Reaction Time (last half); Training Block RT=Training Block Reaction Time; ΔRT Block 1=Delta Reaction Time Block 1; ΔRT Block 2=Delta Reaction Time Block 2; ΔRT Block 3=Delta Reaction Time Block 3; ΔRT Block 4=Delta Reaction Time Block 4; ΔRT Block 5=Delta Reaction Time Block 5; ΔRT (last half)=Delta Reaction Time (last half); IED Total Errors (Adjusted)=Intra/Extradimensional Set Shift Total Errors (Adjusted); IED EDS Errors=IED Extra-Dimensional Shift Errors.
We did not find any significant correlation for Proactive and Not Proactive clusters.
Within Clusters-Between Groups and Within Groups-Between Clusters Analysis Finally, we run two additional types of analysis: (1) differences evaluation within clusters and between groups (i.e., Proactive OCD vs. Proactive HCs and Not Proactive OCD vs. Not Proactive HCs; (2) differences evaluation within groups and between clusters (i.e., Proactive OCD vs. Not Proactive OCD and Proactive HCs vs. Not Proactive HCs). Considering these comparisons, the sample was further divided: the Not proactive cluster included 15 patients and 21 HC participants and the opposite was for the Proactive cluster which included 21 OCD and 15 HCs. The first type of comparisons showed that, among Not proactive participants, patients with OCD made more Direction Errors than HCs and had longer SSRT (last-half) than HCs, whereas in the Proactive cluster HCs’ SSRT were longer than that of patients with OCD (Table 4). Relative to the second type of comparisons, we found that Not Proactive OCD participants showed more Direction Errors, higher SSRT, lower SSD (50%) (last-half), and lower ΔRTs than the Proactive OCD participants. Otherwise, among the HC group, the Not Proactive participants made more Direction Errors and had lower SSD (50%) (last-half) and ΔRTs (Table 5).
Table 4 Descriptive statistics of Direction Errors, SSD (50%) (last half), SSRT (last half), Training Block RT, ΔRT Block 1, ΔRT Block 2, ΔRT Block 3, ΔRT Block 4, ΔRT Block 5, ΔRT (last half), IED Total Errors (Adjusted), and IED EDS Errors between HC and OCD
Note. Z-values and degrees of freedom (in parentheses) are reported. Significant differences are highlighted in bold.
a OCD (Not Proactive n=12; Proactive n=21); HC (Not Proactive n=14; Proactive n=12).
Direction errors=Direction Errors on Stop and Go Trials; SSD (50%) (last half)=Stop-Signal Delay (50%) (last half); SSRT (last half)=Stop-Signal Reaction Time (last half); Training Block RT=Training Block Reaction Time; ΔRT Block 1=Delta Reaction Time Block 1; ΔRT Block 2=Delta Reaction Time Block 2; ΔRT Block 3=Delta Reaction Time Block 3; ΔRT Block 4=Delta Reaction Time Block 4; ΔRT Block 5=Delta Reaction Time Block 5; ΔRT (last half)=Delta Reaction Time (last half); IED Total Errors (Adjusted)=Intra/Extradimensional Set Shift Total Errors (Adjusted); IED EDS Errors=IED Extra-Dimensional Shift Errors.
Table 5 Descriptive statistics of Direction Errors, SSD (50%) (last half), SSRT (last half), Training Block RT, ΔRT Block 1, ΔRT Block 2, ΔRT Block 3, ΔRT Block 4, ΔRT Block 5, ΔRT (last half), IED Total Errors (Adjusted), and IED EDS Errors between HC and OCD

Note. Z-values and degrees of freedom (in brackets) are reported. Significant differences are highlighted in bold.
a OCD (Not Proactive n=12; Proactive n=21); HC (Not Proactive n=14; Proactive n=12).
Direction errors=Direction Errors on Stop and Go Trials; SSD (50%) (last half)=Stop-Signal Delay (50%) (last half); SSRT (last half)=Stop-Signal Reaction Time (last half); Training Block RT=Training Block Reaction Time; ΔRT Block 1=Delta Reaction Time Block 1; ΔRT Block 2=Delta Reaction Time Block 2; ΔRT Block 3=Delta Reaction Time Block 3; ΔRT Block 4=Delta Reaction Time Block 4; ΔRT Block 5=Delta Reaction Time Block 5; ΔRT (last half)=Delta Reaction Time (last half); IED Total Errors (Adjusted)=; IED EDS Errors=IED Extra-Dimensional Shift Errors.
IED Analysis
The participants involved in IED analyses were the same recruited for the SST ones, although data counts 13 missing participants, 10 belonging to the Not Proactive cluster (totaling 26 participants) and 3 belonging to the Proactive cluster (totaling 33 participants).
We found that the Proactive participants had both IED Total Errors (Adjusted) and IED EDS Errors significantly higher than the Not Proactive cluster (Table 3). Instead, when looking at the differences between the HCs and OCD, we found that patients made more IED Total Errors (Adjusted) than HCs (Table 2). Finally, we found that only the OCD sample showed a significant difference between the two clusters, with the Proactive participants making more IED EDS Errors than the Not proactive participants. Regarding the clinic sample, we found significant differences only between HCs and drug-free patients in both IED total errors (adjusted) and IED EDS errors. Indeed, drug-free patients made more errors during the task and given their higher EDS errors values, they showed less set-shift flexibility than HCs.
DISCUSSION
In line with Cha et al. (Reference Cha, Koo, Kim, Kim, Oh, Suh and Lee2008) and Kalanthroff et al. (Reference Kalanthroff, Henik, Derakshan and Usher2016), we did not find any RI differences among the neurocognitive variables considered between OCD and HCs. Results further validated conclusions of Abramovitch and colleagues (2013), suggesting that RI deficits were unlikely on their own to explain the pathophysiology of OCD.
The main aim of our study was to verify the hypothesis that PA strategy could influence on the study of SST in OCD. We identified a first cluster characterized by a consistent RTs slowdown during the task, and a second cluster featured by RTs acceleration. Despite many consistent differences, the ΔRTs trends in the two clusters were quite similar. At the incipit of the task, the participants performed a Training Block without stop signals, therefore, they did not have to inhibit their responses. This passage explained the highest ΔRTs in the first block. Participants’ ΔRTs of both groups showed a greater reduction from the second block, followed by a further slower decrease in subsequent blocks.
It should be highlighted that starting from Block 3, no differences were found between this block and the consecutive ones in the Proactive cluster, unlike the Not Proactive cluster. We argued that these results should be interpreted considering the role of the tracking procedure. Proactive participants had to maintain their higher RTs around a safety value, which provided them to balance between their willingness to not commit inhibition errors and the structure of the task itself. Indeed, ΔRTs of the Proactive cluster never went under 100 ms, a delay at which RI should be very rare (i.e., the stop process started too late to cancel the response) (Verbruggen & Logan, Reference Verbruggen and Logan2009), while starting from Block 3 ΔRTs of Not Proactive were around 0.
Thus, results showed in Figure 2 suggested that only Not Proactive participants were performing the task as fast as possible, while Proactive participants consistently slowed down their RTs, despite researcher’s instruction not to wait for the stop signal. Proactive participants showed significantly lower number of Direction Errors and significantly higher SSD. These results could be considered as the effect of PA: these participants had more time to view and select the correct GO stimulus (i.e., the arrow), indeed, since longer times were needed to miss half of the inhibition signals, their SSD increased.
Furthermore, both IED Total Errors (Adjusted) and IED EDS Errors were statistically higher in the Proactive cluster. These results showed that the two clusters were well differentiated, describing two different performance approaches, also featured by different profile relative to rule acquisition/reversal and attentional shifting. In our opinion, our results could be linked with those evidence suggesting that PA strategy should be considered more in the wider attention and action control literature, than as a solely RI index (Elchlepp et al., Reference Elchlepp, Lavric, Chambers and Verbruggen2016). Authors underlined a considerable overlap between preparatory control in task-switching studies and proactive action control. Following Criaud, Wardak, Ben Hamed, Ballanger, and Boulinguez (Reference Criaud, Wardak, Ben Hamed, Ballanger and Boulinguez2012), it could be hypothesized that proactive inhibition of response is the default mode of executive control. This idea would suggest that top–down control of sensorimotor reactivity consists of a temporary release of the default locking state.
Crucially, our hypothesis is that adjustment in the stop-signal paradigm could be related to a higher-level control mechanism, which would behaviorally reflect a proactive slowing of go RT in anticipation of stop signals (Verbruggen & Logan, Reference Verbruggen and Logan2009). Thus, deepening this explicit aspect through the IED task, we found less cognitive flexibility in the PA group. This result was very interesting, suggesting that PA participants found more difficulties in shifting their strategy during the execution of the go trials. Indeed, despite go trials required participants to be as quick as possible in their responses (as the task itself is structured upon this claim to adequately perform it), PA participants seemed more focused on stop trials, which needed more caution in contrast to the speed requested by the go ones.
The issue is so complex that Logan, Van Zandt, Verbruggen, and Wagenmakers (Reference Logan, Van Zandt, Verbruggen and Wagenmakers2014) revised the race model implementing a new model assuming that each runner would be a diffusion process. It means that authors tried to explain the mechanism underlying the strategic slowing by attributing it to model parameters that the executive system can adjust strategically. Thus, the threshold adjustment and the delaying of stochastic accumulation onset (i.e., an increase in non-decision time) would explain PA.
Furthermore, three considerations must be taken into account, suggesting considerable caution in the discussion and interpretation of our results. First, studies that investigated PA and reactive strategies during inhibition by manipulating the task structure should be considered far from our work methodology. Indeed, since we used a version of SST (from CANTAB) that was widely exploited in literature, without making any change the task framework, our focus could be considered as “participant-oriented,” rather than “task-oriented.” Second, literature suggested taking into account the probability of stopping to theoretically divide between “Reactive Inhibition” (low probability of stopping) and PA (high probability of stopping) (Hermans et al., Reference Hermans, Beeckmans, Michiels, Lafosse, Sunaert, Coxon and Leunissen2017). However, it is unclear, which cognitive mechanisms would be involved in the slowing of “go RT.”
Lastly, it has to be considered that we addressed the SST performance issue from a “top–down” standpoint (i.e., explicit PA strategy). However, an alternative and somehow complementary viewpoint is that during SST execution, the RTs slowdown results from accumulated post–stop-signal slowing (Bisset & Logan, Reference Bissett and Logan2011, Reference Bissett and Logan2012), that is from a more bottom-up associative learning process. In our opinion, the importance of the explicit strategy in this very complex process is supported by the less cognitive flexibility showed by PA group (which was noteworthy identified based on high values of Delta RTs). This view does not exclude the influence of more bottom–up processes, which should be deeply investigated to merge findings into a more unitary perspective. However, more has to be done to better understand the relationship between set-shifting and PA strategy from a functional perspective.
Once again, our aim was to show that regardless of the diagnosis, half of our sample did not follow SST instructions during its performance in the standard SST. These participants increased their RT during GO trial for the whole task and we argue that this explicit behavior was related with a tendency to more cognitive inflexibility. For this reason, we could hypothesize that those incongruent findings presented in the introduction, in OCD (and other psychopathologies) could be related to this methodological issue, instead of others sources of heterogeneity. Indeed, given our results on psychopharmacological effects, we can also further confirm Eagle et al. (Reference Eagle, Bari and Robbins2008) findings on SSRI and “Action Cancellation” that exclude a role of drugs on PA strategy and on other SST performance variables.
Moreover, since drugs free patients made more total errors and EDS errors during IED task than HCs, we could hypothesize a possible effect of drugs on set-shifting abilities. However, these differences were not replicated both with SSRI treated patients and HCs and patients treated with a combination of SSRI and other drugs and HCs. Nevertheless, we must interpret results with caution considering the different sample sizes of drug free patients (12), SSRI treated patients (15), and patients treated with a combination of SSRI and other drugs (9).
Noteworthy, the within clusters analysis added more details on our investigation. In fact, finding a significantly higher number of Direction Errors and higher SSRT (last-half) in patients with OCD compared with HCs ones, we corroborate the conclusion of Snyder and collaborators (2015). These authors reviewed the proliferation of research on some executive functions (i.e., inhibition or working memory) in psychiatric samples and showed that the independence of clinical and cognitive approaches led to failure to apply theoretical and methodological advances in these fields of research. They underlined the need to move beyond cross-sectional case-control designs to test different possible causal links between executive (dsy) functions and psychopathology.
In our opinion, our research moves in this direction, allowing the comparison between a clear cognitive mechanism (PA) within HCs and OCD samples. Even in this case, our results should be taken with caution since we found that SSRT differed also within the Proactive group showing opposite results. Indeed, HCs SSRT was higher than OCD SSRT. Thus, we argue that literature on RI in OCD should be revised taking into account the influence of PA strategy. However, the sample size of this analysis should be considered before coming to conclusions (14 OCD and 21 HC for the Not Proactive cluster; 21 OCD and 12 HC for the Proactive cluster).
Furthermore, within group analysis revealed that both Proactive OCD and Proactive HCs made more Direction Errors and showed higher SSD values than, respectively, Not Proactive OCD and Not Proactive HCs. Even in this case, the reason behind these results was the same previously discussed. Interestingly, only Not Proactive OCD showed higher SSRT values than Proactive OCD. Considering the within cluster SSRT results, this evidence seemed to corroborate the idea that PA strategy had an influence on SSRT and, therefore, should be evaluated during the administration of SST.
Our study has several limitations. Due to the low sample size, depression rates and comorbidities were not taken into account. These variables are crucial for future studies that should investigate them as possible moderators of PA strategy in OCD. However, the lack of relation between PA and diagnosis suggest the PA independence from “clinical” moderators. As already explained before, we equated proactive inhibitory control with “response slowing”: this is a reduction of the complexity of the analyzed construct (Logan et al., Reference Logan, Van Zandt, Verbruggen and Wagenmakers2014; Elchlepp et al., Reference Elchlepp, Lavric, Chambers and Verbruggen2016). Future studies should deepen our investigation with imaging techniques. Finally, a larger sample size could give more statistical power to the study.
CONCLUSIONS AND FUTURE DIRECTIONS
Beyond diagnostic labels, PA strategy is a behavior characterizing a large part of our samples. This main finding is not a novelty for cognitive literature, as an interesting debate regarding the origins of the behavior is still open (Verbruggen and Logan, Reference Verbruggen and Logan2009). Rather, the novelty is the opening of many methodological questions for researchers involved in the investigation of RI as a crucial topic for a deeper understanding of several mental illnesses. Ten years ago, RI was proposed as a candidate endophenotype for OCD (Chamberlain, Fineberg, Menzies et al., Reference Chamberlain, Fineberg, Blackwell, Clark, Robbins and Sahakian2007; de Wit et al., Reference de Wit, de Vries, van der Werf, Cath, Heslenfeld, Veltman and van den Heuvel2012) and psychiatric research has been widely involved in its investigation in clinical samples largely neglecting, minimizing, and underestimating the role of PA strategy.
Psychiatry is seeking for neurocognitive measures, which could optimize the assessment of neurocognitive impairments in patients and first-degree relatives, but the specific case of SST could suggest that this cognitive tool is not free from methodological issues. Verbruggen and Logan (Reference Verbruggen and Logan2009) wrote some practical guidelines for researchers, who wanted to investigate RI with SST, suggesting that the task should present a low percent of stop trials controlling the possibility that participants performed a PA strategy.
The use of PA strategy also could have important consequences on neuroimaging data assessing the fronto-basal ganglia networks. These networks are involved in RI: a fast hyper-direct pathway that connected right inferior frontal gyrus (rIFC) and pre-supplementary motor area (pre-SMA) with sub-thalamic nucleus (STN) and by an indirect pathway between rIFG/pre-SMA and the caudate nucleus (Duann, Ide, Luo, & Li, Reference Duann, Ide, Luo and Li2009; Jahfari et al., Reference Jahfari, Waldorp, van den Wildenberg, Scholte, Ridderinkhof and Forstmann2011; Swann et al., Reference Swann, Poizner, Houser, Gould, Greenhouse, Cai and Aron2011). Jahfari and colleagues (Reference Jahfari, Verbruggen, Frank, Waldorp, Colzato, Ridderinkhof and Forstmann2012) performing a connectivity analysis of these areas, found that proactive action’s preparation planned in highly predictable situations, reduced the reliance of the basal ganglia on the goal-oriented prefrontal cortex. This evidence suggests that top–down control would be strongest in an unpredictable environment.
Leunissen, Coxon, and Swinnen (Reference Leunissen, Coxon and Swinnen2016) found an association of HCs’ successful inhibition on Stop trial with increased STN activity and with increased caudate head activation, during PA condition. It suggests “a different implementation of reactive RI by the basal ganglia for differing degrees of proactive response control.” Thus, PA strategy could be considered as an attentional and action control mechanism with a specific neural substrate, which could require specific investigations in psychopathological literature. Hermans and collaborators (2017) showed the ability of patients with traumatic brain injury to proactively prepare to stop, even though reactive inhibition was impaired.
Moreover, structural gray matter integrity (sub-regions of basal ganglia and thalamus) predicted proactive inhibition in controls but not in patients. Benis et al., (Reference Benis, David, Lachaux, Seigneuret, Krack, Fraix and Bastin2014) found that the temporal dynamics of SNT dissociates the reactive and PA strategies in a little sample Parkinson Disease’s patients. In fact, the decrease of β band Activity in this area, observed during GO trials, was prematurely interrupted during reactive stopping at a latency that precedes the SSRT by ~100/150 ms. On other hand, they showed that the SNT was modulated by PA inhibitory control: a higher level of β band Activity in PA inhibition correlated with patient’s inhibitory performances. Whether these neural patterns are also present during the standard SST in people who slowed down their RT or which follow instructions remains an open question for future research.
Summarizing our data and evidence from literature, it seems clear that PA inhibitory strategy could be a new interesting target in the field of psychopathology, with a particular focus in OCD where subcortical abnormalities were clearly showed in pediatric and adult patients with OCD (Boedhoe et al., Reference Boedhoe, Schmaal, Mataix-Cols, Jahanshad, Thompson and van den Heuvel2017). Despite our data confirming that the kind of strategy is not linked with diagnosis, we could hypothesize a different brain activity’s pattern between OCD and HCs during reactive and PA inhibition. For this reason, it could be more proper to investigate different activations using methodologies similar to the ones we have just discussed above, where all participants are evaluated during both conditions. Moreover, given the aforementioned hypothesized non-diagnostical feature of PA, it could be interesting to evaluate whether personological characteristics could be related to PA. Indeed, the role of temperament and character could be potentially highlighted. In fact, they are not directly linked with categorical diagnosis and should be considered as dimensional constructs related to the use of PA.
ACKNOWLEDGMENTS
All authors declare no financial interests or conflicts of interest. No financial support was necessary for this research. Public Significance Statements: This study suggests that Proactive Strategy (PA) could be an important methodological issue in performing the Stop Signal Task (SST), to such an extent that it could be one of the reasons behind SST results heterogeneity in literature.