INTRODUCTION
Mortality rates from breast cancer (BC) have been declining, resulting in a growing number of BC survivors contending with long-term adverse effects of their disease and its treatment. Most BC survivors report that chemotherapy negatively affects cognitive functioning and many find that this detracts from their day-to-day function and quality of life (Duijts et al., Reference Duijts, van Egmond, Spelten, van Muijen, Anema and van der Beek2014; Fitch, Armstrong, & Tsang , Reference Fitch, Armstrong and Tsang2008; Janelsins et al., Reference Janelsins, Heckler, Peppone, Kamen, Mustian, Mohile and Morrow2017; Runowicz et al., Reference Runowicz, Leach, Henry, Henry, Mackey, Cowens-Alvarado and Ganz2016). Yet many studies have failed to detect significant cognitive deficits using objective neuropsychological testing. In fact, the most recent meta-analysis published in this area showed no difference in overall neuropsychological function between patients who received chemotherapy and those who did not (Ono et al., Reference Ono, Ogilvie, Wilson, Green, Chambers, Ownsworth and Shum2015). Most studies also report that, while subjective cognitive ratings correlate strongly with measures of anxiety and depression, there is little to no correlation between subjective and objective measures of cognitive function, leading to the conclusion that cognitive disturbances are symptoms of psychological distress rather than neurological dysfunction (Debess, Riis, Engebjerg, & Ewertz, Reference Debess, Riis, Engebjerg and Ewertz2010; Hermelink et al., Reference Hermelink, Küchenhoff, Untch, Bauerfeind, Lux, Bühner and Münzel2010; Hutchinson, Hosking, Kichenadasse, Mattiske, & Wilson, Reference Hutchinson, Hosking, Kichenadasse, Mattiske and Wilson2012; Pullens, De Vries, & Roukema, Reference Pullens, De Vries and Roukema2010).
A counter argument is that traditional neuropsychological measures are not sensitive enough to detect cancer-related cognitive disturbances which may be subtle and may only manifest under conditions of stress or fatigue. This argument derives support from functional MRI studies showing differences between BC patients and healthy controls in brain activation and connectivity patterns in the absence of performance differences on the cognitive activation tasks used to generate the scans (De Ruiter & Schagen, Reference De Ruiter and Schagen2013). In some of these studies, the alterations in the brain images have been found to correlate with subjective cognitive measures (Askren et al. Reference Askren, Jung, Berman, Zhang, Therrien, Peltier and Cimprich2014; Kesler, Kent, & O’Hara, Reference Kesler, Kent and O’Hara2011).
When assessing an individual’s cognitive function, we typically rely on measures of performance accuracy (number correct) or speed (mean response time) and regard “intraindividual variability” (IIV) in performance as “noise” (Golay, Fagot, & Lecerf, Reference Golay, Fagot and Lecerf2013). However, IIV may be an important signal in its own right. Studies have shown that IIV is a relatively stable individual attribute (Li, Aggen, Nesselroade, & Baltes, Reference Li, Aggen, Nesselroade and Baltes2001) that is associated with accuracy on independent cognitive measures (Hultsch, MacDonald, & Dixon, Reference Hultsch, MacDonald and Dixon2002) and with everyday problem-solving skills (Burton, Strauss, Hultsch, & Hunter, Reference Burton, Strauss, Hultsch and Hunter2009).
There are various approaches to measuring IIV. Inconsistency is the term used to refer to the variability in an individual’s scores on the same task over time, whether over multiple occasions or from trial to trial within a single task. Trial-to-trial IIV is most often measured with reaction time (RT) tasks as they yield a non-binary value for each trial (vs. correct/incorrect). In normal individuals, response speed tends to slow with prolonged time on task and to become less regular, owing to an increased frequency of long responses. These prolonged responses are presumed to reflect “attentional lapses,” suggesting that IIV in RT may provide unique information about an individual’s ability to maintain an optimal attentional state (Flehmig, Steinborn, Langner, Scholz, & Westhoff, Reference Flehmig, Steinborn, Langner, Scholz and Westhoff2007).
Converging evidence suggests that IIV is also an indicator of neurobiological integrity. An age-related increase in IIV has been well documented (Haynes, Bauermeister, & Bunce, Reference Haynes, Bauermeister and Bunce2017) and, in elderly samples, IIV provides information over and above speed and accuracy measures in discriminating between individuals with and without dementia (Hultsch, MacDonald, Hunter, Levy-Bencheton, & Strauss, Reference Hultsch, MacDonald, Hunter, Levy-Bencheton and Strauss2000) and in predicting future cognitive decline/impairment (Haynes et al., Reference Haynes, Bauermeister and Bunce2017). Increased IIV has also been associated with several other neurological and neuropsychiatric conditions, including HIV infection (Morgan, Woods, Delano-Wood, Bondi, & Grant, Reference Morgan, Woods, Delano-Wood, Bondi and Grant2011), Parkinson’s disease (Fauser et al., Reference Fauser, Löhle, Ebersbach, Odin, Fuchs, Jost and Storch2015), epilepsy (Bruhn & Parsons, Reference Bruhn and Parsons1977), traumatic brain injury (Hill, Rohling, Boettcher, & Meyers, Reference Hill, Rohling, Boettcher and Meyers2013), multiple sclerosis (Wojtowicz, Berrigan, & Fisk, Reference Wojtowicz, Berrigan and Fisk2012), schizophrenia (Zahn et al., Reference Zahn, Jacobsen, Gordon, McKenna, Frazier and Rapoport1998), and attention deficit hyperactivity disorder (Castellanos et al., Reference Castellanos, Sonuga-Barke, Scheres, Di Martino, Hyde and Walters2005).
IIV may be particularly informative in assessing individuals with neurological disorders that are mild or not easily definable or in identifying those at risk of cognitive decline (Hultsch et al., Reference Hultsch, MacDonald and Dixon2002). For example, in cognitively normal adults, IIV has been shown to discriminate between carriers and non-carriers of an apolipopotein ɛ4 allele (a risk factor for dementia) (Duchek et al., Reference Duchek, Balota, Tse, Holtzman, Fagan and Goate2009) and to predict future development of mild cognitive impairment (Haynes et al., Reference Haynes, Bauermeister and Bunce2017).
Two studies to date suggest that IIV may also have the potential to detect subtle cognitive disturbances in patients with non-central nervous system cancers. Bernstein, Catton, and Tannock (Reference Bernstein, Catton and Tannock2014) compared chemotherapy-treated BC patients to healthy controls on a “go-no go” Continuous Performance Test (CPT) and found that, under more demanding conditions (i.e., short interstimulus intervals), the patients had greater IIV in RT. There were no group differences on measures of central tendency. This same group (Yao et al., Reference Yao, Rich, Tannock, Seruga, Tirona and Bernstein2016; Yao, Rich, Tirona, & Bernstein, Reference Yao, Rich, Tirona and Bernstein2017) also conducted a longitudinal study in BC patients, examining IIV in RT on a Stroop task before neoadjuvant chemotherapy, 1 month after chemotherapy but before surgery, and after surgery (some 9 months post-chemotherapy). The BC patients showed greater variability than controls at the first and final assessments, as well as less improvement in IIV from the first to the last session (i.e., less benefit from practice). Again, IIV was more sensitive to these group differences than mean RT.
The present study aimed to further explore the sensitivity of IIV to cancer-related cognitive changes. Toward this end, we re-analyzed data that were originally collected to examine the dose-response relationship between chemotherapy and cognition in BC patients (Collins, Mackenzie, Tasca, Scherling, & Smith, Reference Collins, Mackenzie, Tasca, Scherling and Smith2013). We hypothesized that variability in RT across trials on the respective parts of a four-part CPT would increase in the BC group over the course of chemotherapy but not in the healthy control group, in the absence of change in accuracy or mean RT in either group.
METHODS
This is a secondary analysis of data from a prospective longitudinal study examining cognitive changes in BC patients undergoing chemotherapy. Extensive descriptions of the general design, participants, measures, and procedures of the original study have been previously published (Collins et al., Reference Collins, Mackenzie, Tasca, Scherling and Smith2013) and are only briefly summarized here.
Participants
Participants were 60 female BC patients recruited from the Ottawa Hospital Regional Cancer Centre between September, 2008, and April, 2010, and 60 healthy women. The healthy controls were individually matched to patients on age (within 5 years) and, to the extent possible, on education (according to the categories listed in Table 1) and first language. Each patient was asked to nominate her own control; when she was unable or disinclined to do so, a matched control was recruited through posters and Web site advertisements. The patients underwent mastectomy or lumpectomy and received various regimens of adjuvant chemotherapy. All participants were 65 years of age or younger, were fluent in English, and had at least grade-eight education. Exclusion criteria included: (1) history of previous cancer, chemotherapy, or radiotherapy; (2) neoadjuvant chemotherapy for current BC; (3) history of serious psychiatric, substance-abuse, or neurological disorder (past or present); and (4) intercurrent cancer or illness affecting cognition while participating in the study. Ethics approval was obtained from the Ottawa Hospital Research Ethics Board and all participants provided informed consent.
Table 1 Nested HLM models
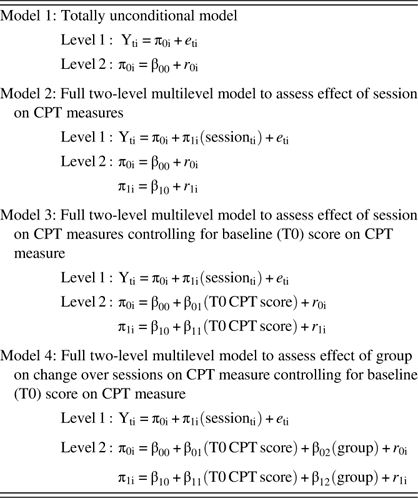
Note. Session was centered at baseline; T0 score on CPT measure was grand-mean centered.
Procedure
Testing of the BC patients occurred at baseline, after recovery from surgery but before commencement of chemotherapy (T0), and after every chemotherapy cycle (T1–T6). The number of chemotherapy cycles varied from one patient to the next, depending on her treatment regimen, and ranged between four and eight (those who received eight chemotherapy cycles were re-tested after every second cycle). Intertest interval (12 to 58 days) depended on chemotherapy schedule and complications that delayed or prevented treatment. Whenever possible, testing was performed 1 week or less before the next chemotherapy cycle to minimize the impact of acute side effects of the previous cycle of treatment. Every effort was made to test a patient and her matched control at the same intervals.
Typically, the index patient was tested first and so the intertest intervals were known. In no case did the intertest interval of a BC patient and her matched control differ by more than 2 days. The full assessment battery included a computerized cognitive battery (CNS Vital Signs; CNS-VS) (Gualtieri & Johnson, Reference Gualtieri and Johnson2006), a brief battery of traditional neuropsychological tests, and questionnaires addressing perceived cognitive function, mood, fatigue, and constitutional symptoms. The CNS-VS includes measures of processing speed, working memory, verbal memory, visual memory, and executive function that have been modeled after traditional neuropsychological tests.
Measures
Objective cognitive measures.
Scores from the four-part CPT on the CNS-VS served as dependent variables in the current analyses. This test is intended as a measure of sustained attention, working memory and information processing speed. Part 1 is a simple RT task in which the respondent is instructed to press the space bar with her dominant hand as soon as any stimulus (different shapes of different colors) appears on the screen. In Part 2, the respondent is asked to respond to a particular target stimulus (a given shape of a given color) but not to others. Part 3 is a “1-back” task in which the subject is instructed to respond to a stimulus only if it is identical to the immediately preceding one. Part 4 is a “2-back” task in which the participant is instructed to respond to a stimulus only when it is identical to the one that appeared two screens earlier. Only correct hits were analyzed. Data from Part 2 were not used as there were not enough targets to yield a reliable measure of IIV. There are 16 targets (i.e., potential correct responses) in each of Parts 1, 3, and 4. There was marked intra- and interindividual variability in RT on trial 16 on all parts in all sessions (perhaps because responding was not always constrained by the presentation of a new target) and so only responses 1–15 were used. The four-part CPT was administered on an IBM “Thinkpad” laptop computer that controlled stimulus presentation and timing. Responses were recorded with millisecond resolution.
The simplest index of within-task inconsistency is the intraindividual standard deviation (ISD). However, there are often differences in average level of performance across groups of interest and, in such cases, greater IIV may simply reflect the fact that one group has longer RTs than another. Groups might also differ in terms of systematic trial effects. For example, RTs could become systematically faster across trials due to learning or practice, or systematically slower due to boredom or fatigue. It is conceivable that these trial effects could differ between groups, for example, within a given test session, neurologically compromised groups might be more susceptible to cognitive fatigue or less able to benefit from practice than controls, resulting in greater or lesser IIV, respectively.
Some investigators regard these more systematic trial effects as a confound and, rather than using raw RT, they use standardized residual regression scores from which systematic effects of trial and mean group RT have been partialled out (i.e., raw RT is regressed on group, trial, and the group × trial interaction and the resulting standardized residuals are used in place of the raw RT values in calculating the ISD) (Hultsch et al., Reference Hultsch, MacDonald, Hunter, Levy-Bencheton and Strauss2000, Reference Hultsch, MacDonald and Dixon2002; Yao et al., Reference Yao, Rich, Tannock, Seruga, Tirona and Bernstein2016). We have elected not to use this approach for three reasons. First, we take the position that IIV attributable to these more systematic trial effects is integral to the phenomenon of interest. Second, in calculating the residuals for this approach, investigators typically enter multiple values on the dependent variable (RT for each trial in the task) for a single individual, violating an assumption of standard regression that values of the dependent variable are independent (as the data are nested, one should perform HLM rather than standard regression, treating trial as the repeated measure). Third, our study differs from most other studies of IIV in that it is a “one within, one between” design in which our primary outcome of interest is the group difference in change in IIV over multiple sessions, not the group difference in IIV at a singular test session. Thus, even if there were group differences in terms of systematic trial effects, this would be largely controlled for by the within-subjects aspect of our comparisons.
We chose instead to use the coefficient of variation (CV), a normalized measure of consistency computed by dividing each individual’s ISD by her average score on the task. The CV has been shown to be reliable, only moderately correlated with speed and accuracy measures (i.e., non-redundant), and virtually unaffected by practice (Flehmig et al., Reference Flehmig, Steinborn, Langner, Scholz and Westhoff2007). Only correct responses on the 15 target trials were used in deriving the CV. The CV was calculated by dividing the standard deviation of RTs (on correct target trials on a given part of the CPT on a given session) by the mean RT on those same trials for each individual. Thus, there were three CV values per participant per session, one for each part of the CPT. Change across sessions in mean RT across trials (speed), as well as number of correct hits (accuracy), for each individual on each CPT task were also analyzed.
Subjective cognitive measure.
Subjective cognitive function was assessed using Version 3 of the Functional Assessment of Cancer Therapy Cognitive Scale (FACT-Cog) (Wagner, Sweet, Butt, Lai, & Cella, Reference Wagner, Sweet, Butt, Lai and Cella2009). The FACT-Cog is a 37-item self-report measure addressing memory, attention, and language that has been validated for use with cancer patients. Each item is rated on a 5-point Likert scale from 0 (never, not at all) to 5 (several times a day, very much). Subscales from the FACT-Cog include Perceived Cognitive Impairments, Perceived Cognitive Abilities, Comments from Others (to assess how the respondent feels others perceive her cognitive ability), and Impact on Quality of Life. We summed across the four subscales to obtain a total score. Higher scores indicate better functioning.
Data Analysis
Latency scores from trials 1–15 were surveyed for implausible values that were likely to represent accidental key presses or interruption of the task (≤150 ms or ≥4000 ms, as per Yao et al., Reference Yao, Rich, Tannock, Seruga, Tirona and Bernstein2016, Reference Yao, Rich, Tirona and Bernstein2017. Only three additional data points were omitted on the basis of implausibility. All dependent variables were then checked (separately by variable and by group) to determine if they were normally distributed. Both mean RT and CV RT values were positively skewed, reflecting the fact that there is a lower limit to response speed but no upper limit (Flehmig et al., Reference Flehmig, Steinborn, Langner, Scholz and Westhoff2007). Therefore, a square-root transformation was applied to normalize the distribution of these variables. After transformation, outliers were identified using SPSS and winsorized by replacing them with the mean plus or minus 3 × the interquartile range. Only 3 CV RT values and 7 mean RT values out of some 2500 values were winsorized in this manner. Reducing outlier values in this manner lowers variability and thus constitutes a conservative approach to data management.
Hierarchical linear modeling (HLM), using two-level multi-level growth models for longitudinal data, was used to assess change in accuracy, mean RT, and CV RT across assessment sessions. Advantages of HLM include its ability to reliably model varying numbers and spacing of assessments across respondents (because it uses maximum likelihood to estimate slopes and intercepts) and its relative freedom (compared with analysis of variance, for example) from restrictive assumptions regarding issues such as sphericity and heteroscedasticity (Singer & Willett, Reference Singer and Willett2003). Separate HLM analyses were run for each of the three parts of the CPT, resulting in nine different analyses (accuracy, mean RT, and CV RT for each of CPT Parts 1, 3, and 4). The two-level models were set up with session (i.e., chemotherapy cycle T0–T6 uncentered) at level 1 and participants at level 2.
We took a sequential approach to model building such that a completely unconditional base model was run first, then a basic growth model, then a model including baseline score on the dependent variable as a level-2 covariate (in the event that initial status on that variable might influence the change parameter), and, finally, a model including group as an independent variable (at level 2). See Table 1 for a summary of our approach to model-building. The deviance statistic (D) for these nested models was subtracted and evaluated against a chi-square distribution in which the degrees of freedom were based on the difference in number of parameters estimated by each model. HLM analyses were conducted using HLM software (v. 7.01). Full maximum likelihood method of estimation was used in all cases. All other analyses were conducted using SPSS (v. 24). Type I error rate was set at 0.05.
RESULTS
Table 2 lists demographic features of the groups, as well as treatment information for the BC patients. The groups did not differ with respect to age or educational classification. Table 3 contains the means and standard deviations (of raw scores) for accuracy, mean RT, and CV RT on Parts 1, 3, and 4 of the CNS-VS CPT for BC patients and healthy controls at all test sessions. Table 4 contains the results of the final multilevel model (Model 4) for accuracy (number of correct hits), mean RT, and CV RT for Parts 1, 3, and 4 of the CNS-VS CPT. The expanded Table 4 in the supplementary online materials shows the results of all of the HLM models. Comparison of the deviance statistics from these nested models reveals that the addition of session and of the baseline CPT score significantly improved model fit in virtually all analyses (with the exception of adding session in the analysis of CV RT for Part 3).
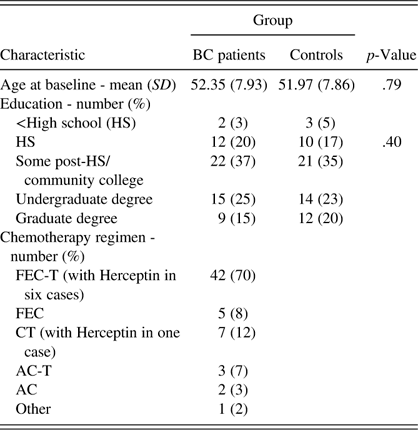
Table 2 Demographic and treatment characteristics of the sample

Note. SD=standard deviation; FEC=5-fluourouracil, epirubicin, cyclophosphamide; FEC-T=FEC plus taxotere; CT=cyclophosphamide plus taxotere; AC=adriamycin and cyclophosphamide; AC-T=AC plus paclitaxel; Other=carboplatin, taxotere, Avastin, and Herceptin.
Sample characteristics have been previously published (Collins et al., Reference Collins, Mackenzie, Tasca, Scherling and Smith2013).
Table 3 Means and SDs for accuracy (# correct hits), mean RT, and CV RT from scores on Parts 1, 3, and 4 of the CNS-VS CPT for BC patients and healthy controls at all test sessions (T0-T6)
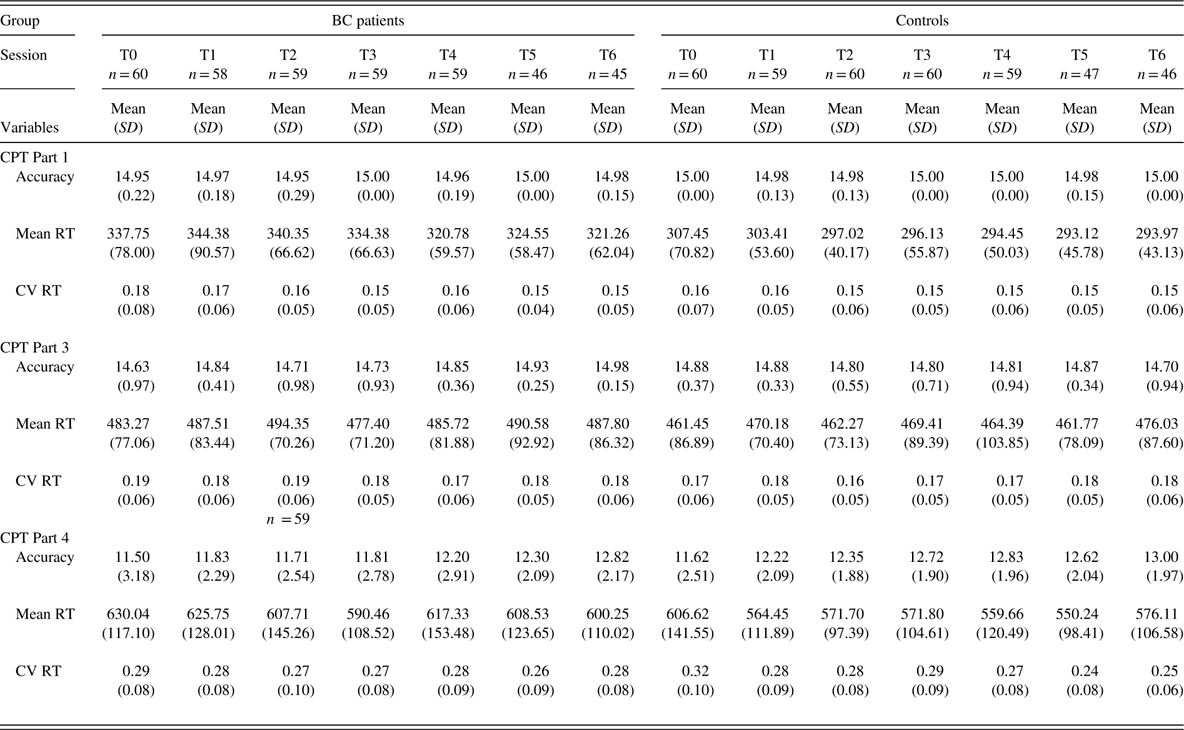
Note. T0 refers to pre-treatment baseline testing; T1 – T6 refer to testing sessions following first to sixth chemotherapy treatment.
RT=reaction time; CV=coefficient of variation; CNS-VS=CNS Vital Signs; CPT=Continuous Performance Test; BC=breast cancer; SD=standard deviation.
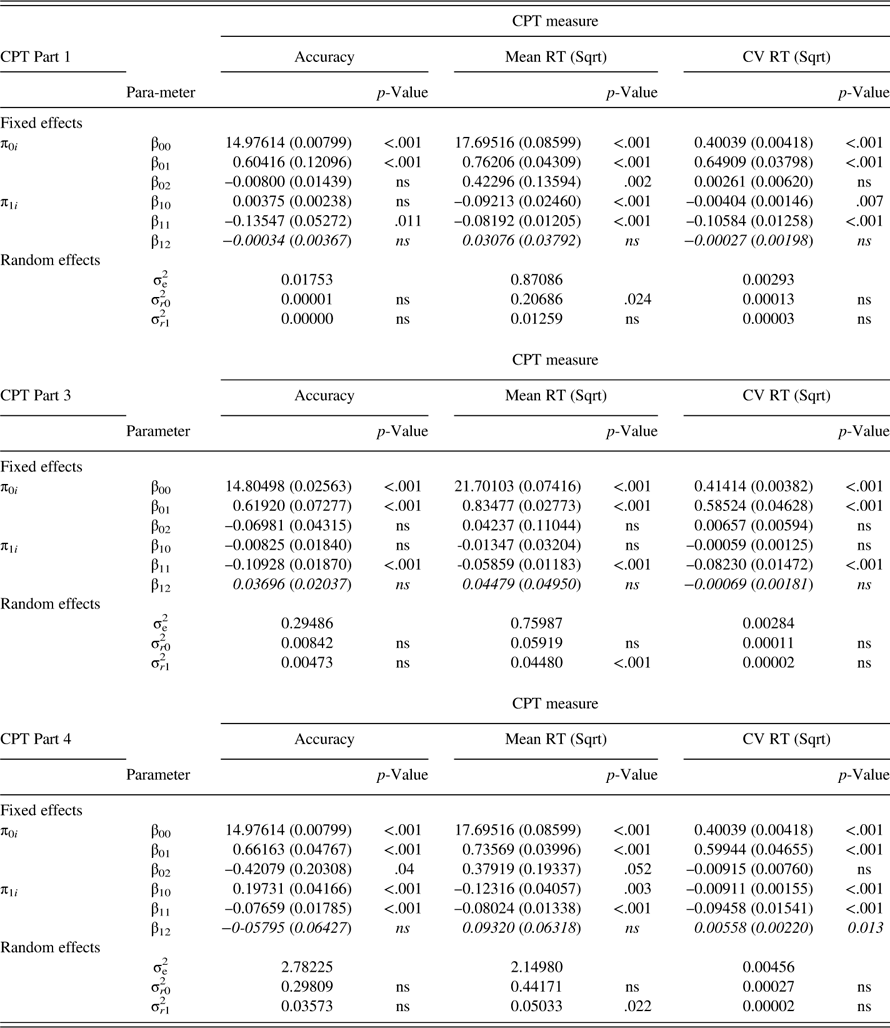
Table 4 Results of final multilevel model (Model 4) for accuracy (number of correct hits), mean RT, and CV RT for CNS-VS CPT Parts 1, 3, and 4

Note. Standard error appears in parentheses. Data in italics reflect the group × session interaction. CNS-VS=CNS-Vital Signs; CPT=Continuous Performance Test; ns=non-significant. Parameters: π0i =estimated individual score when “session”=0 (i.e., intercept); π1 i =estimated within person slope; β 00=estimated mean value for all individuals when session=0 (intercept) (controlling for T0 CPT and group); β 01=effect of T0 CPT score on the intercept (controlling for group); β 02=effect of group on the intercept (controlling for T0 CPT); β 10=estimated mean slope for all individuals (controlling for T0 CPT and group); β 11=effect of T0 CPT score on the slope (controlling for group); β 12=effect of group on the slope (controlling for T0 CPT); σe 2=level one (within individual) residual (error term); σ r0 2=level 2 (between person) residual for the intercept; σ r1 2=level 2 (between person) residual for the slope.
Accuracy
As evident in Table 4, there was no change in the number of correct hits (accuracy) across sessions and no group difference with respect to change in accuracy over time on Part 1 or Part 3 of the CPT. On Part 4, there was a significant increase in correct hits across sessions in the sample as a whole (p<.001), but no difference between groups with respect to this improvement in accuracy.
Mean RT
Table 4 further indicates that mean RT significantly declined across sessions on Part 1 (p<.001) and Part 4 (p=.003) in the sample as a whole (the overall slope of Part 3 was not significantly different from zero), but there were no group differences in the trajectory of mean RT on any CPT condition.
CV RT
There was no change in CV across sessions on Part 3 of the CPT in the full sample, nor was there any group difference in the trajectory of change on Part 3 of the CPT (see Table 4). The slope of CV was significantly negative on Part 1 (p=.007) and Part 4 (p<.001), indicating that IIV declined across sessions in the sample as a whole. On Part 4 (only), this decline was significantly greater in the controls than in the BC patients (p=.013). The effect of adding group to the latter model, in terms of improvement in model fit, was large (Pseudo-R 2 =0.33). The group-by-session interaction on Part 4 of the CPT is depicted in Figure 1.
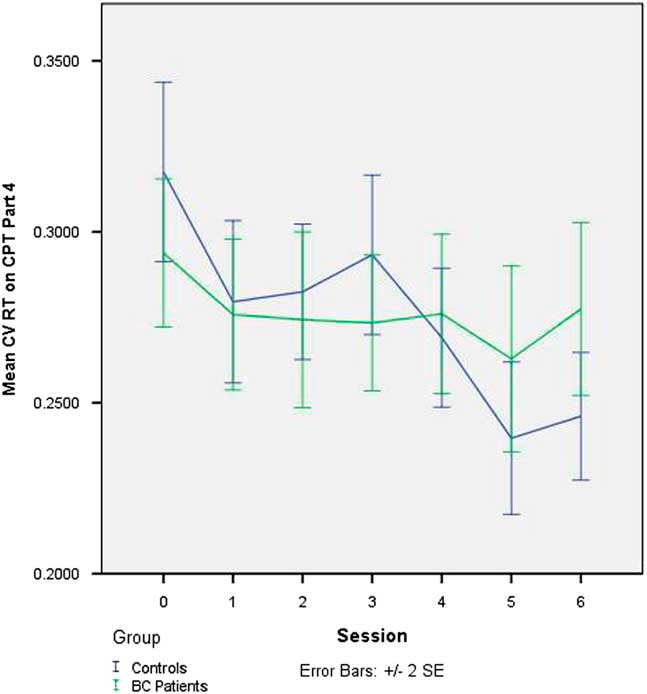
Fig. 1 Change in intraindividual variability in RT (CV RT) on CNS-VS CPT - Part 4 (“2-back” working memory task) over seven testing sessions in BC patients undergoing chemotherapy and matched healthy controls. CV=coefficient of variation; RT=reaction time; CNS-VS=CNS Vital Signs; CPT=Continuous Performance Test; BC=breast cancer
Relationship Between CV RT and FACT-Cog
We wanted to examine whether, given its greater sensitivity to change than mean RT or accuracy measures, CV RT on the 2-back task might show some association with subjective report. To that end, we added FACT-Cog total score as a time-varying (i.e., Level 1) covariate to the full HLM model with CV RT on Part 4 as the dependent variable. We found no relationship between FACT-Cog and Part 4 CV RT in the sample as a whole (t 1,116=−1.25; p=.21) nor any group difference in this relationship (t 1,116=1.22; p=.23).
DISCUSSION
The current results show that there is increasing consistency in response speed with practice on a demanding working memory task among healthy individuals but that this practice effect is significantly attenuated in BC patients undergoing chemotherapy. We have previously reported, on data originating from the same study, that mean scores on composite measures in various cognitive domains (including processing speed) were sensitive to cognitive decline in the BC patients (Collins et al., Reference Collins, Mackenzie, Tasca, Scherling and Smith2013). However, in the current analyses which were confined to data from a single task (the CPT), no significant group differences in mean RT or in number of correct hits were observed, suggesting that variability in speed of responding on a cognitive test may be a more sensitive indicator of mild neural dysfunction than conventional speed and accuracy measures. Including the baseline score on the dependent variable in our statistical models did not eliminate the group difference in IIV trajectory, suggesting that this group effect was not due to different starting points.
As evident from inspection of Table 3 and Figure 1, it is not that the BC patients become less consistent on the 2-back task over sessions but, rather, that they do not show the improvement in consistency that is demonstrated by the healthy controls. This observation parallels the findings from the main study which showed that cognitive test performance did not decline in the BC patients over the course of chemotherapy but rather, that it did not improve across repeated testing to the extent seen in the controls. One interpretation of this finding is that the usual positive practice effect is attenuated in BC patients. An alternative way of conceptualizing this is that the lesser improvement in the BC patients reflects the net effect of two opposing forces, a positive practice effect and an adverse cognitive effect of chemotherapy. Both conceptualizations suppose that chemotherapy is exerting a subtle adverse impact on cognition. These findings underscore the importance of including a control group even when using a longitudinal, repeated measures study design.
In keeping with the findings of previous studies in BC patients (Bernstein et al., Reference Bernstein, Catton and Tannock2014; Yao et al., Reference Yao, Rich, Tannock, Seruga, Tirona and Bernstein2016, Reference Yao, Rich, Tirona and Bernstein2017), the group-by-time interaction in IIV in our study only emerged under more complex task conditions. The dependency of the IIV effect on task complexity has also been reported in studies of normal aging, wherein the increase in IIV on complex tasks is thought to be due to a breakdown in executive systems that control competing pathways to maintain task goals across time (Duchek et al., Reference Duchek, Balota, Tse, Holtzman, Fagan and Goate2009; Jackson, Balota, Duchek, & Head, Reference Jackson, Balota, Duchek and Head2012; Stuss, Murphy, Binns, & Alexander, Reference Stuss, Murphy, Binns and Alexander2003). The fact that Part 4 of our CPT task entails much greater regulation of attention than the other task conditions is consistent with this line of thinking, as is the frequent finding that executive functioning is one of the cognitive domains most likely to be affected in BC patients (Bernstein, McCreath, Komeylian, & Rich, Reference Bernstein, McCreath, Komeylian and Rich2017; Hodgson, Hutchinson, Wilson, & Nettelbeck, Reference Hodgson, Hutchinson, Wilson and Nettelbeck2013; Ono et al., Reference Ono, Ogilvie, Wilson, Green, Chambers, Ownsworth and Shum2015).
Integrity of the frontal lobes is critical to executive functioning and it has been demonstrated that patients with focal frontal lobe lesions are much more likely than patients with non-frontal lesions to show disturbances in IIV (Stuss et al., Reference Stuss, Murphy, Binns and Alexander2003). There are extensive connections between the frontal lobes and other brain regions and white matter lesions that disconnect nodes in these broader “frontal networks” can disrupt both executive functions and IIV (Duchek et al., Reference Duchek, Balota, Tse, Holtzman, Fagan and Goate2009; Jackson et al., Reference Jackson, Balota, Duchek and Head2012). Recent studies using diffusion tensor imaging and functional MRI techniques have demonstrated white matter alterations in BC patients that correlate with performance on objective cognitive tests (Deprez, Billiet, Sunaert, & Leemans, Reference Deprez, Billiet, Sunaert and Leemans2013). This confluence of findings suggests that the attenuated improvement in IIV over time observed in our BC patients may reflect diminished integrity of white matter in frontal systems and ensuing disruption of executive control functions.
Most studies of cancer-related cognitive impairment find little correlation between objective and subjective measures of cognitive function. One explanation that has been advanced for this is that traditional cognitive tests are not sensitive enough to detect the typically subtle cognitive changes experienced by patients with non-central nervous system cancers cancers. We hypothesized that, if IIV were more sensitive than mean RT or accuracy measures to the cognitive changes experienced by cancer patients, IIV might also correlate more strongly with subjective report measures. Current results did not bear this out, suggesting that objective and subjective cognitive measures are capturing different phenomena and that both should be included in cancer-cognition studies.
Means and standard deviations tend to be highly correlated, and so it is important to establish that differences in IIV are not simply a function of differences in response speed. We addressed this by using the CV rather than the ISD. Furthermore, the controlled longitudinal design of our study (in which we compared BC patients and controls in terms of change over sessions) allowed us to differentiate systematic within-person changes over time (i.e., practice effects) from changes that reflect inconsistency of performance.
Other strengths of this study include the individual matching of the controls to the BC patients in terms of demographics and assessment schedule, the very low rates of attrition and missing data, and the sensitivity and robustness of the statistical procedures used (i.e., HLM). Wojtowicz et al. (Reference Wojtowicz, Berrigan and Fisk2012) found that residualized ISDs that controlled for trial as well as group membership were more sensitive than CVs in revealing greater IIV on RT tasks in patients with multiple sclerosis compared to healthy controls. The fact that we detect group differences in IIV between the cancer patients and the healthy controls using CV may reflect the power of HLM coupled with the fact that we are looking at group differences in change in IIV across multiple sessions (i.e., a group-by-time interaction) rather than a static between-group comparison.
Limitations to these analyses must also be acknowledged. Foremost among these is the relatively small number of trials analyzed in each condition of the CPT (n=15), which may impact the reliability of the findings. Another limitation derives from the fact that these are secondary data analyses and that neither the hypotheses of the present work nor the analytic methods were pre-specified (see Gelman & Loken, Reference Gelman and Loken2013 for a discussion of these issues). We have generated nine models examining nine different dependent variables (CV, mean RT, and accuracy on each of the three parts of the CPT). Given the post hoc and exploratory nature of these analyses, and the fact that the original study was not powered for them, we did not apply any correction for the multiple statistical tests performed (had we applied a Bonferroni correction, for example, we would not have obtained significant findings). We recognize the inflated risk of Type 1 error associated with this approach and the fact that the current results require confirmation in future studies, designed and powered specifically to address the hypotheses advanced here.
It might be argued that a further limitation to this study is the lack of a cancer control group, as required to tease apart the cognitive effects of cancer from those of cancer treatment. This is not as great a concern in longitudinal studies in which the patients serve as their own controls in many respects and the primary purpose of the control group is to account for practice effects associated with repeated testing. Furthermore, whereas isolating the effects of treatment was precisely the objective of the main study from which these data were drawn (hence, the use of a dose-response design to try to establish causality), the objective of the current work was to investigate whether IIV might be more sensitive than traditional measures to subtle cancer-related cognitive changes, regardless of the cause of those changes.
Another limitation of the current analyses is that they do not address the ecological validity of these findings, that is, whether or not the differences in IIV are related to real-life behavior or symptoms and, if so, whether the relationship is positive or negative. Li et al. (Reference Li, Aggen, Nesselroade and Baltes2001) point out that increases in IIV may be adaptive in some instances; for example, they may reflect exploration and testing of strategies in the context of new or complicated tasks. We plan to address this issue in future studies by determining if and how measures of IIV correlate with level of performance on other cognitive tasks or with the time required to master a new task. We are also interested in examining relationships between IIV and findings on structural and functional brain MRI and between IIV and subjective cognitive measures in an effort to better understand the implications and neural underpinnings of the current results.
Results of these analyses serve as an important reminder that traditional neuropsychological measures may not be sine qua non for the detection of neural dysfunction. We agree with Stuss et al. (Reference Stuss, Murphy, Binns and Alexander2003) that predictability and consistency may be as important as accuracy to success in real-life tasks and, given the current findings, we submit that assessment of stability in cognitive performance may be a worthwhile adjunct to traditional neuropsychological evaluation, especially in the case of elusive cognitive disorders such as cancer-related cognitive impairment.
ACKNOWLEDGMENTS
This research was made possible by an operational grant provided by the Canadian Breast Cancer Foundation – Ontario Chapter. We thank the women who volunteered as participants, as well as the oncologists, nurses, and support staff at the Ottawa Hospital Cancer Centre for their support. Statement of Originality: This manuscript reports secondary analyses of data from a previously published study. Portions of these analyses were presented in poster format at the American Academy of Clinical Neuropsychology Conference, Chicago, USA in June, 2016. Conflict of Interest: The authors have no conflicts of interest.
SUPPLEMENTARY MATERIAL
To view supplementary material for this article, please visit https://doi.org/10.1017/S1355617718000309