


Introduction
Executive functions refer to a constellation of cognitive abilities that allow us to engage in goal-oriented behavior. They include the ability to generate and organize thought, to think flexibly, to mentally manipulate information, to self-monitor, and to adjust behavior as appropriate to the current context (Cummings & Miller, Reference Cummings and Miller2007; Lezak, Howieson, Bigler, & Tranel, Reference Lezak, Howieson, Bigler and Tranel2012). Deficits in executive functions are prominent in a multitude of neurological conditions, including Alzheimer's disease (Bondi et al., Reference Bondi, Jak, Delano-Wood, Jacobson, Delis and Salmon2008), frontotemporal dementia (Possin et al., Reference Possin, Feigenbaum, Rankin, Smith, Boxer, Wood and Kramer2013; Torralva et al., Reference Torralva, Kipps, Hodges, Clark, Bekinschtein, Roca and Manes2007), Parkinson's disease (Muslimovic, Post, Speelman, & Schmand, Reference Muslimovic, Post, Speelman and Schmand2005), Huntington's disease (Peinemann et al., Reference Peinemann, Schuller, Pohl, Jahn, Weindl and Kassubek2005), multiple sclerosis (Parmenter, Shucard, & Shucard, Reference Parmenter, Shucard and Shucard2007), traumatic brain injury (Caeyenberghs et al., Reference Caeyenberghs, Leemans, Leunissen, Gooijers, Michiels, Sunaert and Swinnen2012; McDonald, Flashman, & Saykin, Reference McDonald, Flashman and Saykin2002), brain tumors (Correa, Reference Correa2010), and vascular disease of the brain (Hayes, Donnellan, & Stokes, Reference Hayes, Donnellan and Stokes2012; Sachdev et al., Reference Sachdev, Brodaty, Valenzuela, Lorentz, Looi, Wen and Zagami2004). Executive dysfunction can devastate a patient's level of functioning (Farias et al., Reference Farias, Cahn-Weiner, Harvey, Reed, Mungas, Kramer and Chui2009), predicting functional decline beyond memory or global cognition (Boyle, Paul, Moser, & Cohen, Reference Boyle, Paul, Moser and Cohen2004; Cahn-Weiner et al., Reference Cahn-Weiner, Farias, Julian, Harvey, Kramer, Reed and Chui2007). Executive functions rely heavily on the integrity of the frontal lobes, which represent over 30% of the cortical surface of the brain and play a major role in the organization of behavior and cognition (Clark, Cools, & Robbins, Reference Clark, Cools and Robbins2004; Diamond, Reference Diamond2002; Rolls, Reference Rolls2004; Stuss & Levine, Reference Stuss and Levine2002). The intactness of posterior cortical structures such as the parietal lobes (Champod & Petrides, Reference Champod and Petrides2010; Yin et al., Reference Yin, Zhao, Xu, Evans, Fan, Ge and Liu2012), deep gray matter (e.g., dorsal head of the caudate nucleus and the thalamus; Little et al., Reference Little, Kraus, Joseph, Geary, Susmaras, Zhou and Gorelick2010; Provost, Petrides, & Monchi, Reference Provost, Petrides and Monchi2010; Schmahmann & Pandya, Reference Schmahmann and Pandya2008; Van der Werf et al., Reference Van der Werf, Scheltens, Lindeboom, Witter, Uylings and Jolles2003), and the cerebellum (Stoodley & Schmahmann, Reference Stoodley and Schmahmann2010) are also necessary for good executive control.
Despite the high frequency of executive dysfunction in neurological disorders and its impact on daily living, executive deficits are rarely measured comprehensively or consistently. This is often true of clinical trials, which vary in their selection of executive measures or do not include them at all, even when the treatment targets cognitive disorders with prominent executive dysfunction (Brown et al., Reference Brown, Buckner, O'Fallon, Iturria, Brown, O'Neill and Shaw2003; Coles et al., Reference Coles, Twyman, Arnold, Cohen, Confavreux, Fox and Compston2012; Vercelletto et al., Reference Vercelletto, Boutoleau-Bretonniere, Volteau, Puel, Auriacombe, Sarazin and Lacomblez2011; Willmott & Ponsford, Reference Willmott and Ponsford2009). For example, using the search term: frontotemporal dementia on www.clinicaltrials.gov brings back 14 studies that investigate therapeutic pharmaceutical agents for the treatment of frontotemporal dementia. Of those 14, 10 include standardized neuropsychological measures of cognition, while only four include specific measures of executive function, with inconsistent selection (Clinicaltrials.gov Identifier: NCT00545974; NCT00127114; NCT00604591; NCT00187525). There remains a compelling need to have a battery of executive function tests that can be routinely integrated into neurobehavioral research and that will reliably and validly measure constructs that clinical investigators agree are important. The NIH EXAMINER battery was developed to address this need.
The NIH EXAMINER generates 11 indices to capture important aspects of executive functions including inhibition, set-shifting, working memory, and fluency. Verbal, visual, and spatial stimuli are used. The “Executive Composite” is calculated to summarize performance across the 11 indices. It has excellent reliability (test–retest = .93; Reference Kramer, Mungas, Possin, Rankin, Boxer, Rosen and WindmeyerKramer et al., this issue) and provides a comprehensive estimate of an individual's executive functions that is not specific to a single test or type of stimuli. Although sometimes measures of discreet executive functions are indicated, the Executive Composite could be useful for research and clinical applications when a global and reliable estimate of executive function is needed, for example, in clinical trials.
We investigated the validity of the NIH EXAMINER Executive Composite score via two studies. In Study 1, we investigated the ecological validity of the Executive Composite with an informant-based measure of real-world executive behavior, the Frontal Systems Behavior Scale™ (FrSBe) (Grace & Malloy, Reference Grace and Malloy2001), in a sample of patients with a variety of neurological disorders and neurologically healthy controls. The FrSBe has been validated as a measure of executive behavior by several studies (Basso et al., Reference Basso, Shields, Lowery, Ghormley, Combs, Arnett and Johnson2008; Chiaravalloti & DeLuca, Reference Chiaravalloti and DeLuca2003; Hellmuth et al., Reference Hellmuth, Mirsky, Heuer, Matlin, Jafari, Garbutt and Boxer2012; Lane-Brown & Tate, Reference Lane-Brown and Tate2009; Malloy & Grace, Reference Malloy and Grace2005; Malloy, Tremont, Grace, & Frakey, Reference Malloy, Tremont, Grace and Frakey2007; Velligan, Ritch, Sui, DiCocco, & Huntzinger, Reference Velligan, Ritch, Sui, DiCocco and Huntzinger2002). The Composite was considered to have good ecological validity if it was a significant predictor of the FrSBe in regression models. In Study 2, we investigated the neuroanatomical correlates of the Executive Composite using voxel-based morphometry in a sample of patients with neurodegenerative disease and control participants to determine if the Composite correlated with brain volumes in regions known to be important for executive control.
Method
Study 1: Ecological Validity
Participants
All participants from the NIH EXAMINER validation sample who were administered the Trail Making Test (Reitan, Reference Reitan1955), the Stroop Test (Kramer et al., Reference Kramer, Jurik, Sha, Rankin, Rosen, Johnson and Miller2003), and the FrSBe, and who were 18 years of age or older, were included in “Study 1: Concurrent Validity.” The sample included 136 patients with neurological disorders and 89 neurologically healthy controls (HC). Fifty-four patients were diagnosed with a neurodegenerative disorder by a board-certified neurologist using probable research criteria, as follows: Alzheimer's disease (N = 24; AD) (McKhann et al., Reference McKhann, Knopman, Chertkow, Hyman, Jack, Kawas and Phelps2011), behavioral variant frontotemporal dementia (N = 17; bvFTD) (Rascovsky et al., Reference Rascovsky, Hodges, Knopman, Mendez, Kramer, Neuhaus and Miller2011), Parkinson's disease (N = 7; PD), progressive supranuclear palsy (N = 3; PSP) (Litvan et al., Reference Litvan, Agid, Calne, Campbell, Dubois, Duvoisin and Zee1996), and Huntington's disease (N = 3; HD). The HD patients showed unequivocal motor signs with genetic confirmation of the disease. Thirty-one patients were diagnosed with mild cognitive impairment (Winblad et al., Reference Winblad, Palmer, Kivipelto, Jelic, Fratiglioni, Wahlund and Petersen2004). Thirty suffered a focal lesion due to ischemic stroke, tumor, or focal injury at least 3 months before participation, and 15 suffered a moderate to severe traumatic brain injury as defined by a Glasgow Coma Scale <12 at least 6 months before testing. Five patients were diagnosed with multiple sclerosis (Polman et al., Reference Polman, Reingold, Edan, Filippi, Hartung, Kappos and Wolinsky2005). On average, the patients and the controls were similar in age (patients: 65 ± 18, HC: 64 ± 19), p = .66, and years of education (patients: 15.4 ± 2.7, HC: 15.6 ± 3.0), p = .67; however, there were more females in the control group (56%) than the patient group (41%), p = .03 (Table 1). Participants were evaluated at six separate sites: Mayo Clinic Alzheimer's Disease Research Center (N = 85), University of California – San Francisco Memory and Aging Center (N = 68), University of Iowa (N = 38), University of Texas Southwestern Medical Center (N = 29), University of California – Davis (N = 4), and University of Colorado – Denver (N = 1). Neurologically healthy controls underwent neurological and cognitive screening to verify health status. Patients and controls were excluded if they had current major psychiatric illness or substance abuse disorder, ongoing cancer treatment, known HIV, or history of metabolic abnormalities, major systemic medical illness, traumatic brain injury with >30 min loss of consciousness, seizure disorder, or diagnosis of developmental learning disability. For both Study 1 and Study 2, written informed consent was obtained from each participant or their legal guardian (with assent from the participant) before testing. The study was approved by the committees on human research of the respective institutions and was completed in accordance with the Helsinki Declaration.
Table 1 Study 1: Demographic characteristics and executive scores by diagnostic group

Note. Values represent mean (standard deviation).
Ed = Education; EC = Executive Composite; FrSBe = Frontal Systems Behavior Scale; HC = healthy control; MCI = mild cognitive impairment; Lesion = focal lesion due to stroke; AD = Alzheimer's disease; bvFTD = behavioral variant frontotemporal dementia; TBI = traumatic brain injury; PD = Parkinson's disease; MS = multiple sclerosis; PSP = progressive supranuclear palsy; HD = Huntington's disease.
Executive Function Assessment
Participants were administered the NIH EXAMINER battery in a quiet room using a standard 15.4-inch Dell Latitude D830 laptop. The tests and the methods for generating the Executive Composite are described in Reference Kramer, Mungas, Possin, Rankin, Boxer, Rosen and WindmeyerKramer et al. (this issue). The Trail Making Test and the Stroop test are widely used executive measures (Rabin, Barr, & Burton, Reference Rabin, Barr and Burton2005) and were administered during the same session. Completion time on Trails B and number correct on the Stroop Interference condition were used to operationalize executive performance on these tests. To evaluate for real-world executive behavior, the FrSBe was completed by an informant who knew the participant well, in most cases the spouse or other close relative, either in-person during the visit or at home and then sent back by mail. Total raw scores were used to operationalize real-world executive behavior.
Data analysis
Statistical analyses were performed using PASW 17.0 for Windows (SPSS Inc., Chicago, IL). Using hierarchical regression, we evaluated how well the Executive Composite predicts real-world executive behavior after accounting for the variance explained by age and gender. Next, we performed a second regression to evaluate whether the Executive Composite predicts real-world executive behavior after accounting for variance predicted by Trails B, Stroop, age, and gender. To address the possible confounding effects of motor dysfunction, the regressions were repeated after removing patients diagnosed with Parkinson's disease, multiple sclerosis, progressive supranuclear palsy, or Huntington's disease. All p values less than .05 were considered to be significant.
Study 2: Neuroanatomical Correlates
Participants
MRI data were available on a sample of 18 patients and 19 HCs evaluated at the UCSF Neuroscience Imaging Center. The patients included eight patients diagnosed with bvFTD, six patients diagnosed with PSP, three patients diagnosed with AD, and one patient diagnosed with MCI using the same research criteria as in Study 1. The combined patients and the controls did not differ significantly in age, gender, or education, all p values > .05 (Table 2).
Table 2 Study 2: Demographic characteristics, Mini Mental State Exam scores, Clinical Dementia Rating Scale scores, and Executive Composite scores by diagnostic group

Note. Values represent mean (standard deviation).
MMSE = Mini Mental State Examination; CDR-G = Clinical Dementia Rating Scale Global Score; CDR-Box = Clinical Dementia Rating Scale Box Score; EC = Executive Composite; HC = healthy control; bvFTD = behavioral variant frontotemporal dementia; AD = Alzheimer's disease; PSP = progressive supranuclear palsy; MCI = mild cognitive impairment.
An additional sample of 50 healthy age-matched normal controls was used to create a template for inter-subject normalization and voxel-based morphometry.
Neuroimaging data acquisition
MRI scans were obtained on all Study 2 participants using a 3.0 Tesla Siemens (Siemens, Iselin, NJ) TIM Trio scanner equipped with a 12-channel head coil. Whole brain images were acquired using volumetric magnetization prepared rapid gradient-echo sequence (MPRAGE; TR/TE/TI = 2300/2.98/900 ms; α = 9°). The field of view was 240 × 256 mm, with 1 × 1 mm in-plane resolution and 1 mm slice thickness.
Voxel-based morphometry
We investigated the neuroanatomical correlates of the Executive Composite. Structural T1 images were corrected for bias field, segmented into gray matter, white matter, and cerebrospinal fluid, and initially normalized into Montreal Neurological Institute (MNI) space using the Unified Segmentation procedure (Ashburner & Friston, Reference Ashburner and Friston2005) implemented in SPM 5 (Friston, Ashburner, Kiebel, Nichols, & Penny, Reference Friston, Ashburner, Kiebel, Nichols and Penny2007), running under MATLAB 8.0. More anatomically precise inter-subject registration was then performed with the DARTEL toolbox (Ashburner, Reference Ashburner2007) by warping each subject's image to a template created from the 50 normal control subjects. Modulated gray and white matter probability maps were scaled by Jacobians, smoothed to a Gaussian kernel of 8 mm full-width at half maximum, then summed together to obtain a map of brain parenchyma (Wilson et al., Reference Wilson, Henry, Besbris, Ogar, Dronkers, Jarrold and Gorno-Tempini2010).
The Executive Composite was correlated voxel-wise with the summed gray and white matter probabilities for the 37 subjects as a single group using the voxel-based lesion-symptom mapping toolbox (Bates et al., Reference Bates, Wilson, Saygin, Dick, Sereno, Knight and Dronkers2003); neuroling.arizona.edu/resources.html). Statistical maps were thresholded at voxelwise p < .001 and then corrected for multiple comparisons by permutation analysis. Statistical maps were calculated for 1000 random assignments of normally distributed behavioral scores to patients, with the maximum cluster size recorded each time. The fifth percentile maximum cluster size was 454 mm3, so applying this as the minimum cluster size ensured corrected significance of p < .05. Age and total intracranial volume were included as nuisance covariates in all VBM analyses.
Two secondary VBM analyses were conducted with all subjects except those with bvFTD, and then with all subjects except those with PSP. The purpose of these analyses was to determine whether our primary VBM findings were specific to either of our largest diagnostic groups; that is, if the findings were no longer significant with either bvFTD or PSP removed. This was important because PSP patients display motor dysfunction and because bvFTD and PSP are each associated with characteristic patterns of atrophy. BvFTD causes atrophy in medial and orbital prefrontal cortex that extends to lateral prefrontal cortex with disease progression; early targets also include insula, medial temporal, and striatal–thalamic structures (Seeley et al., Reference Seeley, Crawford, Rascovsky, Kramer, Weiner, Miller and Gorno-Tempini2008). PSP causes atrophy of supplementary motor area, premotor cortex, caudate, thalamus, anterior insula, and brainstem (Whitwell et al., Reference Whitwell, Duffy, Strand, Machulda, Senjem, Gunter and Josephs2012). By emphasizing only findings that are significant in both of these secondary VBMs, we reduce the impact of any one diagnostic group. We restricted our secondary analyses within a mask of our full sample results thresholded at voxelwise p < .05 with permutation correction and thresholded clusterwise at p < .05. For each of these two analyses within this mask, statistical maps were thresholded at voxelwise p < .001 with permutation correction, and then a clusterwise threshold of p < .05 was applied, which was 495 voxels for the analysis without the bvFTD subjects and 499 voxels without the PSP subjects.
Results
Study 1: Ecological Validity
The regression model with age, gender, and the Executive Composite entered as predictors significantly predicted real-world executive behavior, F(3,221) = 33.43, p < .001, (Table 3). Using hierarchical regression, the Executive Composite accounted for 28% of the variance in FrSBe scores beyond age and gender, p < .001. When Trails B and Stroop scores were entered simultaneously with age and gender, the Executive Composite remained a significant predictor, p < .001, predicting an additional 4% of the variance after accounting for the other covariates (Table 4). Trails B was also a significant unique predictor, p = .001, but the Stroop did not predict significant unique variance, p = .44.
Table 3 Regression results predicting FrSBe scores from age, gender, and the Executive Composite

FrSBe = Frontal Systems Behavior Scale; CI = confidence interval.
Table 4 Regression results predicting FrSBe scores from age, gender, Trails B, Stroop, and the Executive Composite

FrSBe = Frontal Systems Behavior Scale; CI = confidence interval.
These regressions were repeated after removing patients with motor dysfunction from the sample. The Executive Composite accounted for 27% of the variance in FrsBe scores beyond age and gender, p < .001, and 5% of the variance beyond Trails B, Stroop, age, and gender, p < .001.
Study 2: Neuroanatomical Correlates
Lower Executive Composite scores were associated with smaller brain volumes covering a large extent of frontal regions in a lateral and medial pattern. The largest and most significant cluster included the bilateral superior, middle, and inferior frontal gyri, the supplementary motor area, the precentral gyrus, and the anterior and middle cingulate. This cluster extended to the left rolandic operculum, the left postcentral gyrus, the left superior temporal gyrus, the brainstem, and the bilateral anteroventrolateral thalamus. Smaller volumes of the right and left cerebellum were also associated with lower Executive Composite scores (Table 5).
Table 5 Neuroanatomical correlates of the Executive Composite in the full sample

Note. Results were thresholded at voxelwise p < .001 and corrected for multiple comparisons by permutation analysis. Cluster size was thresholded at p < .05; only clusters greater than 454 mm3 were considered significant. MNI coordinates for the clusters are the center of the mass, whereas MNI coordinates for the regions are the local maxima.
MNI = Montreal Neurological Institute.
To determine whether the neuroanatomical correlates were specific to bvFTD or PSP, the analyses were repeated twice, once with the bvFTD subjects removed (Table 6) and once with the PSP subjects removed (Table 7). Regions that were significant across all three analyses were one cluster in the right middle and superior frontal gyri that extended into the inferior frontal gyrus and middle cingulate, and one cluster in the left middle frontal gyrus that extended into the inferior frontal gyrus. This overlap of the three analyses is depicted in Figure 1.
Table 6 Neuroanatomical correlates of the Executive Composite without the bvFTD subjects

Note. Results were thresholded at voxelwise p < .001 and corrected for multiple comparisons by permutation analysis. Cluster size was thresholded at p < .05; only clusters greater than 495 mm3 were considered significant. MNI coordinates for the clusters are the center of the mass, whereas MNI coordinates for the regions are the local maxima.
MNI = Montreal Neurological Institute; bvFTD = behavioral variant frontotemporal dementia.
Table 7 Neuroanatomical correlates of the Executive Composite without the PSP subjects

Note. Results were thresholded at voxelwise p < .001 and corrected for multiple comparisons by permutation analysis. Cluster size was thresholded at p < .05; only clusters greater than 495 mm3 were considered significant. MNI coordinates for the clusters are the center of the mass, whereas MNI coordinates for the regions are the local maxima.
MNI = Montreal Neurological Institute; PSP = progressive supranuclear palsy.
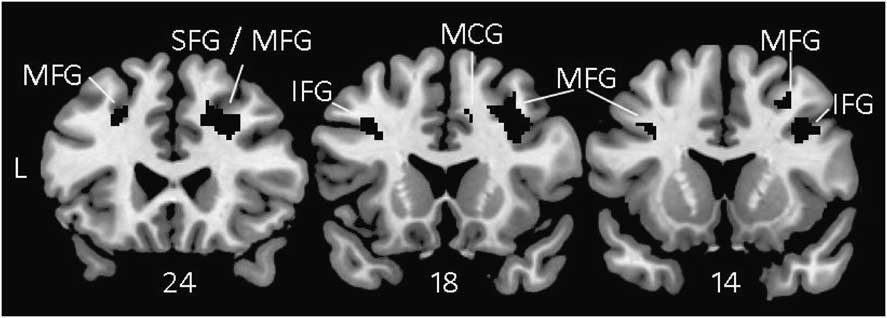
Fig. 1 Voxel-based morphometry showing brain regions where atrophy correlated with lower scores on the Executive Composite consistently across all three analyses: Full sample (Table 5), No bvFTD (Table 6), and No PSP (Table 7). These results are not specific to any one diagnostic group. All results were thresholded voxelwise at p < .001 and corrected for multiple comparisons using permutation analysis with p < .05. MFG = middle frontal gyrus; SFG = superior frontal gyrus; IFG = inferior frontal gyrus; MCG = middle cingulate gyrus; PSP = progressive supranuclear palsy.
Discussion
We investigated the concurrent validity and neuroanatomical correlates of the NIH EXAMINER Executive Composite score. The Executive Composite was a robust predictor of real-world executive behavior, even after accounting for performance on the commonly used executive function tests Trails B and Stroop. Poor performance on the Executive Composite correlated with atrophy in brain regions important for executive control, including the right middle and superior frontal gyri and the left middle frontal gyri.
The Executive Composite is measured using objective testing, and the FrSBe is an informant-based rating scale. These methods have different limitations as measures of behavior. Objective testing captures the patient's behavior during one structured visit and may not capture intermittent behaviors or behaviors that emerge in less structured environments. Informant scales can address these limitations, but are dependent on the quality of the informant's report. Because the Executive Composite and the FrSBe use distinct methods, their shared variance can be attributed to a shared construct. The unique contribution of the Executive Composite to FrSBe after accounting for performance on Trails B and Stroop indicates that the Composite is sensitive to components of executive function not tapped by these classic measures. Additional research will be needed to evaluate the Executive Composite's validity beyond other executive measures, such as measures of planning.
We did not control for speed in the Executive Composite, Trails B, or Stroop because speed is closely related to executive functions (Salthouse, Reference Salthouse2005). The purpose of this study was to validate a measure that is optimally sensitive to executive functions, and controlling for speed would have removed meaningful variance. The analyses were repeated after removing patients diagnosed with disorders that cause motor dysfunction, and a similar pattern of results was found, suggesting that the relationship to real-world executive behavior was not driven by motor dysfunction.
The Executive Composite scores correlated with brain volume in regions important for executive control. In the full sample, the largest extent of the correlations was in the lateral and medial aspects of the frontal lobes bilaterally. Thalamic volumes corresponding to the ventral anterior and ventrolateral nuclei were also significant; these are regions important for higher cognitive and motor functions via circuits with the frontal lobes (Royall et al., Reference Royall, Lauterbach, Cummings, Reeve, Rummans, Kaufer and Coffey2002). Correlations with the supplementary motor area, the precentral gyrus, the midbrain and dorsal pons, and the cerebellum might reflect the speeded measures included in the composite score. The extent of correlations with the cerebellum subsumed subregions important for cognitive, sensorimotor, and limbic functions (Stoodley & Schmahmann, Reference Stoodley and Schmahmann2010). Volumes of the left superior temporal and the left postcentral gyri were the only temporal and parietal regions to reach significance. The limited extent of correlations within posterior regions could be explained by the multi-faceted nature of the Executive Composite. That is, posterior regions important for fundamental cognitive skills such as processing verbal or visual information were central to some tasks but not others, and so the impact of these brain regions on the multi-domain composite was diminished. These findings suggest that the multi-domain Executive Composite may emphasize higher-level processes not specific to any one domain. It is also likely that the lack of significant correlations with posterior regions reflects the atrophy patterns of the patient sample. Atrophy patterns in PSP and bvFTD are frontally predominant (Seeley et al., Reference Seeley, Crawford, Rascovsky, Kramer, Weiner, Miller and Gorno-Tempini2008; Whitwell et al., Reference Whitwell, Duffy, Strand, Machulda, Senjem, Gunter and Josephs2012). If we had included a sample of subjects with greater posterior disease, our findings may have been different. The extent to which the present findings generalize to other patient samples will need to be tested in future research.
To minimize the specific impact of bvFTD or PSP atrophy patterns on the neuroanatomical correlates, we repeated the voxel-based morphometry analyses once with the bvFTD patients removed and once with the PSP patients removed. Voxels that were significant in the full sample and in these subsidiary analyses were primarily in the right middle and superior frontal gyri and the left middle frontal gyri, but also in the right and left inferior frontal gyri and the right middle cingulate (Figure 1). We are most confident that these regions were important for Executive Composite performance irrespective of diagnosis. Prefrontal lesions have been associated with real world executive behavior decrements as measured by the FrSBe (Reference Robinson, Calamia, Glascher, Bruss and TranelRobinson, Calamia, Glascher, Bruss, & Tranel, this issue), suggesting a common neural mechanism for executive impairments on testing and in everyday life.
The NIH EXAMINER Executive Composite is a single score that represents performance across 11 indices of executive functions including measures of inhibition, set-shifting, fluency, and working memory that rely to varying degrees on verbal, spatial, or visual stimuli. In this study, we found that the Executive Composite is a robust predictor of executive behavior in the real world and correlates with atrophy in frontal brain regions important for executive control. The Executive Composite is not the appropriate choice for all clinical and research questions about executive functions, for example, when time is limited (it is based on a 30-min test battery) and a shorter test like Trails B is adequate. Furthermore, differential diagnosis and inferences about affected brain function is often better guided by the separate evaluation of discreet executive functions. It is, however, an appropriate choice when a single comprehensive score with high reliability, sensitivity to real-world executive dysfunction, linear measurement across the ability spectrum, or multiple alternate forms is needed.
Acknowledgments
This work was supported by NINDS (J.K., HHSN271200623661C); NIA (K.P., K23AG037566), (J.K., P01AG019724 and P50AG023501); and by the Hellman Family Foundation (K.P.). We thank Stephen Wilson, Ph.D., for his guidance on the voxel-based morphometry methods, and our research participants for their generous time and efforts. We have no conflicts of interest to report.


