Introduction
Cognitive assessment is crucial for the detection of Alzheimer’s disease (AD) and for the differential diagnosis of other types of dementia, such as frontotemporal dementia (FTD) (Fields et al., Reference Fields, Ferman, Boeve and Smith2011). Comprehensive assessment of cognition and behaviour has clinical implications for patient care, regarding the available treatment options, survival expectancy, competency to drive or provide informed consent, ability to live independently at home, the carer’s burden, and quality of life (Hsieh et al., Reference Hsieh, McGrory, Leslie, Dawson, Ahmed, Butler and Hodges2015). However, in hectic clinical settings, briefer cognitive screening methods are often the test of choice, with patients with more complex needs or diagnostic uncertainties being referred for full neuropsychological assessment (Hsieh et al., Reference Hsieh, McGrory, Leslie, Dawson, Ahmed, Butler and Hodges2015).
Addenbrooke’s Cognitive Examination-Revised (ACE-R) and the embedded Mini-Mental State Examination (MMSE) are the predominant brief screening tests for dementia in the Greek population, with administration times of approximately 15 and 5 min, respectively (Konstantinopoulou et al., Reference Konstantinopoulou, Kosmidis, Ioannidis, Kiosseoglou, Karacostas and Taskos2011). Both of them were designed to briefly examine a wide range of cognitive domains: attention, memory, language, visuospatial components, and verbal fluency (Mioshi et al., Reference Mioshi, Dawson, Mitchell, Arnold and Hodges2006). ACE-R aids in the detection, differentiation, and monitoring of cognitive decline in dementia syndromes, such as FTD and AD (Hsieh et al., Reference Hsieh, Hodges, Leyton and Mioshi2012; Kipps et al., Reference Kipps, Nestor, Dawson, Mitchell and Hodges2008; Mathew et al., Reference Mathew, Bak and Hodges2011; Raimondi et al., Reference Raimondi, Gleichgerrcht, Richly, Torralva, Roca, Camino and Manes2012).
However, ACE-R has several limitations (Hsieh et al., Reference Hsieh, Schubert, Hoon, Mioshi and Hodges2013), for example, healthy adults repeatedly fail on the verbal repetition item, which might be a result of hearing problems or distraction (Hsieh et al., Reference Hsieh, Schubert, Hoon, Mioshi and Hodges2013; Valcour et al., Reference Valcour, Masaki and Blanchette2002), and ceiling effects have been observed in the measure of comprehension (Brugnolo et al., Reference Brugnolo, Nobili, Barbieri, Dessi, Ferro, Girtler and Servetto2009). Acknowledging these weaknesses led to the development of Addenbrooke’s Cognitive Examination-III (ACE-III). While the ACE-III does not incorporate MMSE, it continues to assess the same five cognitive domains, with new items in verbal repetition and language comprehension tasks, while backward spelling was replaced by serial 7 s subtraction (Brugnolo et al., Reference Brugnolo, Nobili, Barbieri, Dessi, Ferro, Girtler and Servetto2009; Ganguli et al., Reference Ganguli, Ratcliff, Huff, Belle, Kancel, Fischer and Kuller1990; Hsieh et al., Reference Hsieh, Schubert, Hoon, Mioshi and Hodges2013; Valcour et al., Reference Valcour, Masaki and Blanchette2002).
ACE-III has been validated against extensive neuropsychological tests (Hsieh et al., Reference Hsieh, McGrory, Leslie, Dawson, Ahmed, Butler and Hodges2015; Hsieh et al., Reference Hsieh, Schubert, Hoon, Mioshi and Hodges2013). However, even ACE-III, which demands 15–20 min to administer, has been suggested to be excessive for some busy clinical settings (Hsieh et al., Reference Hsieh, McGrory, Leslie, Dawson, Ahmed, Butler and Hodges2015). Mini-Addenbrooke’s Cognitive Examination (M-ACE) was subsequently developed, which appears to be more sensitive and specific than its widely used precursor, MMSE (Hsieh et al., Reference Hsieh, McGrory, Leslie, Dawson, Ahmed, Butler and Hodges2015; Folstein et al., Reference Folstein, Folstein and Fanjiang2001).
The Edinburgh Cognitive and Behavioural Amyotrophic Lateral Sclerosis (ALS) Screen (ECAS) was recently developed (Abrahams et al., Reference Abrahams, Newton, Niven, Foley and Bak2014) and adapted for the Greek (Kourtesis et al., Reference Kourtesis, Christidi, Margioti, Demenega, Rentzos, Evdokimidis and Abrahams2019), Italian (Poletti et al., Reference Poletti, Solca, Carelli, Madotto, Lafronza, Faini and Doretti2016), German (Lule et al., Reference Lulé, Burkhardt, Abdulla, Böhm, Kollewe, Uttner and Ludolph2015), Chinese (Ye et al., Reference Ye, Ji, Li, He, Liu and Fan2016), and Spanish (Mora et al., Reference Mora, Salas, Fernández, Rodríguez-Castillo, Marín, Chaverri and Rodríguez-Santos2018) populations. ECAS is also a brief assessment similar to ACE-III, but it was designed for patients with various motor impairments and was found to be sensitive in ALS, Parkinson’s disease, and progressive supranuclear palsy (Foley et al., Reference Foley, Niven, Paget, Bhatia, Farmer, Jarman and Abrahams2018; Niven et al., Reference Niven, Newton, Foley, Colville, Swingler, Chandran and Abrahams2015; Strong et al., Reference Strong, Abrahams, Goldstein, Woolley, Mclaughlin, Snowden and Rosenfeld2017). ECAS has been specifically designed to detect the type of cognitive and behavioural impairment in ALS of an executive nature similar to that found in FTD. ECAS comprises an ALS-specific component (executive function and social cognition, verbal fluency, and language) and a carer’s interview to detect the behavioural and psychotic changes typical in FTD. This focus on executive functions distinguishes ECAS from ACE-III. However, the ECAS was also designed to assess the functions typically affected in other diseases common in older adults, such as AD, and therefore it includes an ALS Non-Specific segment (memory and visuospatial function) (Foley et al., Reference Foley, Niven, Paget, Bhatia, Farmer, Jarman and Abrahams2018; Niven et al., Reference Niven, Newton, Foley, Colville, Swingler, Chandran and Abrahams2015; Strong et al., Reference Strong, Abrahams, Goldstein, Woolley, Mclaughlin, Snowden and Rosenfeld2017). We have previously demonstrated that the ALS Non-Specific score is highly sensitive and specific in identifying the cognitive changes typical of AD and helps differentiate AD from ALS (Kourtesis et al., Reference Kourtesis, Christidi, Margioti, Demenega, Rentzos, Evdokimidis and Abrahams2019).
This study aimed to adapt the ACE-III and M-ACE and to examine their convergent validity against their predecessors, ACE-R and MMSE, in a Greek population. Moreover, our primary aim was to compare these screening tools (ACE-III, M-ACE, ACE-R, MMSE, and ECAS) in detecting AD in a Greek population.
Methods
Participants
All the participants and their carers signed an informed consent form in compliance with the revised Declaration of Helsinki (1987). This study was approved by the Psychology Research Ethics Committee of the University of Edinburgh, as well as the Aeginition Hospital Ethics Committee. All the participants were native Greek speakers and free from the following: (1) psychiatric disorders; (2) psychoactive drugs, antidepressants, and anticonvulsants; (3) other neurological conditions affecting cognition; (4) learning disabilities; (5) alcoholism and drug abuse; and (6) uncontrolled systemic diseases.
Patients with AD
The attendants of the Maroussi Alzheimer Clinic of the Athens Association of Alzheimer Disease and Related Disorders, Athens, Greece, were employed for this study. A total of 40 patients with AD participated; a subsample has previously been described by Kourtesis et al. (Reference Kourtesis, Christidi, Margioti, Demenega, Rentzos, Evdokimidis and Abrahams2019). Recruitment was conducted in accordance with the general inclusion criteria and the following criteria specific to AD: (1) a diagnosis of AD according to the National Institute of Neurological and Communicative Disorders and Stroke/Alzheimer’s Disease and Related Disorders Association (NINCDS-ADRDA) (McKhann et al., Reference McKhann, Drachman, Folstein, Katzman, Price and Stadlan1984) and (2) the absence of mixed concomitant dementia processes (e.g. AD and vascular dementia). In addition, a neuropsychologist or psychiatrist interviewed the patients and administered the Hospital Anxiety and Depression Scale (HADS) (Zigmond & Snaith, Reference Zigmond and Snaith1983) (cut-off ≥ 8) to exclude patients with major depression or anxiety symptoms that may compromise their performance. The duration of the disease was calculated in years, from the onset of the first symptoms to the testing date.
Healthy Subjects
In this study, 38 controls were recruited and matched in age, sex, and education to the patient group. They belonged to one of the following categories: (1) members of Athens Association of Alzheimer Disease and Related Disorders, Athens, Greece; (2) relatives of patients with AD; or (3) volunteers who responded to the calls of the above association. For recruitment, we implemented the aforementioned general inclusion criteria.
Procedures
Translation–Adaptation
Adaptation of ACE-III and embedded M-ACE required minor adjustments as the administration (e.g. instructions) of the majority of the tasks was similar to that of ACE-R. The most significant adjustment, in terms of translation, was in the section of language in the task of proverb repetition, in which the pronunciation of proverbs is required. In terms of pronunciation, the first item should be a low-difficulty proverb (i.e. ‘All that glitters is not gold’) and the second item should be a medium-to-hard-difficulty proverb (i.e. ‘A stitch in time saves nine’). The proverbs of the Greek version were culturally adjusted, and the counterparts of this difficulty measure were ‘All that glitters is not gold’ and ‘Better donkey-tying than donkey-seeking’. The original version of ACE-III (in which the M-ACE is embedded) was adapted to the Greek language using the back-translation method. The original English version was translated into Greek by a native Greek speaker fluent in English and then it was translated back into English by a native speaker of both Greek and English who was also blind to the original version of ACE-III. The procedure of translation/back translation was successful in only two iterations as there were mainly minor amendments compared to ACE-R. Finally, the adaptation of ECAS in Greek was described by Kourtesis et al. (Reference Kourtesis, Christidi, Margioti, Demenega, Rentzos, Evdokimidis and Abrahams2019).
Administration of the Tests and Inter-Rater Reliability
Administration of the tests was randomised to control for a possible practice effect (Benedict & Zgaljardic, Reference Benedict and Zgaljardic1998). Inter-rater reliability was calculated between the scores for ACE-III and M-ACE provided by the assessors and the independent reviewer. The four assessors and the independent reviewer were trained equally in the administration and scoring of ACE-III and M-ACE based on relevant guidelines. The independent reviewer was blinded to the identity of the examiner as well as the examinee.
Statistical Analyses
Bayesian statistics were preferred over null hypothesis significance testing (NHST). The Bayesian factor (BF10) has been found to be more parsimonious than the p-value in evaluating evidence against H0 (Cox & Donnelly, Reference Cox and Donnelly2011; Held & Ott, Reference Held and Ott2018; Wagenmakers et al., Reference Wagenmakers, Love, Marsman, Jamil, Ly, Verhagen and Meerhoff2018a; Wagenmakers et al., Reference Wagenmakers, Marsman, Jamil, Ly, Verhagen, Love and Matzke2018b). Importantly, the difference between BF10 and p-values is even greater (in favour of BF10) in small sample sizes, which is pertinent to the present study (Held & Ott, Reference Held and Ott2018; Wagenmakers et al., Reference Wagenmakers, Love, Marsman, Jamil, Ly, Verhagen and Meerhoff2018a; Wagenmakers et al., Reference Wagenmakers, Marsman, Jamil, Ly, Verhagen, Love and Matzke2018b). A larger BF10 postulates more evidence in support of H1 (Cox & Donnelly, Reference Cox and Donnelly2011; Held & Ott, Reference Held and Ott2018; Marsman & Wagenmakers, Reference Marsman and Wagenmakers2017; Wagenmakers et al., Reference Wagenmakers, Love, Marsman, Jamil, Ly, Verhagen and Meerhoff2018a; Wagenmakers et al., Reference Wagenmakers, Marsman, Jamil, Ly, Verhagen, Love and Matzke2018b). In this study, a threshold of BF10 ≥ 10 was set for statistical inference, which postulates strong evidence in favour of H1 (Marsman & Wagenmakers, Reference Marsman and Wagenmakers2017; Wagenmakers et al., Reference Wagenmakers, Love, Marsman, Jamil, Ly, Verhagen and Meerhoff2018a; Wagenmakers et al., Reference Wagenmakers, Marsman, Jamil, Ly, Verhagen, Love and Matzke2018b) and corresponds to a p-value of <.01 (e.g. BF10 = 10) or to a p-value of <.001 (e.g. BF10 > 11) (Cox & Donnelly, Reference Cox and Donnelly2011; Held & Ott, Reference Held and Ott2018). However, we report both BF10 and p-values in this study. Finally, BF10 allows evidence in either direction (i.e. towards H1 and H0), and its measurement of evidence is insensitive to the stopping rule, which substantially mitigates the multiple comparisons problem and generates reliable and more generalisable results (Dienes, Reference Dienes2016; Marsman & Wagenmakers, Reference Marsman and Wagenmakers2017; Wagenmakers et al., Reference Wagenmakers, Marsman, Jamil, Ly, Verhagen, Love and Matzke2018b).
The inter-rater reliability between the assessors who administered the screening procedures and the independent interviewer was appraised using the intraclass correlation coefficient (ICC), which displays outcomes from ‘no match’ = 0 to ‘seamless match’ = 1 (Weir, Reference Weir2005). The internal consistency of the Greek ACE-III and M-ACE was determined by calculating Cronbach’s alpha coefficient. A Cronbach’s alpha coefficient of .70 or greater is considered substantial (Nunnaly, Reference Nunnally1994). Demographic and cognitive data were analysed and compared. Shapiro–Wilk’s test revealed non-significant results (i.e. normal distribution) for every variable. Between-group comparisons were made using Bayesian independent samples t-tests. The convergent validity of the screening tools was examined in the whole sample (N = 78, i.e. HC = 38 + AD = 40). The convergent validity and associations between the screening tools were probed and quantified using Bayesian Pearson’s correlation analysis to ensure that our results are more reliable and generalisable. Receiver operating characteristic (ROC) curve analyses and area under the curve (AUC) were implemented to appraise the psychometric properties of the screening methods. All statistical analyses were performed using SPSS Statistics v.24.0 (scale, ROC and AUC analyses) (Release, 2016; IBM Corp., Armonk, NY, USA) and JASP v.0.8.1.2 (Bayesian Pearson’s correlation analyses and Bayesian independent samples t-tests) (JASP Team, 2017). Finally, a post hoc analysis (i.e. the achieved statistical power) of the Bayesian Pearson’s correlations (i.e. the convergent validity of the screening methods) was performed using G × Power (Faul et al., Reference Faul, Erdfelder, Lang and Buchner2007; Faul et al., Reference Faul, Erdfelder, Buchner and Lang2009).
Results
Inter-Rater Reliability and Internal Consistency
The inter-rater reliability demonstrated an almost seamless agreement between the assessors, indicating substantial suitability for clinical measures (Weir, Reference Weir2005). An ICC value of .92 was found for ACE-III and M-ACE (Weir, Reference Weir2005). The scale analyses demonstrated excellent internal consistency of ACE-III and M-ACE with Cronbach’s alpha = .79 (Nunnaly, Reference Nunnally1994). We also inspected the internal consistency of ACE-III by replacing the repetition task of the culturally adjusted proverbs with the repetition task of phrases in ACE-R. The internal consistency of ACE-III with the repetition task of phrases (ACE-R) dropped to .77, indicating that the new repetition task of culturally adjusted proverbs contributed to the improvement of the internal consistency of ACE-III.
Convergent Validity
The Bayesian Pearson’s correlation analyses robustly supported the convergent validity of ACE-III and M-ACE, as well as ECAS and its subscores, by indicating a large effect size (i.e. Pearson’s r varied from .845 to .976), highly significant p-values (i.e. p < .0001), highly extreme evidence of the Bayesian factor analysis (e.g. BF10 = 1.299e+33), and an almost perfect statistical power (i.e. ≈100%). The statistics for the Bayesian Pearson’s correlations are displayed in Table 1. ACE-III displayed a robust correlation with ACE-R. Equally, M-ACE substantially correlated with MMSE. Moreover, ECAS and its subscores significantly correlated with ACE-R.
Table 1. Convergent validity: Bayesian Pearson’s correlations
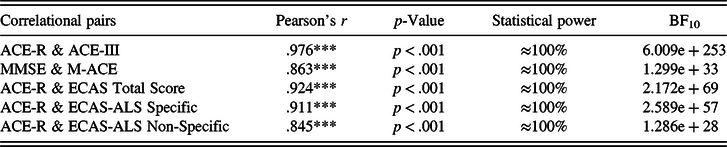
Note: BF = Bayes Factor. *BF10 > 10; **BF10 > 30; ***BF10 > 100. For post hoc statistical power, α < .001.
Sensitivity and Specificity in the Detection of AD
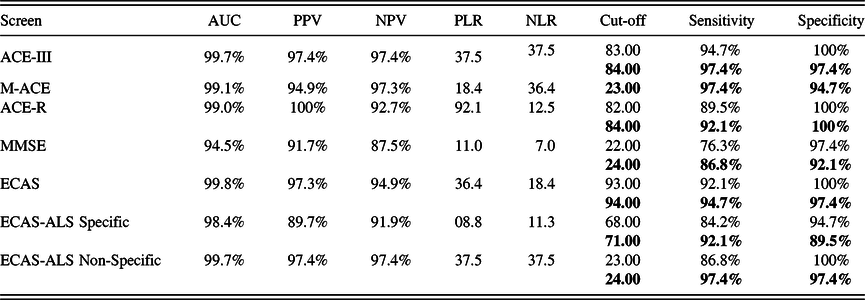
ROC and AUC analyses were executed to explore the psychometric properties of the screens in detecting AD. Figure 1 presents the ROC curves of each screen and subscore. All the tests confirmed an adequately high level of sensitivity and specificity. Additionally, the analysis computed the sensitivity and specificity respective to different cut-offs, and the optimum cut-off to determine abnormality is shown (see Table 2). The ACE-III, ECAS, ACE-R, M-ACE, and ECAS-ALS Non-Specific covered the greatest AUC.

Fig. 1. ROC curves: differentiation between patients with AD and controls.
Table 2. Sensitivity and specificity in the detection of AD

Note: AUC = area under curve; PPV = positive predictive value; NPV = negative predictive value; PLR = positive likelihood ratio; NLR = negative likelihood ratio. The current cut-offs (two SDs from the mean) are displayed first. The cut-offs with highest sensitivity or specificity are presented. The proposed cut-offs (based on optimal sensitivity and specificity values) are showed in bold. Where the current and proposed cut-offs are the same, only one value is given.
Cognitive Performance and Behavioural Changes in AD
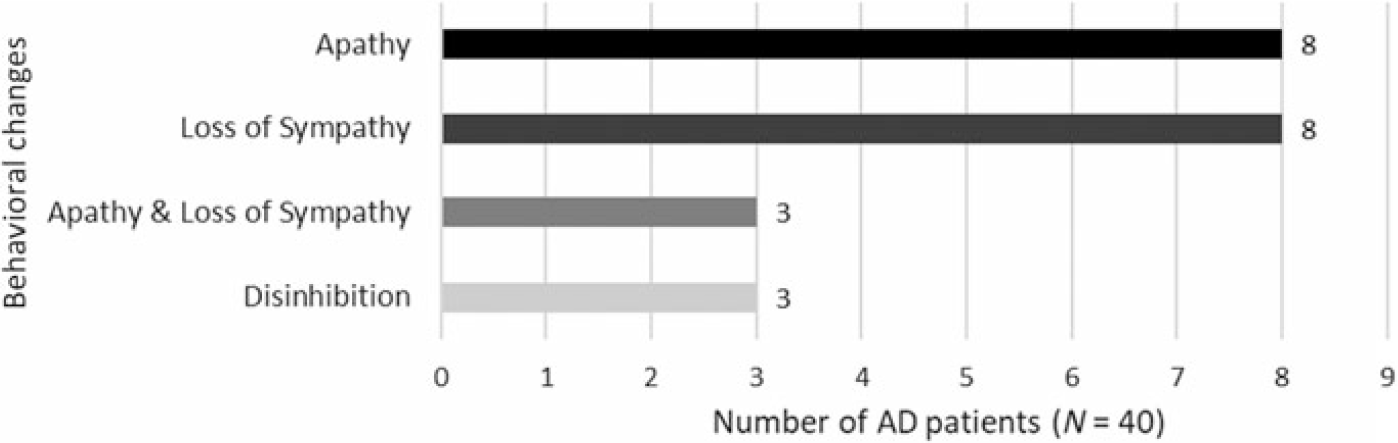
In the whole sample, there were no associations between cognitive performance and age/education. In group comparisons, patients with AD performed significantly worse than healthy controls in every test (see Table 3). In the AD sample, the HADS scores (i.e. depression and anxiety) did not correlate with cognitive performance. In addition, we examined the correlation between the screening methods and the duration of disease in the sample of patients with AD. Robust correlations with the duration of disease were detected solely with the total score of ECAS (BF10 = 14.22), whereas with the rest of the screening methods and subscores, the correlations were non-significant (see Table 4). Fourteen patients (35%) had a disease duration of less than 3 years and 26 patients (65%) had a disease duration of 3–6 years, indicating that the sample of patients were in the early and early-middle stages of AD. Furthermore, the carers of 16 out of 40 patients with AD (40%) reported behavioural changes in the ECAS Behavioural Interview. The most prominent behavioural changes were apathy and loss of sympathy with some describing disinhibition (see Figure 2), whereas none of the carers reported a behavioural change pertaining to the rest of the ECAS behavioural items (i.e. compulsion, hyperorality, and psychosis).
Table 3. Comparison between controls and patients with AD
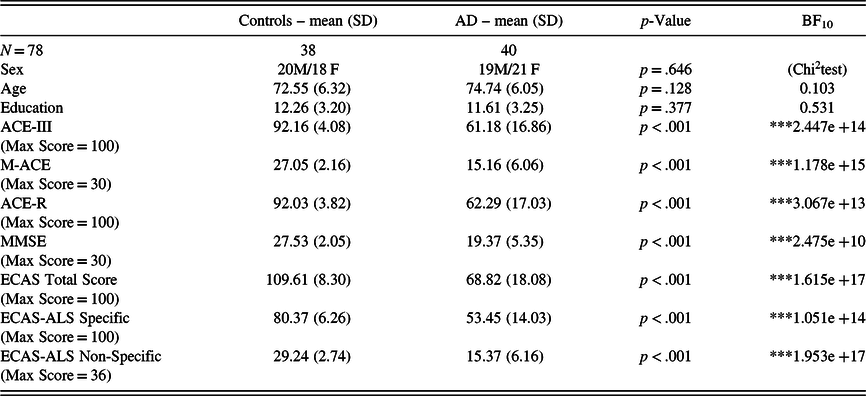
Note: SD = standard deviation; BF = Bayes factor.*BF10 > 10; **BF10 > 30; *** BF10 > 100.
Table 4. Bayesian Pearson’s correlations with the duration of disease
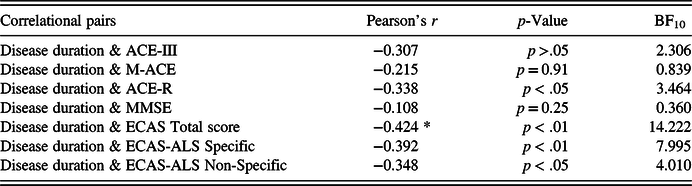
Note: BF = Bayes Factor.*BF10 > 10; **BF10 > 30; ***BF10 > 100.

Fig. 2. ECAS Behavioural Interview: behavioural changes in AD.
Ceiling Effects in the Screens
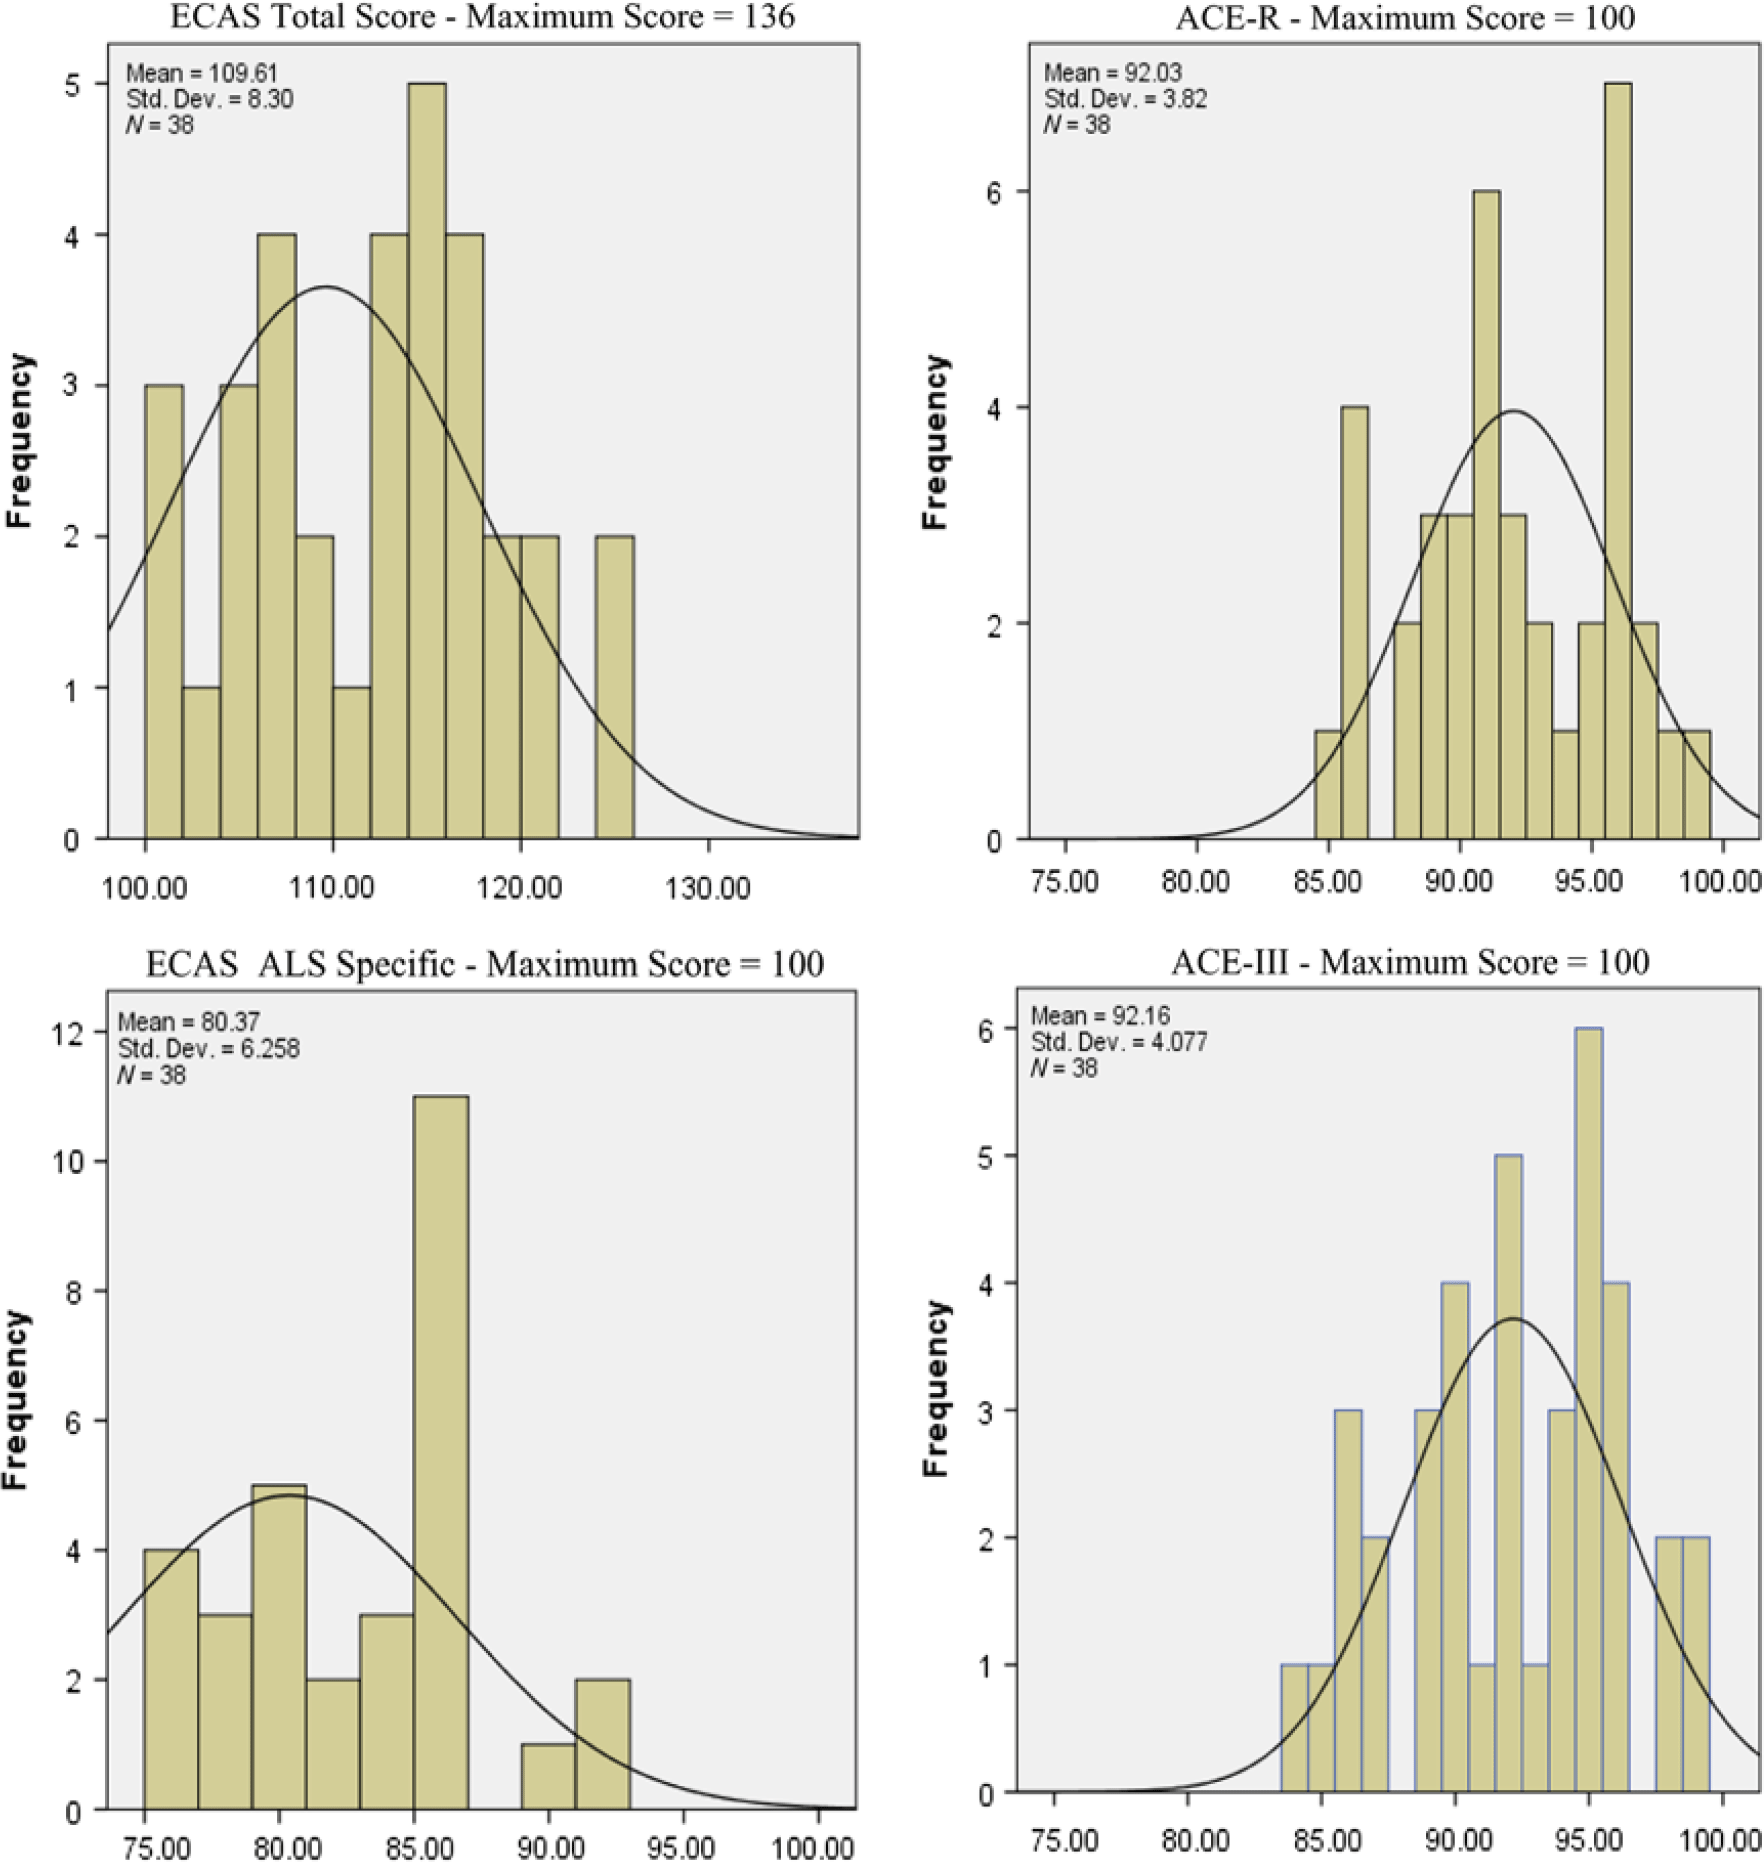
The ECAS scores appear to be substantially more resilient to ceiling effects compared to ACE-III, ACE-R (Figure 3), and M-ACE and MMSE (Figure 4). Ceiling effects in the last two short screens were pronounced (see Figures 3 and 4). Lastly, only 4 patients with AD (out of 40, i.e. 10%) failed to collect two points (i.e. maximum points) in the phrase repetition task of ACE-R, whereas 10 patients with AD (i.e. 25%) failed to collect the maximum points in the proverb repetition task of ACE-III.

Fig. 3. Distribution of healthy controls’ performance in the fourth quartile of the possible scores.

Fig. 4. Distribution of healthy controls’ performance in the third tier of the possible scores.
Discussion
The present study successfully produced the Greek versions of ACE-III and M-ACE. The tests showed robust convergent validity against the already adapted and validated Greek versions of ACE-R and MMSE as evidenced by the large effect size, the high significance of the correlations, the strong evidence of the Bayesian factor analysis, and the almost perfect statistical power. Furthermore, the screening methods exhibited substantial internal consistency, which allows for implementation in clinical and research settings (Nunnaly, Reference Nunnally1994). The tests also showed almost excellent inter-rater reliability, permitting extensive utilisation by various clinical practitioners (Weir, Reference Weir2005). Therefore, the Greek ACE-III and M-ACE can be considered as suitable tools for clinical and research purposes.
Detection of AD in a Greek Population
ACE-III elicited 94.7% sensitivity and 100% specificity at a cut-off of 83 (two SDs), as well as 97.4% sensitivity and 97.4% specificity at a cut-off of 84, in the detection of dementia within a sample pool of patients with AD who were predominantly in their first to fourth years after diagnosis. The sensitivity of ACE-III (94.7% and 97.4%) was superior to that of ACE-R (89.5% and 92.1%), demonstrating that ACE-III should be the tool of choice against ACE-R.
A comparison of M-ACE to MMSE revealed superior psychometrics in the former with 97.4% sensitivity and 94.7% specificity at a cut-off of 23 (MMSE, 86.8% sensitivity and 92.1% specificity at a cut-off of 24). The higher sensitivity and comparable specificity to MMSE are aligned with the validation study of M-ACE (Hsieh et al., Reference Hsieh, McGrory, Leslie, Dawson, Ahmed, Butler and Hodges2015). Accordingly, M-ACE surfaces as the most appropriate brief screening tool for detecting AD. M-ACE may be considered in hectic clinical environments, in which brief screening procedures are preferred.
Furthermore, the ECAS-ALS Non-Specific score was equally able to detect AD compared to the ACE-III with 97.4% sensitivity and specificity at a cut-off of 24. In addition, the ECAS-ALS Non-Specific score was substantially more specific than M-ACE but was equally sensitive. However, the sensitivity of the total score of ECAS was slightly below that of ACE-III and M-ACE although specificity was comparable. Of note, the ECAS Total score was the only score that correlated with the disease duration, indicating that it may be more sensitive to cognitive decline than the rest of the screens, although this has yet to be demonstrated. Lastly, the ECAS-ALS Specific score appears to be less sensitive and specific compared to the above screening methods, although it displayed good psychometric properties in the identification of AD.
Utility of the Screens
The Greek version of ACE-III contains a repetition task of culturally adjusted proverbs, which replaced the repetition task of phrases in ACE-R. These items appeared to contribute to the internal consistency of ACE-III and were less prone to ceiling effects in the AD group compared to the equivalent task of ACE-R. However, both tests suffered from ceiling effects in contrast to the ECAS. The ceiling effects were most pronounced in the shorter screening tools (M-ACE and MMSE), although, the former was marginally less prone than the latter, which is in line with the findings of Hsieh et al. (Reference Hsieh, McGrory, Leslie, Dawson, Ahmed, Butler and Hodges2015). However, the ECAS-ALS Non-Specific score and in particular the ECAS Total score and ECAS-ALS Specific did not suffer from ceiling effects. These findings are in line with the findings of a previous study in which ECAS was found to be substantially less dependent on IQ and produced significantly fewer ceiling effects compared to ACE-III, which may be an advantage for use with clinical groups (De Icaza Valenzuela et al., Reference De Icaza Valenzuela, Bak, Pal and Abrahams2018).
Furthermore, ACE-III does not include a behavioural assessment, which is a shortcoming (Hsieh et al., Reference Hsieh, Schubert, Hoon, Mioshi and Hodges2013). In contrast, the ECAS has a Behavioural Interview, which may add to the cognitive profile of the patient and predict caregiver’s burden. In the current study, 40% of the carers of patients with AD reported behavioural changes. The most prominent were apathy and loss of sympathy. However, the ECAS Behavioural does not assess comprehensively apathy. Apathy is considered a multidimensional construct incorporating emotional, executive, and initiation dimensions (Caga et al., Reference Caga, Hsieh, Highton-Williamson, Zoing, Ramsey, Devenney and Kiernan2018; Marin, Reference Marin1991; Radakovic & Abrahams, Reference Radakovic and Abrahams2018). Recently, the Dimensional Apathy Scale (DAS) was developed to assess these constructs (Radakovic & Abrahams, Reference Radakovic and Abrahams2014). Notably, the DAS was implemented in AD, where a heterogenous profile emerged, enabling classification into three distinct groups (Radakovic et al., Reference Radakovic, Starr and Abrahams2017). Hence, the DAS may be used in conjunction with ACE-III or ECAS in order to further identify and differentiate the types of apathy, which may be of clinical relevance.
Moreover, ACE-III and M-ACE are not adjusted to motor impairments, whereas ECAS is adjusted to upper motor and speech impairments. In a previous study, the ECAS-ALS Non-Specific score displayed very good psychometric properties in differentiating patients with AD from non-demented patients with ALS, whereas ACE-III and M-ACE were not successful (Kourtesis et al., Reference Kourtesis, Christidi, Margioti, Demenega, Rentzos, Evdokimidis and Abrahams2019). Therefore, the ECAS might be considered as an appropriate tool in patients with motor dysfunction, which are common in many neurodegenerative diseases, and could be ideally included in future clinical trials.
Limitations and Future Studies
This study contains certain caveats that should be noted. One of the limitations of this study is the small sample size albeit the facilitation of robust statistical analyses with high statistical power. A larger and more diverse sample would allow more solid and conclusive observations. In future studies, the acquisition of normative data should be of a size that permits the computation of distinct cut-off scores that are analogous to the educational level.
Only patients with AD were recruited in this study. It would be of relevance to investigate the capacity of the tests to differentiate between patients with FTD and AD and probe FTD phenotypes. In addition, future studies should consider adapting a scale such as the DAS in Greek, which may assist with research and/or clinical endeavours. The extensive and profound study of cognitive and behavioural changes in patients with dementia can help ameliorate and adjust patient care and alleviate the caregivers’ burden.
Acknowledgements
The official adaptations of ACE-III and M-ACE in Greek were performed with the permission of J.R. Hodges. The authors deeply thank J.R. Hodges and the Brain and Mind Centre of the University of Sydney for allowing us to adapt ACE-III and M-ACE in Greek. The official adaptation of ECAS in Greek was performed with the permission of Sharon Abrahams, Thomas Bak, and Judy Newton. The official Greek versions of ACE-III and M-ACE can be downloaded from https://sydney.edu.au/brain-mind/resources-for-clinicians/dementia-test.html. The official Greek version of ECAS can be downloaded from https://ecas.psy.ed.ac.uk/ecas-international/#Greek. The authors deeply thank the members (patients with AD and their relatives) and volunteers of the Athens Alzheimer’s Association (https://alzheimerathens.gr/en/) for their contribution to our study. Lastly, the authors would like to thank Enago (www.enago.com) for the English language review and proofreading.
Funding
This research did not receive any specific grant from funding agencies in the public, commercial, or not-for-profit sectors.
Conflict of Interest
The authors declare no conflicts of interest and that this study is their own work.