INTRODUCTION
Chronic excessive alcohol consumption has been repeatedly reported to impair brain function and structure (Oscar-Berman & Marinkovic, Reference Oscar-Berman and Marinkovic2007; Sullivan, Harris, & Pfefferbaum, Reference Sullivan, Harris and Pfefferbaum2010). As a consequence, there is an increased risk to develop alcohol-related dementia and alcohol-induced persisting amnestic syndrome (coined as Wernicke-Korsakoff syndrome; Ridley, Draper, & Withall, Reference Ridley, Draper and Withall2013). Neurobehavioral impairments are most pronounced in the subgroup of severe alcoholics suffering from the so-called Korsakoff syndrome, which may be a manifestation of Wernicke’s encephalopathy (characterized by a dense and persistent amnestic disorder due to severe thiamine deficiency; for overviews, see Butters, Reference Butters1985; Oscar-Berman & Marinkovis, Reference Oscar-Berman and Marinkovic2007). Nonetheless, also in non-Korsakoff alcoholics, neurocognitive deficiencies have been reported to be influenced by age, duration of alcoholism (and abstinence), amount and type of consumed alcohol.
Neurocognitive Sequelae of Alcoholism
Cognitive impairments associated with excessive alcohol intake mainly affect higher-order cognitive functions such as executive and (episodic) memory functions (Bernardin, Maheut-Bosser, & Paille, Reference Bernardin, Maheut-Bosser and Paille2014; Sinforiani et al., Reference Sinforiani, Zucchella, Pasotti, Casoni, Bini and Costa2011). The term “executive functions” refers to a set of quite heterogeneous functions such as inhibitory control, working memory, cognitive flexibility, fluency and problem solving (Friedman & Miyake, Reference Friedman and Miyake2016). Impairments in these functions have been attributed to dysfunctions of frontocerebellar circuits (e.g., Oscar-Berman et al., Reference Oscar-Berman, Valmas, Sawyer, Ruiz, Luhar and Gravitz2014). Moreover, alcohol abuse has also been found to harm episodic memory (e.g., Beydoun et al., Reference Beydoun, Beydoun, Gamaldo, Teel, Zonderman and Wang2014) and related fronto-temporal brain structures.
However, brain damage caused by alcoholism may be rather widespread, affecting also the limbic system (including hippocampal structures) and the cerebellum (associated with motor/behavioral functioning, respectively; cf. Dupuy & Chanaud, Reference Dupuy and Chanaud2016; Oscar-Berman & Marinkovic, Reference Oscar-Berman and Marinkovic2007). In sum, chronic excessive alcohol intake has been frequently associated with poor performance on tasks tapping visuospatial perception (e.g., embedded figures), construction (copying), and (psycho)motor functions (e.g., eye–hand coordination, stability in gait and balance, speeded performance; Sullivan et al., Reference Sullivan, Harris and Pfefferbaum2010).
Alcohol, Age, and Dementia
Several recent systematic reviews and meta-analyses have been targeted at examining whether alcohol consumption has any influence on incident cognitive decline or dementia (Anstey, Mack & Cherbuin, Reference Anstey, Mack and Cherbuin2009; Peters, Peters, Warner, Beckett, & Bulpitt, Reference Peters, Peters, Warner, Beckett and Bulpitt2008). However, findings are somewhat controversial as far as the effects of alcohol consumption on vascular dementia and cognitive decline in general are concerned (Panza et al., Reference Panza, Frisardi, Seripa, Logroscino, Santamato, Imbimbo and Solfrizzi2012). Notably, the findings of a recent systematic review disclose that cognitive impairments in alcohol-related dementia mainly concern executive, memory, and visuospatial functions (Ridley et al., Reference Ridley, Draper and Withall2013). However, from previous studies, it remains unclear whether cognitive profiles of elderly with and without a history of alcohol abuse can be differentiated upon using standardized neuropsychological tests such as the Consortium to Establish a Registry for Alzheimer’s Disease (CERAD) (Morris et al., Reference Morris, Heyman, Mohs, Hughes, van Belle, Fillenbaum and Clark1989).
Study Rationale
Although lasting alcohol abstinence may yield cognitive recovery, subtle cognitive impairments may persist and interfere with every-day-life activities and treatment compliance (thus enhancing the risk of relapse; Panza et al., Reference Panza, Frisardi, Seripa, Logroscino, Santamato, Imbimbo and Solfrizzi2012; Sullivan et al., Reference Sullivan, Harris and Pfefferbaum2010). Hence, there is a clear need for sensitive neuropsychological assessments suited to detect even subtle cognitive impairments in affected individuals. The main objectives of the present retrospective study were (i) to compare cognitive performance in elderly patients with (suspected) minor neurocognitive disorder (according to clinical psychiatric diagnosis based on DSM-V criteria; APA, 2013), with or without a history of alcohol abuse; and (ii) to evaluate whether a standard neuropsychological test battery administered to the elderly (i.e., CERAD) is sensitive to (possibly subtle) cognitive deficiencies induced by chronic alcohol abuse. Importantly, different from previous studies we used propensity score matching to match our study groups on possible confounds such as age, gender, education, and overall cognitive performance.
METHODS
Participants
Patient data were drawn from geriatric out- and inpatient services of a psychiatric general hospital. Please note that in Austria (and Germany alike), each kind of substance abuse, including alcohol dependency, is treated in general psychiatric hospitals because no special hospitals for the treatment of alcohol dependency exist in the public health system. Of a patient pool of n=738 (thereof 78 elderly with and 660 without alcohol abuse), 144 elderly were included in the final data set (each group n=72). All patients were referred for clinical neuropsychological examinations to assess whether cognitive performance warranted a diagnosis of minor neurocognitive disorder due to Alzheimer’s disease or other forms of incipient dementias (APA, 2013; formerly called minimal cerebral dysfunction; APA, 1994).
Neuropsychological assessments were conducted between 2009 and 2015. Inclusion criteria for participation in the present retrospective study were (i) age above 55 years; (ii) German as first language; (iii) at least 7 years of formal education; (iv) Mini-Mental State Examination (MMSE) (Folstein, Folstein, & McHugh, Reference Folstein, Folstein and McHugh1975) score of ≥24; (v) absence of neurological disorders such as severe brain injury and neoplastic brain processes; (vi) absence of Wernicke encephalopathy as defined by clinical operational criteria (Caine, Halliday, Kril, & Harper, Reference Caine, Halliday, Kril and Harper1997); and (vii) absence of severe psychiatric disorders including major depressive disorders (see participant characteristics, Table 1).
Table 1 Patient characteristics
a As derived from hospital patient charts; °excluding major depressive disorders (see the Methods section).
Diagnoses of (suspected) minor neurocognitive disorder were based on clinical psychiatric examination in accordance with the rules and regulations of the APA (2013) and substantiated by the results of a standard rating instrument (i.e., Clinical Dementia Rating/CDR, Hughes, Berg, Danziger, Coben, & Martin, Reference Hughes, Berg, Danziger, Coben and Martin1982; CDR box scores of 0.5 or 1 obtained by certified clinicians). Study participants with a recent history of alcohol abuse underwent neuropsychological examinations after alcohol abstinence of at least 10 days (but not more than 3 months) and reported a drinking history of >10 years with an alcohol consumption exceeding 100 g per day. Considering recent suggestions proposing that moderate drinking equals to no more than one or two drinks per day (for women and men, respectively; U.S. Department of Health and Human Services, 2010), corresponding to approximately 30 g of alcohol (Kerr et al., 2005; cited in Panza et al., Reference Panza, Frisardi, Seripa, Logroscino, Santamato, Imbimbo and Solfrizzi2012), our elderly patients can be considered heavy drinkers.
Tests Used
Neuropsychological functioning was measured using the CERAD (Morris et al., Reference Morris, Heyman, Mohs, Hughes, van Belle, Fillenbaum and Clark1989). Here, we used the validated German version of the CERAD (Thalmann et al., Reference Thalmann, Monsch, Schneitter, Bernasconi, Aebi, Camachova-Davet and Staehelin2000). The CERAD is a standard clinical neuropsychological tool used to diagnose dementia which was repeatedly reported to be highly predictive for the early identification of and differential diagnosis of Alzheimer’s disease, among others (Mayer et al., Reference Mayer, Diwo, Imarhiagbe, Erler, Marksteiner and Kaufmann2015; Schmid, Ehrensperger, Berres, Beck, & Monsch, Reference Schmid, Ehrensperger, Berres, Beck and Monsch2014; Wolfsgruber et al., Reference Wolfsgruber, Jessen, Wiese, Stein, Bicke, Mösch and Wagner2014). Subtests of the CERAD are well-established neuropsychological tests adapted to the elderly. The CERAD is comprised of subtests that were shown to be sensitive to common cognitive impairments associated with Alzheimer’s disease.
Subtests of the CERAD core battery are (in the order of administration): (1) Verbal Fluency Animals (tapping verbal semantic association skills; sum score of named animals), (2) Modified Boston Naming Test (BNT, measuring confrontation naming and thus, word finding difficulties; max. score of 15), (3) MMSE (cognitive screening; max. score of 30), (4) Word List Learning (sum of three learning trials; max. score of 30), (5) Constructional Praxis Copy (tapping visuo-constructional skills; max. score of 11), (6) Word List Recall (measuring verbal recall memory; max. score of 10), (7) Word List Discriminability (measuring verbal recognition memory; max. score of 10), (8) Constructional Praxis Recall (measuring figural memory, max. score of 11). Moreover, three additional subtests include the so-called CERAD-Plus tests (again in the order of test administration): (9) and (10) Trail Making Tests A and B (tapping visuo-motor speed and cognitive flexibility, respectively; scored is the processing time in seconds) as well as (11) Verbal Fluency S-Words (measuring verbal phonological association skills).
All subtests were administered according to standard procedures. For all subtests, raw scores were converted to T-scores (M=50 and SD=10) upon using the automated analysis program provided by the memory clinic of the University Hospital Basel, Switzerland (https://www.memoryclinic.ch/de/main-navigation/neuropsychologen/cerad-plus/auswertungprogramme/cerad-plus-10-excel/). Moreover, we computed a total score according to the method proposed by Chandler et al. (Reference Chandler, Lacritz, Hynan, Barnard, Allen, Deschner and Cullum2005). The Chandler total score (CTS) is derived by summing up the raw scores of all but two subtests of the CERAD core battery (i.e., excluding MMSE and Constructional Praxis Recall), with the Verbal Fluency raw score being limited to a maximum score of 24 and the Word List Discriminability raw score being calculated by subtracting the number of false positives from the number of true positives (each n=10). Notably, subtests of the CERAD-Plus are not considered for calculating the CTS. The CTS has a maximum of 100 raw points. For each study participant, the CTS raw score was converted to a T-score.
Furthermore, to evaluate whether potential group differences regarding depressive mood might confound neuropsychological performance in our patients (e.g., DeFrancesco, Marksteiner, Deisenhammer, Hinterhuber, & Weiss, Reference DeFrancesco, Marksteiner, Deisenhammer, Hinterhuber and Weiss2009), we also report patients’ data on the 15-item short version of the Geriatric Depression Scale (GDS, Yesavage et al., Reference Yesavage, Brink, Rose, Lum, Huang, Adey and von Leirer1983; for the German standardization, see Gauggel & Birkner, Reference Gauggel and Birkner1999). The GDS is based on self-reports and examines depressive symptomatology frequently observed in the elderly. Because GDS data were not available for all participants (elderly with alcohol abuse n=62 vs. those without alcohol abuse n=38), GDS could not be used as a matching variable.
Analyses
Propensity score matching was applied to match the groups of elderly with and without alcohol abuse based on age, years of education, gender, and overall cognitive ability (indexed by the MMSE; Folstein et al., Reference Folstein, Folstein and McHugh1975). We drew random subsamples of the experimental group (i.e., elderly with alcohol abuse) consisting of 70 up to 77 participants to increase the likelihood of finding a matched subsample of the control group (i.e., elderly without alcohol abuse). This process was repeated until the difference between mean ages as well as mean years of education was less than 0.5 years, the proportion of female and male participants differed by less than 1% and MMSE score differed by less than 0.1 between groups. To find matched groups, we used the programming language R (R Core Team, 2016) and the R package MatchIt (Ho, Imai, King, & Stuart, Reference Ho, Imai, King and Stuart2011), which implements various methods for matching (for a step-by-step guide for MatchIt, see Randolph, Falbe, Manuel, & Balloun, Reference Randolph, Falbe, Manuel and Balloun2014). Applying this procedure, we found almost perfectly matched groups with 72 participants per group (Table 1).
To investigate potential sensitivity of standardized scores of the CERAD variables and the standardized CTS for the group differentiation between elderly with versus without alcohol abuse we used the following three-step procedure.
First, we compared the standardized scores by doing a Welch’s t test, separately for each CERAD variable. p-Values were corrected for multiple testing by controlling the false discovery rate (Benjamini & Hochberg, Reference Benjamini and Hochberg1995).
Second, we investigated how good the standardized scores of the CERAD variables were at differentiating between the two groups by using decision tree learning, more specifically classification trees that fall within the family of tree-based models. Classification trees are tree-like decision models commonly used in predictive modeling or data mining. They consist of a root node and interior nodes corresponding to splitting attributes and terminal nodes corresponding to a particular decision. Edges denote the outcome of an attribute test of a splitting attribute and are labeled with disjoint ranges.
Decision trees are built by recursively splitting attributes based on a splitting criterion. In the present study, we used the GINI index as splitting criterion (Gini, Reference Gini1921). Classification trees were generated separately for each CERAD variable using the R package rpart (Therneau, Atkinson, & Ripley, Reference Therneau, Atkinson and Ripley2015). To avoid overfitting of the data, we restricted the maximal depth of the trees to three, and the minimum number of participants required in a node in order for a split to be attempted to 10 participants. Moreover, we pruned the trees based on the complexity parameter for which the cross-validated error was smallest, available via the R function printcp from the R package rpart. Classification accuracy was evaluated by applying a cross-validation procedure: We randomly split the data 1000 times into a training set containing 128 participants and a test set containing 16 participants with 50% of the participants from each group.
Then, classification accuracy was averaged over 1000 runs. Thereafter, we evaluated whether the obtained average classification accuracy was above chance level by running a binomial test using R (R Core Team, 2016) for each CERAD variable separately. Again, p-values were corrected for multiple testing using the procedure suggested by Benjamini and Hochberg (Reference Benjamini and Hochberg1995). Classification trees were drawn using the R package rpart.plot (Milborrow, Reference Milborrow2016). For other figures, we used the R package ggplot2 (Wickham, Reference Wickham2009).
Third, we sought to investigate how well we can classify patients when using all CERAD variables as features. Therefore, we generated gradient boosted instead of decision trees by using the R package xgboost (Chen & Guestrin, Reference Chen and Guestrin2016; Chen, He, & Benesty, Reference Chen, He and Benesty2016). Thus, in contrast to usual decision tree models, decisions are not based on a single tree, but on several decision trees (i.e., random forest). The decision trees select a random subset of the features (one of the CERAD variables) at each candidate split in the learning process. In case a feature is a very strong predictor for the output, it will be in many trees of the random forest. Thereby, boosted decision tree models enable us to measure feature importance.
In our case, the outputs were the two groups (elderly with and without alcohol abuse) and features were the CERAD variables. Furthermore, we used grid search to tune hyperparameters. Therefore, we fixed the parameters eta=0.01 (the learning rate), gamma=0.01 (the minimum loss reduction) and number of rounds=75, but tried to find the best values for subsample ratio, subsample ratio of the columns, and the maximum depth of a tree. For subsample ratio, we considered the values 0.5, 0.75, and 0.9, for subsample ratio of the columns 0.5, 0.75, and 1 and for the maximum depth the values 3, 4, and 5. Ultimately, training error was minimal upon using 10-fold cross validation as well as a subsample ratio of 0.75, a subsample ratio of the columns of 1 and a max depth of 4.
Taken together, this three-step approach allowed us to investigate whether elderly with and without alcohol abuse can be differentiated regarding their cognitive performance. In particular, we aimed to investigate (i) whether a single CERAD variable can be used to classify the two groups above chance (decision trees) and (ii) which CERAD variables are most important when classifying the two groups based on all features (boosted trees).
Effect sizes are reported where appropriate to facilitate interpretation of results, in particular considering (i) methodological differences between studies making it difficult if not impossible to compare results otherwise and (ii) the potential tendency to yield underpowered results because despite strict matching criteria some heterogeneity may persist in clinical studies regarding disease-related variables. Importantly, we adhered to Ferguson’s (Reference Ferguson2009) recommendations for interpreting effect sizes that are more conservative than those reported by Cohen (Reference Cohen1992). Thus, non-significant results will be discussed only when effect sizes indicated the recommended minimum effect size representing a “practically” significant effect according to Ferguson (Reference Ferguson2009): effects may be considered practically relevant when Cohen’s d>.4 (corresponding to a r of>.2 and to a η 2 /adjusted R 2 of>.04).
The present study was conducted in compliance with the declaration of Helsinki and was approved by the local ethical committee of Innsbruck Medical University.
RESULTS
Descriptive statistics of CERAD variables and the CTS are given in Table 2. Results revealed significant group differences for the “Trail Making Test A” (t(139.18)=−2.39; p=.018; d=.40) and “Trail Making Test B” (t(139.44)=−2.34; p=.021; d=.39), indicating better performance of the control group (i.e., elderly without alcohol abuse) in the Trail Making Tests. However, group differences were no longer significant after correcting for multiple testing (both p=.113).
Table 2 Means and SDs of standardized z-scores of the CERAD variables and the Chandler Total Score for both study groups
Notes: uncorr.=not corrected for multiple testing; corr.=corrected for multiple testing.*Significant at p<.05.
Notably, study groups did not differ significantly regarding the severity of cognitive impairment as indexed by the number of CERAD variables with a Z-score<−2 (elderly with alcohol abuse M=1.65; SD=1.79 vs. those without alcohol abuse M=1.33; SD=1.62; t(140.66)=1.12; p=.263; d=.19). Likewise, after correcting for multiple testing, sex was not found to be a significant moderator of our results (Appendix A; adjusted p>.174). Nonetheless, though not reaching significance, effect size estimations indicate that sex was a practically significant moderator of performance on the CERAD subtest “Word List Discriminability” (η² G =.042).
Finally, group differences were not significant regarding self-reported depressive symptomatology (GDS mean raw scores in elderly with vs. without alcohol abuse: M=5.4; SD 3.9 vs M=5.1; SD=4.4, respectively); t(70.73)=0.24; p=.812; d=.05). However, across all participants (and after correcting for multiple testing) the GDS score correlated significantly with the CTS (r(98)=−.22; p=.029), indicating that higher GDS scores (reflecting more depressive symptoms) were associated with worse cognitive performance. However, the GDS score did not correlate significantly with any of the CERAD variables after correcting for multiple testing (neither across all participants nor when calculated separately for the two study groups, all correlations |r|<.3).
Results of the classification trees are provided in Table 3. We were able to correctly classify a significant part of our patients upon using Z-scores for the CERAD variable “Word List Discriminability.” To inspect the classification tree for “Word List Discriminability,” we additionally computed it based on all data (Figure 1A). When using this classification tree, participants could be discriminated with 69% classification accuracy based on two splits: Patients were classified as belonging to the group with alcohol abuse, when their Z-score was between −0.85 and 0.86, whereas patients were classified into the control group, when their Z-score lay outside this interval. Moreover, this classification tree yielded correct classifications for 61% of the elderly with alcohol abuse and 78% of the elderly without alcohol abuse.
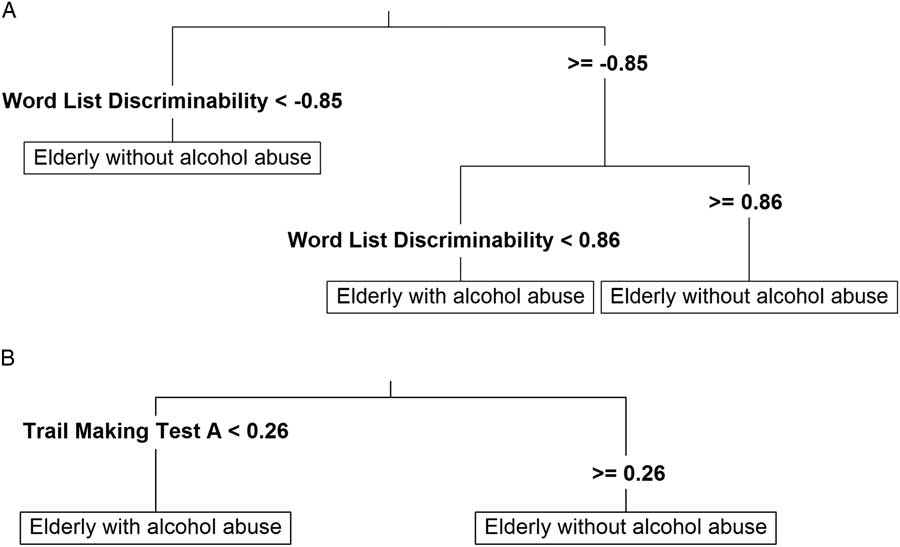
Fig. 1 Classification trees based on the CERAD variables “Word List Discriminability” (A) and “Trail Making Test A” (B).
Table 3 Mean accuracies of cross-validation runs of classification tree models with standardized Z scores of CERAD subtests as attributes and p-values as well as adjusted p-values of binomial tests (against chance level)
Note: p-Values were calculated by running binomial tests and corrected for multiple testing by controlling the false discovery rate (Benjamini & Hochberg, Reference Benjamini and Hochberg1995).*Significant at p<.05.
Likewise, classification accuracy using the Z-scores of the “Trail Making Test A” was significantly above chance level before correcting for multiple testing. The classification tree indicated that study participants might be correctly classified into the two groups based on a binary split at a Z-score of 0.26 (Figure 1B). Using this split, 60% of all participants (94% of elderly with alcohol abuse and 26% of those without alcohol abuse) could be correctly classified.
Notably, cross-validated mean classification accuracy did not improve when including a subset of or all CERAD variables using classification trees. For instance, when including “Trail Making Test A” and “Word List Discriminability” as features, classification accuracy of decision trees with a maximum depth of 3, 4, 5, or 6 splits was 64% and hence, not better than the classification tree for “Word List Discriminability” as a single feature. Moreover, when including all CERAD variables, mean classification accuracy of decision trees with maximum depth of 3, 4, 5, or 6 splits was 58% and thus, even worse than relying only on “Word List Discriminability” exclusively.
However, we could improve classification accuracy to 65% when running gradient boosted trees and 10-fold cross validation considering all CERAD variables. In addition to “Word List Discriminability” and “Trail Making Test A,” also “Word List Recall” was among the three most important features (Figure 2). Hence, the latter three CERAD variables can be regarded as important features for classifying the two study groups. Moreover, when running xgboost using only these three features, classification accuracy increased to 68%.
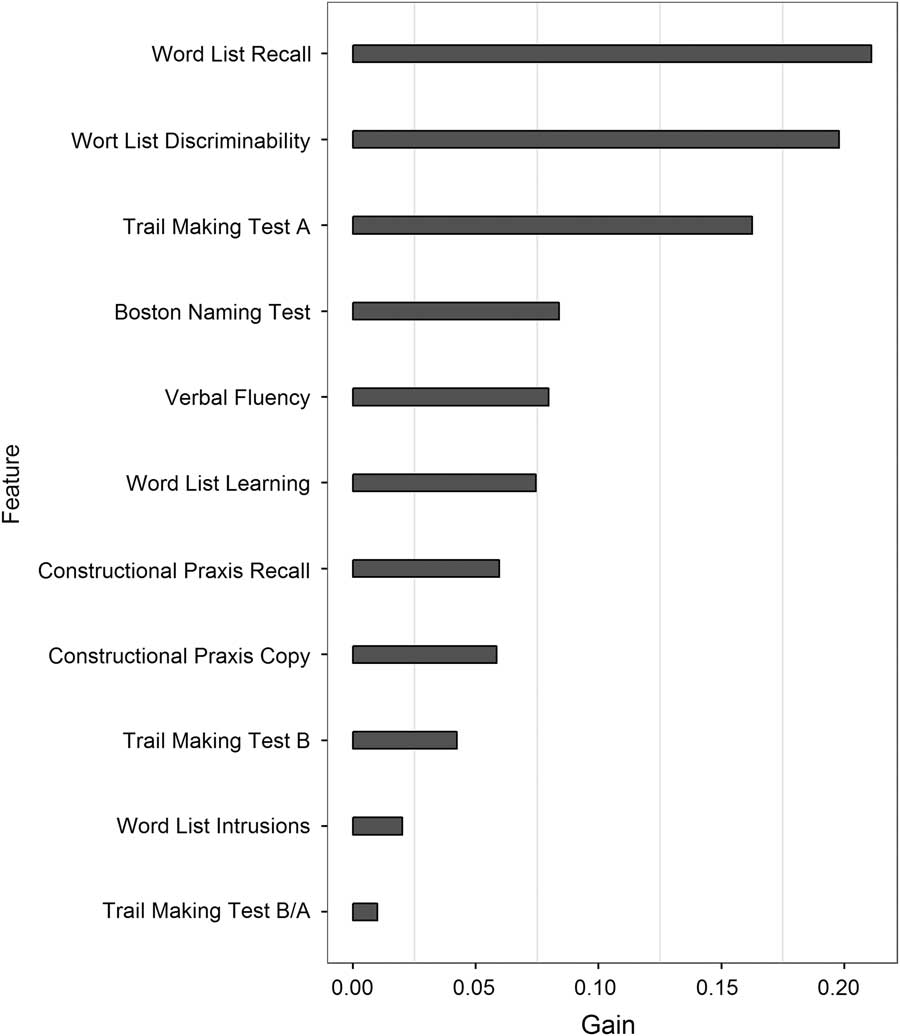
Fig. 2 Feature importance (indicating information gain) of the CERAD variables based on boosted trees.
Moreover, Figure 3 and Table 4 depict sensitivity, specificity, and receiver operating characteristic (ROC) curves for classification trees based on the CERAD variables “Word List Discriminability” (Fig. 3A) and “Trail Making Test A” (Fig. 3B) as well as boosted trees based on all CERAD variables (Fig. 3C). Areas under the curve (AUC) of classification trees based on the CERAD variables “Word List Discriminability” and “Trail Making Test A” as well as boosted trees based on all CERAD variables were 0.69, 0.60, and 0.75, respectively.
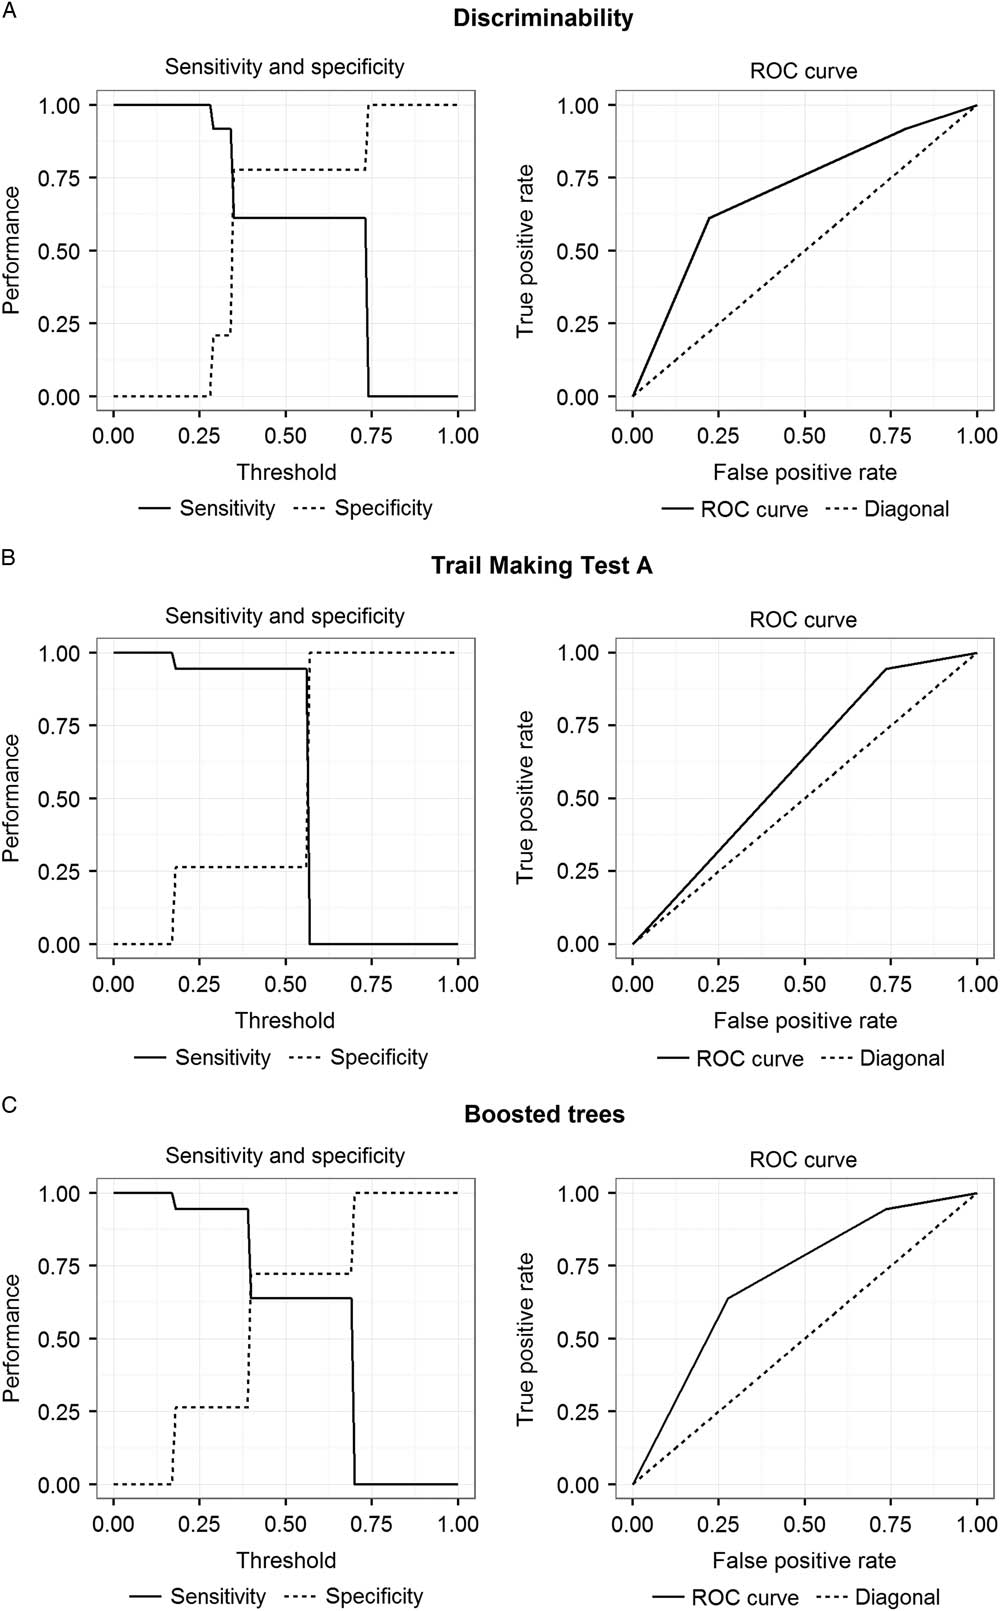
Fig. 3 Sensitivity, specificity, and ROC curves for classification trees based on the CERAD variables “Word List Discriminability” (A) and “Trail Making Test A” (B) and boosted trees based on all CERAD variables (C).
Table 4 Sensitivity, specificity and accuracies of classification trees based on the CERAD variables “Word List Discriminability” and “Trail Making Test A” and boosted trees based on all CERAD variables for different thresholds
Note. Best fit results are quoted in italics.
DISCUSSION
The main purpose of the present retrospective matched case-control study was to examine whether the CERAD neuropsychological test battery may be sensitive to alcohol-related cognitive deficiencies in elderly patients with (suspected) minor neurocognitive disorder. As our patient pool comprised far more elderly without a history of alcohol abuse, propensity score matching was applied to match groups regarding several potential confounds such as age, education, gender, and MMSE (Table 1). Moreover, elderly with and without a history of alcohol abuse were comparable regarding CERAD (i.e., Chandler/CTS) total score and severity of cognitive impairment (indexed by the number of CERAD variables with a Z-score<−2, indicating performance deficiencies of two SD below the normative sample). Results indicated that specific subtests of the CERAD seem to provide first indications for identifying patients with minor neurocognitive disorder due to a history of alcohol abuse.
In particular, our findings disclosed that, after correcting for multiple comparisons, group differences as examined by t tests did not become significant (Table 2). However, before controlling for multiple testing, two CERAD variables (i.e., “Trail Making Test A” and “Trail Making Test B”, tapping visuo-motor speed and cognitive flexibility, respectively) were found to differentiate between groups (favoring elderly without alcohol abuse, mean Z-score differences reaching .48 on Trails A and .53 on Trails B; see Table 2), thus suggesting considerable and according to Ferguson (Reference Ferguson2009) practically significant alcohol-related performance differences.
Of interest, upon using classification trees, our results revealed that patient groups could be classified based on two CERAD variables: “Word List Discriminability” (reaching a classification accuracy of 64%) and to a lesser degree “Trail Making Test A” (classification accuracy of 59%, significant only before controlling for multiple testing, Figure 1 and Table 3). These results were substantiated by the boosted tree analysis (Figure 3). Of interest, beyond the two aforementioned CERAD variables, “Word List Recall” (tapping verbal free recall memory) was found to contribute significantly to group classification when considering all CERAD variables as predictors in the boosted trees analysis (Figure 2). The latter results are largely consistent with previous findings suggesting that memory and psychomotor functions (including motor tasks with a speed factor) are detrimentally affected by excessive alcohol intake (Oscar-Berman et al., Reference Oscar-Berman, Valmas, Sawyer, Ruiz, Luhar and Gravitz2014; Sullivan et al., Reference Sullivan, Harris and Pfefferbaum2010).
The finding that decision tree models revealed only verbal recognition memory (indexed by the CERAD variable “Word List Discriminability”) to allow for significant group classification was unexpected. In particular so as another memory measure tapping active verbal recall (i.e., “Word List Recall”) did not contribute to group discrimination. A possible explanation for the latter discrepancy may be that task demands of the two CERAD variables call upon different levels of executive control mechanisms. Unlike in the active memory recall task (“Word List Recall”) asking participants to recall as many words as possible from a previously learnt word list, verbal recognition memory requires participants to decide whether a presented word belonged to the previously learnt list of words or not. Notably, this places heavy demands on inhibitory control mechanisms known to be frequently deficient in alcoholics (Oscar-Berman et al., Reference Oscar-Berman, Valmas, Sawyer, Ruiz, Luhar and Gravitz2014; Panza et al., Reference Panza, Frisardi, Seripa, Logroscino, Santamato, Imbimbo and Solfrizzi2012; Sullivan et al., Reference Sullivan, Harris and Pfefferbaum2010). However, these differential aspects need to be interpreted carefully as verbal free recall was found to be a meaningful predictor for group classification in the boosted tree analysis (Figure 2).
Moreover, at first glance, it was rather unexpected that visuo-motor speed (“Trail Making Test A”) but not cognitive flexibility (a specific aspect of executive functions, and indexed by “Trail Making Test B” or the quotient “Trail Making Test A/Trail Making Test B”) seemed to be sensitive to alcohol-related cognitive impairments. However, it is important to note that the “Trail Making Test A” is a rather complex task requiring visual scanning and visuospatial processing (i.e., scanning randomly distributed letters in an attempt to allocate letters in the correct alphabetical order), planning and monitoring (i.e., which letter comes next in the alphabet), as well as visuo-motor coordination under speed requirements (i.e., time taken to complete the test). Thus, poor performance on the “Trail Making Test A” nicely fits previous findings reporting alcohol-related impairments on visuospatial cognition, executive functions and (speeded) psychomotor abilities thought to originate from dysfunctions in (parietal and) fronto-cerebellar brain regions (Butters, Reference Butters1985; Oscar-Berman et al., Reference Oscar-Berman, Valmas, Sawyer, Ruiz, Luhar and Gravitz2014).
Altogether, our classification results based on classification tree and boosted tree models suggest that a combination of verbal free recall, verbal recognition memory and visuo-motor speed seem to be sensitive to alcohol-related performance specificities in our study group of elderly with (suspected) minor neurocognitive disorder. Notably, as our study groups were closely matched to demographic data, overall cognitive functioning and comorbid diseases, we are confident that the observed group differences reflect alcohol-related cognitive impairments. Our results are largely consistent with those reported by Bertoux and colleagues (Reference Bertoux, Ramanan, Slachevsky, Wong, Henriquez, Musa and Dubois2016) in patients suffering from the behavioral variant of frontotemporal dementia (bvFTD). Memory impairments of these patients were not solely mediated by fronto-executive dysfunctions (as indexed by encoding and strategic retrieval difficulties). Instead, they were also found to involve storage and consolidation processes being indicative of genuine (hippocampal type) memory impairments. Likewise, alcohol-related impairments in our study group were observed with regard to both subtests drawing on verbal free recall and recognition condition.
Furthermore, we found that the CERAD total score (CTS) was not sensitive to alcohol-related cognitive impairments in our study group. Rather, our patients exhibited comparable performance on the CTS irrespective of the absence or presence of a history of alcohol abuse. Previously, the CTS was reported to reliably detect (and even predict) patients suffering from Alzheimer’s disease (Wolfsgruber et al., Reference Wolfsgruber, Jessen, Wiese, Stein, Bicke, Mösch and Wagner2014). However, patients examined in the latter study were considerably older than our study participants (mean age 84 vs. 67 years, respectively) and had a clinically confirmed diagnosis of Alzheimer’s disease while our patients suffered from (suspected) minor neurocognitive disorder.
Finally, it is important to acknowledge previously reported associations between (late-life) depression and cognitive dysfunction (DeFrancesco et al., Reference DeFrancesco, Marksteiner, Deisenhammer, Hinterhuber and Weiss2009; Heser et al., Reference Heser, Bleckwenn, Wiese, Mamone, Riedel-Heller, Stein and Wagner2016; Panza et al., Reference Panza, Frisardi, Capurso, D’Introno, Colacicco, Imbimbo and Solfrizzi2010). Also in our study group (calculated across all participants and corrected for multiple testing), a higher GDS score (reflecting more self-reported depressive symptomatology) was significantly correlated with worse cognitive performance as indexed by a low CERAD total score. Notably, the strength of the latter correlation can be considered practically relevant according to Ferguson (Reference Ferguson2009).
On the contrary, in our study, group differences between elderly with versus without alcohol abuse regarding the GDS score were not significant. Additionally, GDS scores did not correlate significantly with any of the CERAD variables (neither across all participants nor when calculated separately for the two study groups). Because we were not able to retrieve GDS scores from all study participants, the latter findings should be interpreted carefully. Nevertheless, these results indicate that our main findings should not be driven by depressive mood but rather reflect alcohol-induced cognitive impairments in our elderly patients with (suspected) minor neurocognitive disorder.
A potential limitation of the present study may be missing information on which type of alcohol has been consumed. Previously, it has been claimed that, compared with spirits, wine and beer might have less detrimental effects on brain function and structure (Panza et al., Reference Panza, Frisardi, Seripa, Logroscino, Santamato, Imbimbo and Solfrizzi2012; Peters et al., Reference Peters, Peters, Warner, Beckett and Bulpitt2008). A further limitation is that detailed information on drinking history was not available for each study participant. Importantly, however, all study participants reported to consume more than 100 g of alcohol per day and reported to have been drinking heavily for more than 10 years. Hence, our patients can clearly be considered heavy drinkers.
Furthermore, although rigorous inclusion/exclusion criteria and the applied propensity score matching procedure ensured that our study groups were as homogeneous as possible with regard to clinical comorbid disorders (including the presence of Korsakoff syndrome and/or Wernicke encephalopathy), groups differed regarding cardiovascular incidents, stroke history, and benzodiazepine use. In particular, stroke history was more frequently reported in elderly without alcohol abuse, while those with alcohol abuse had a higher incidence of cardiovascular episodes and benzodiazepine use. Although we were able to match our study groups on several critical variables, it has to be noted that it is almost impossible to avoid some heterogeneity on disease-related variables in clinical samples. Nonetheless, the general state of physical health may be considered comparable across our study groups (Table 1).
A clear asset of the present study is the application of a sophisticated matching method yielding closely matched groups. Thus, our results are not confounded by the matching variables. In particular, classification of elderly with alcohol abuse on verbal memory and visuo-motor speed is not attributable to age- or education-related group differences (Panza et al., Reference Panza, Frisardi, Seripa, Logroscino, Santamato, Imbimbo and Solfrizzi2012; Sullivan et al., Reference Sullivan, Harris and Pfefferbaum2010) and may neither be explained by poorer overall cognitive abilities (indexed by MMSE and CERAD/CTS; Ridley et al., Reference Ridley, Draper and Withall2013) nor by the severity of depressive symptomatology (GDS; DeFrancesco et al., 2009; Heser et al., Reference Heser, Bleckwenn, Wiese, Mamone, Riedel-Heller, Stein and Wagner2016).
Moreover, the present study is novel as to the best of our knowledge previous studies investigating cognitive performance in elderly with neurocognitive impairments mostly compared patient groups to normal controls (instead of to another patient group matched for overall cognitive performance; e.g., Alzheimer’s disease: Ehrensperger, Berres, Taylor, & Monsch, Reference Ehrensperger, Berres, Taylor and Monsch2010; mild cognitive impairment: Paajanen et al., Reference Paajanen, Hänninen, Tunnard, Mecocci, Sobow, Tsolaki and Soininen2010). Moreover, as none of these studies report Z-scores for the CERAD subtests, direct comparisons with our findings are difficult. As such, group differences reported in the literature may be more pronounced than group differences reported in our study, which compares closely matched and rather high-functioning groups of elderly with minor neurocognitive disorders (with and without alcohol abuse).
In summary, as far as we know, the present study is the first to systematically examine the effects of alcohol abuse in a large and well-matched sample of elderly patients with (suspected) minor neurocognitive disorder. Importantly, our findings suggest that also in rather high functioning elderly (average MMSE of 28) alcohol abuse may cause cognitive impairments that, albeit subtle and circumscribed, are detectable by means of a standard neuropsychological test battery frequently used to diagnose neurodegenerative diseases like dementia (i.e., CERAD). In particular, CERAD variables measuring verbal free recall and recognition memory as well as visuo-motor speed allowed discriminating elderly with and without alcohol abuse. This indicates that the respective CERAD variables seemed useful in identifying alcohol-related cognitive deficiencies in elderly patients with (suspected) minor neurocognitive disorder. Of course, future research endeavors are required to confirm our findings. Nonetheless, as the CERAD is widely used for standard neuropsychological assessment, the additional diagnostic value seems beneficial.
Acknowledgments
The authors declare no conflicts of interest. The authors received no specific funding for this work.
Appendix A
Means and SDs of standardized Z-scores of the CERAD variables and the Chandler Total Score for male and female elderly with and without alcohol abuse as well as p-values and effect sizes of the interaction effects between study group and sex