


INTRODUCTION
Recent estimates of the prevalence of Alzheimer’s disease in the United States range from 2.8 to 5.8 million (Alzheimer’s Association, 2019; Brookmeyer, Johnson, Ziegler-Graham, & Arrighi, Reference Brookmeyer, Johnson, Ziegler-Graham and Arrighi2007; Hebert, Weuve, Scherr, & Evans, Reference Hebert, Weuve, Scherr and Evans2013; Plassman et al., Reference Plassman, Langa, Fisher, Heeringa, Weir, Ofstedal and Rodgers2007). These estimates and their corresponding uncertainty are affected by potential methodological variations, including inconsistencies in sampling methods and case definitions. One important source of variation may stem from how different subgroups respond to tests in neuropsychological batteries.
The questions or items used in these batteries rely to varying degrees on visual stimuli, auditory stimuli, or both. Approximately 14 million Americans have visual impairment, while an estimated 22 million Americans ≥ 60 years have a clinically significant hearing impairment (Goman & Lin, Reference Goman and Lin2016; Lin, Niparko, & Ferrucci, Reference Lin, Niparko and Ferrucci2011; Vitale, Cotch, & Sperduto, Reference Vitale, Cotch and Sperduto2006). Those with either impairment comprise 55% of Americans ≥ 60 years overall (Swenor, Ramulu, Willis, Friedman, & Lin, Reference Swenor, Ramulu, Willis, Friedman and Lin2013). Hence, the potential effect of biases in cognitive testing that relies on either vision or hearing for the modality of administration could be substantial.
An understanding of this potential bias is particularly important, given the large body of cross-sectional evidence supporting the existence of associations between sensory impairments and lower cognitive test scores (Chen, Bhattacharya, & Pershing, Reference Chen, Bhattacharya and Pershing2017; Gussekloo, de Craen, Oduber, van Boxtel, & Westendorp, Reference Gussekloo, de Craen, Oduber, van Boxtel and Westendorp2005; Taljaard, Olaithe, Brennan-Jones, Eikelboom, & Bucks, Reference Taljaard, Olaithe, Brennan-Jones, Eikelboom and Bucks2016). Additionally, there has been growing evidence from longitudinal studies suggesting strong associations of vision loss (Lin et al., Reference Lin, Gutierrez, Stone, Yaffe, Ensrud, Fink and Mangione2004; Rogers & Langa, Reference Rogers and Langa2010; Tay et al., Reference Tay, Wang, Kifley, Lindley, Newall and Mitchell2006; Zheng et al., Reference Zheng, Swenor, Christ, West, Lam and Lee2018) and hearing (Deal et al., Reference Deal, Betz, Yaffe, Harris, Purchase-Helzner, Satterfield and Lin2017; Lin, Ferrucci, et al., Reference Lin, Ferrucci, Metter, An, Zonderman and Resnick2011) with accelerated cognitive decline and dementia. Proposed explanations for these associations include the possibility of common pathways, i.e., microvascular disease, but some evidence also supports causal pathways via mechanisms, i.e., social isolation or changes in brain structure and function (Lin et al., Reference Lin, Ferrucci, An, Goh, Doshi, Metter and Resnick2014; Lin & Albert, Reference Lin and Albert2014; Lin et al., Reference Lin, Zhang, Lin, Chen, Zhu, Chen and Chen2018; Peelle, Troiani, Grossman, & Wingfield, Reference Peelle, Troiani, Grossman and Wingfield2011). Support for these proposed causal mechanisms would suggest that interventions targeted at correcting vision loss and hearing impairment could have important implications for preventing cognitive decline and dementia (Ehrlich & Langa, Reference Ehrlich and Langa2019; Lin & Albert, Reference Lin and Albert2014).
Prior literature comparing standard cognitive test battery scores with scores removing items dependent on adequate vision or hearing does suggest that hearing impairment in particular may bias cognitive testing (Dupuis et al., Reference Dupuis, Pichora-Fuller, Chasteen, Marchuk, Singh and Smith2015). However, this work utilized a brief battery (the Montreal Cognitive Assessment) and relied on the assumption that the further abbreviated batteries removing items dependent on hearing or vision still adequately described global cognitive performance. Additionally, they were unable to evaluate bias by individual cognitive test items. Overall, it remains largely unknown what effect biases in cognitive instruments might have on our understanding of the relationship between sensory impairment and cognition.
Item response theory methods are commonly used to characterize the measurement of traits, such as cognitive function, that are not directly observable (Bollen, Reference Bollen1989). These methods have been previously applied to investigate how language of administration and demographic differences, such as sex or educational level, may bias cognitive test results, while accounting for underlying cognitive ability (Jones, Reference Jones2006; Jones & Gallo, Reference Jones and Gallo2002; Morales, Flowers, Gutierrez, Kleinman, & Teresi, Reference Morales, Flowers, Gutierrez, Kleinman and Teresi2006). However, these methods have not been heretofore applied to the study of sensory impairment. This study aims to apply these methods to better understand the effect of sensory impairment on the measurement of specific cognitive functions. We leveraged data from two well-characterized, prospective cohort studies, the Baltimore Longitudinal Study of Aging (BLSA) and the Atherosclerosis Risk in Communities Neurocognitive Study (ARIC-NCS). We hypothesized that cognitive tests where administration relies on vision (e.g., Trail-Making test, parts A & B) or hearing (e.g., auditory word-list learning) would be more difficult (biased) for those with vision and hearing impairments, respectively, even if they did not have reduced cognitive ability.
METHODS
Study Populations
BLSA is a prospective longitudinal study of psychological and physical aging that was initiated in 1958. It recruited healthy, community-dwelling volunteers to study aging over the adult lifespan. Participants undergo cognitive, psychological, and physical testing at the National Institute on Aging, in Baltimore, Maryland (Shock et al., Reference Shock, Greulich, Arenberg, Costa, Lakatta and Tobin1984). Our study utilized data from participants aged 55 years and older who attended visits between 2015 and 2017, who had cognitive testing and either objective vision or hearing testing, as described below. Analyses of cognition by vision status used data from individuals who had measurements of cognition and vision (N = 703). Analyses of cognition by hearing status used individuals who had measurements of cognition and hearing (N = 671).
The ARIC-NCS study recruited individuals at four university-based study sites (Forsyth County, North Carolina; Jackson, Mississippi; the northwest suburbs of Minneapolis, Minnesota; and Washington County, Maryland) aged 45–64 years from 1987 to 1989 and followed them for future health outcomes (The ARIC investigators, 1989). Vision [Jackson and Washington county sites as part of the Eye Determinants of Cognition (EyeDOC) ancillary study] and hearing (all sites) assessments took place from 2017 to 2019, and our analytic sample included those who had data on cognition and vision (N = 1051) or data on cognition and hearing (N = 3591).
All participants provided written informed consent, and the study protocols were approved by either the National Institute of Environmental Health Sciences Review Board (BLSA) or the site-specific Institutional Review Boards at each study center (ARIC).
All analyses were conducted separately in the BLSA and ARIC-NCS samples, and results were compared across the samples to examine similarities and differences in the patterns of findings.
Measures of Sensory Impairment
Vision was assessed monocularly using an Early Treatment of Diabetic Retinopathy chart following standardized protocols (Ferris III, Kassoff, Bresnick, & Bailey, Reference Ferris, Kassoff, Bresnick and Bailey1982) in BLSA and the EyeDOC sub-study of the ARIC-NCS. Participants wore their normal corrective lenses (if any), and the number of letters read was recorded and used to calculate better eye distance visual acuity (in logMAR). Ambient light was measured, and a standard lightbox was used to ensure valid testing could be conducted. For this study, visual impairment was defined as presenting better eye visual acuity worse than 20/40, following guidance of the American Academy of Ophthalmology.
Pure-tone audiometry was used to measure hearing in both BLSA and ARIC-NCS. This is the gold-standard method for evaluating the faintest detectable tones for a range of pitches. The measure is not reliant on higher-order cognition (Pickles, Reference Pickles2012). All participants in BLSA and ARIC-NCS were tested in a sound-attenuating booth that met American National Standards Institute standards, and pure-tone conduction thresholds were obtained using an Interacoustics AD629 or Equinox audiometer (Interacoustics A/S, Assens, Denmark). For those participants assessed during home visits in ARIC-NCS, pure-tone audiometry was conducted with a portable audiometer (Shoebox audiometry, Ottawa, Canada). Ambient level of noise was assessed to ensure that valid testing could be conducted. We defined hearing impairment as having a 4-frequency (.5, 1, 2, 4 kHz) pure-tone average of 25 decibels hearing level or higher in the better-hearing ear (“Prevention of Blindness and Deafness Grades of Hearing Impairment,” n.d.).
Neuropsychological Assessments
Cognitive tests across BLSA and ARIC-NCS cover a range of cognitive domains and rely to varying degrees on vision, hearing, or both. Attentional ability was captured by the Trail-Making test, part A in both BLSA and ARIC-NCS and additionally by the Wechsler Adult Intelligence Scale–Revised (WAIS-R) digits forward task in BLSA (Blackburn & Benton, Reference Blackburn and Benton1957; Reitan, Reference Reitan1986). BLSA and ARIC-NCS both assessed language using semantic and phonemic fluency, as well as the Boston Naming Test (Benton & Hamsher, Reference Benton and Hamsher1976; Williams, Mack, & Henderson, Reference Williams, Mack and Henderson1989). Delayed free recall was assessed in both BLSA [California Verbal Learning Test (CVLT) long delay] and ARIC-NCS (Delayed Recall Task) to assess verbal memory, and BLSA additionally included tests of immediate free recall for words (CVLT short delay) and for visually presented figures (Benton Visual Retention Test) (Benton, Reference Benton1962; Delis, Kramer, Kaplan, & Thompkins, Reference Delis, Kramer, Kaplan and Thompkins1987). We excluded the test of immediate verbal memory from the BLSA analysis due to collinearity with the delayed free recall task. ARIC-NCS additionally included a test of logical memory (Wechsler Memory Scale – Revised paragraph recall test) and a test of incidental learning from the digit symbol substitution task (Smith, Reference Smith and Hellmuth1968; Wechsler, Reference Wechsler1987). Executive function was measured using the WAIS-R digits backwards task, the digit symbol substitution task, and the Trail-Making test, part B in both BLSA and ARIC-NCS (Blackburn & Benton, Reference Blackburn and Benton1957; Reitan, Reference Reitan1958; Ryan & Lopez, Reference Ryan, Lopez, Dorfman and Hersen2001). BLSA also included the WAIS-R Similarities task. Finally, the Card Rotation Test and a clock drawing measure were used in BLSA as additional measures of executive functioning and visuospatial ability (Table 1). Based on the features of administration in the BLSA and ARIC-NCS studies, Boston Naming Test, Trail-Making Test, Parts A and B, the digit symbol substitution test, and tests of figural memory, incidental learning, card rotation, and clock drawing relied primarily on vision. Administrations for category and letter fluency tests, delayed free recall in BLSA, logical memory, WAIS-R digits forward and backwards tests, and the similarities task are more strongly contingent on adequate hearing (Table 1). We acknowledge that the extent to which a cognitive task relies on a sensory ability is a continuous and not a binary notion; thus, these classifications are not intended to be consequential.
Table 1. Cognitive tests included in the Atherosclerosis Risk in Communities Neurocognitive Study (ARIC-NCS) and the Baltimore Longitudinal Study of Aging (BLSA) and their primary sensory modalities
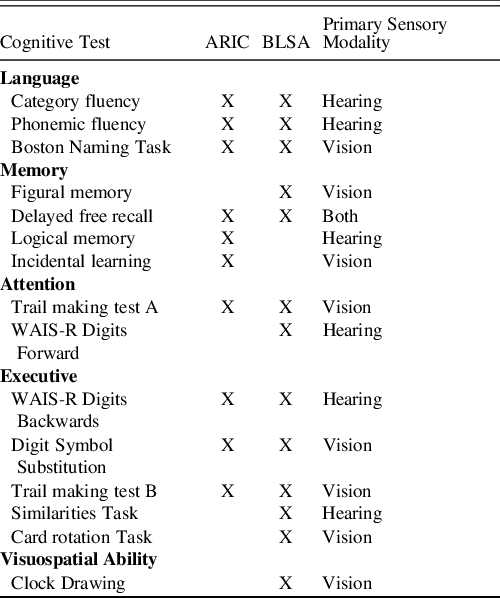
Category fluency was animal naming in ARIC, but the mean of three trials (fruits, animals, vegetables) in BLSA, Phonemic fluency was the sum of three trials in ARIC, but the mean of three trials in BLSA, Boston Naming Task 30 item version was administered in ARIC, Boston Naming Task 60 item version was administered in BLSA. Delayed free recall was from the California Verbal Learning Test in BLSA, but the ARIC designed and used its own free recall test.
Statistical Analysis
We first computed descriptive statistics to characterize the demographics of the BLSA and ARIC-NCS samples. We then used item response theory methods to characterize cognition in the BLSA and ARIC-NCS samples (Lord, Reference Lord1980). To prepare the data, we discretized cognitive test variables into up to 8 categories using an equal interval discretization method (Rucker, McShane, & Preacher, Reference Rucker, McShane and Preacher2015). We collapsed adjoining categories if one category had <5% of the records in the data set or if any indicator had 0 records in either of the groups with vision or hearing impairment (Tables 1 and 2).
Table 2. Demographic characteristics and cognitive test scores in the Atherosclerosis Risk in Communities Neurocognitive Study (ARIC-NCS) and the Baltimore Longitudinal Study of Aging (BLSA)

† Items whose assessments primarily relied solely on vision.
‡ Items whose assessments relied primarily solely on hearing.
Item response theory methods for testing differential item functioning (DIF) seek to disentangle the true effect of sensory impairment on cognitive function from the effect that sensory impairment may have on cognitive test performance (bias). By controlling for underlying levels of cognitive ability, defined based on the collective responses to all test items in a cognitive battery, item response theory methods facilitate the quantification of bias in test performance by sensory impairment status. We used the alignment method in Mplus software (version 8, Muthén & Muthén, Los Angeles, CA) (Asparouhov & Muthén, Reference Asparouhov and Muthén2014; Muthén & Asparouhov, Reference Muthén and Asparouhov2014), which allows for testing of differences between groups on each parameter estimated in the model. The elemental measurement model includes parameters describing (1) the difficulty of each categorical response to a given item (item thresholds) and (2) the strength of the association between a given item and underlying cognitive performance (item discrimination). Alignment analysis expands on this framework by estimating this elemental model in groups defined by sensory impairment status and testing the equivalence of each of the aforementioned parameters across groups. We tested for DIF in the BLSA and ARIC-NCS samples separately. Additional details on these models are available in the Appendix.
To avoid focusing on potentially spurious results and to control for type 1 error, when inspecting DIF by threshold, we concentrated on significant findings at the ends of the threshold ranges, or in instances where multiple sequential thresholds showed significant DIF. Additionally, we examined item characteristic curves by hearing and vision impairment to visually describe the results of the alignment analysis.
We then calculated a measure of salient DIF to determine the impact of DIF by hearing and vision impairment on the estimation of cognition. To quantify the impact of DIF on individual-level estimates of cognitive functioning in BLSA and ARIC–NCS separately, we compared factor scores from a unidimensional confirmatory factor analysis with those from a model that allowed parameter estimates where we identified DIF to vary between either the vision impaired and normal vision groups, or the hearing impaired and normal hearing groups, thus accounting for the DIF that we observed. The difference between estimates of latent cognitive functioning in the first set of models and the second set of models quantifies absolute magnitude of the effect of DIF on estimates of cognition. We evaluated the proportion of people whose differences fall outside one standard error of measurement, as previous work has used this threshold to describe meaningful differences in the classification of cognitive impairment for clinical and research purposes (Cella, Eton, Lai, Peterman, & Merkel, Reference Cella, Eton, Lai, Peterman and Merkel2002; Eton et al., Reference Eton, Cella, Yost, Yount, Peterman, Neuberg and Wood2004; Yost et al., Reference Yost, Sorensen, Hahn, Glendenning, Gnanasakthy and Cella2005).
Sensitivity Analyses
Item response theory methods for the detection of DIF control for latent cognitive ability and therefore also control for differences in demographic factors (such as race or sex) that result in differences in latent cognitive ability. However, it is possible that demographic factors may influence test performance above and beyond their influence on latent cognitive ability, which might affect our findings. To evaluate the sensitivity of our results to the effect of differences in demographic characteristics, we conducted stratified analyses in the ARIC-NCS sample due to its larger sample size. We conducted our primary DIF analysis on subsets of the ARIC-NCS sample stratified into the following groups: those above 77 years old, below 77 years old, those with low educational attainment (high school or lower), high educational attainment, white race, black race, males, and females.
RESULTS
Sample Characteristics
The BLSA sample had a mean age 74.7 years (Standard deviation, SD = 9.0) and was 34.0% black and 55.6% female. In BLSA, 25.2% of participants had a vision impairment and 52.2% of participants had a hearing impairment. The ARIC-NCS sample was older on average (mean age of 79.8 years; SD = 4.7) and was 24.0% black and 59.8% female; 18.2% had a vision impairment, and 73.0% had a hearing impairment (Table 1). Educational attainment was also higher in BLSA (4.6% with high school or equivalent education, 95.1% with greater than high school) than in ARIC-NCS (41.3% with high school or equivalent education, 46.6% with greater than high school). The vision sample in ARIC-NCS, which was composed of participants from two of the four ARIC-NCS sites, had a higher proportion of black participants (46.9%) and a higher proportion of female participants (63.2%) as compared to the overall ARIC-NCS sample who had any sensory impairment measured. There were no other substantial differences between the overall and impairment-specific samples (eTables 3 and 4). In general, people with sensory impairment tended to perform worse on most of the tests in the battery (eTables 5 and 6).
DIF by Vision Impairment
Table 3 presents results in BLSA and separately in ARIC-NCS for DIF by vision impairment, controlling for underlying cognitive performance. In the BLSA sample, there were two instances of DIF by vision impairment. The delayed word recall item was more difficult for those with vision impairment among individuals with low cognitive functioning [Parameter difference (PD) = .62, Standard error (SE) = .28, Standardized effect size (SES) = 2.21]. Additionally, the Boston Naming Test was easier for individuals with vision impairment among those with low cognitive functioning (PD = −.74, SE = .35, SES = −2.11). These findings are also displayed graphically in Figure 1 and eFigures 1–4.
Table 3. Parameter differences by vision impairment from alignment models in the Atherosclerosis Risk in Communities Neurocognitive Study (ARIC-NCS) and the Baltimore Longitudinal Study of Aging (BLSA)

Data show parameter differences (SE), parameter differences are the parameter value in the impaired group – the parameter value in the unimpaired group, and standardized effect sizes can be calculated by dividing the parameter difference by the standard error. We found significant differences in parameters indicating that delayed word recall in BLSA and ARIC-NCS was harder for those with vision impairment. The Boston naming test was easier in both BLSA and ARIC-NCS for those with vision impairment. The digit symbol substitution task was less strongly related to cognition among those with vision impairment in the ARIC-NCS sample.
*=p<.05, **=p<.01.
Table 4. Parameter differences by hearing impairment from alignment models in the Atherosclerosis Risk in Communities Neurocognitive Study (ARIC-NCS) and the Baltimore Longitudinal Study of Aging (BLSA)

Data show parameter differences (SE), parameter differences are the parameter value in the impaired group – the parameter value in the unimpaired group, and standardized effect sizes can be calculated by dividing the parameter difference by the standard error. We found significant differences such that the category fluency test, and the digit symbol substitution task in BLSA, and the delayed word recall test, the incidental learning test, and the phonemic fluency test in ARIC-NCS were harder for those with hearing impairment. The Boston naming test was easier for those with hearing impairment in ARIC-NCS. The delayed word recall and incidental learning tests in ARIC-NCS were more strongly related to cognition in those with hearing impairment.
*=p<.05, **=p<.01.

Fig. 1. Item characteristic curves (ICCs) for items with significant differential item functioning (DIF) in the Atherosclerosis Risk in Communities Neurocognitive Study (ARIC-NCS) (A) and the Baltimore Longitudinal Study of Aging (BLSA) (B). ICCs describe for each threshold of each item the probability of achieving that threshold of that item given a particular level of latent cognitive functioning. For example, DIF on thresholds is evident in the delayed word recall task for those with and without vision impairment in BLSA. The leftmost curve is shifted further right in the impaired group as compared to the group without vision impairment, indicating that the item is easier in the unimpaired group and harder in the group with vision impairment. DIF on discrimination can be visualized by inspecting the ICCs for the incidental learning item for those with and without hearing impairment in ARIC-NCS. The curves in the unimpaired group are more slanted and have a lower slope, indicating that the relationship between the item and the latent cognitive trait is weaker in the unimpaired group as compared to the group with hearing impairment. Dotted lines indicate statistically significant DIF at the p<.05 level.
When evaluating DIF by vision impairment in ARIC-NCS, we saw that delayed word recall was also more difficult in those with vision impairment, but for those at the highest thresholds of cognitive performance (PD=.50; SE=.24; SES = 2.08). Boston Naming Test was again easier for people with vision impairment, but among those at the highest levels of underlying cognitive performance (PD=−.55; SE=.24; SES=−2.29). In this sample, we also observed DIF on the discrimination parameter for the digit symbol substitution task, indicating that the item’s correlation with latent cognition was weaker among those with vision impairment (PD=−.93; SE=.42; SES=−2.21).
DIF by Hearing Impairment
With respect to DIF by hearing impairment using the alignment method, we identified DIF in both the BLSA and ARIC-NCS samples, controlling for underlying cognition (Table 4.). In BLSA, the middle three thresholds of five for the category fluency test (animal naming) (PD=.75, .72, .87; SE=.32, .32, .39; SES = 2.34, 2.25, 2.23) and the first four thresholds of five for the digit symbol substitution test showed DIF (PD = 1.25, .91, .98, 1.01; SE=.37, .37, .41, .46; SES = 3.38, 2.46, 2.39, 2.20) (Table 3). The parameter differences (group with hearing impairment – group without hearing impaired) were positive, indicating that this item was more difficult for those with hearing impairment, after controlling for underlying cognitive function.
In ARIC-NCS, we also saw evidence that the category fluency test (animal naming) was more difficult in participants with hearing impairment at the lowest two thresholds (PD = .85, .34, SE = .23, .14, SES = 3.70, 2.43). This indicates that this test was more difficult for participants with hearing impairment, specifically at the lower ends of the distribution of the latent cognitive trait (in those with lower cognitive functioning). The phonemic fluency task (naming words that start with F, A, and S) was again more difficult in those with hearing impairment at the lowest levels of the cognitive trait distribution (PD = .37; SE = .17; SES = 2.18). The delayed word recall (PD = .26, .40, .38, .33; SE = .12, .09, .09, .10; SES = 2.17, 4.44, 4.22, 3.30) and incidental learning tasks (PD = .35, .31, .33; SE = .10, .10, .14; SES = 3.50, 3.10, 2.36), both of which measure memory, were more difficult for those with hearing impairment across a large range of thresholds. These two items also showed DIF in the discrimination parameter (delayed word recall: PD = .20, SE = .08, SES = 2.5; incidental learning: PD = .35, SE = .11, SES = 3.18), indicating that the tests were more strongly related to the underlying cognitive latent trait in the group with hearing impairment. Finally, we also saw DIF in the Boston Naming Test, such that the item was easier for those with hearing impairment at the highest levels of cognitive functioning (PD = −.28, −.36; SE = .12, .12; SES = −2.33, −3.00).
Sensitivity Analyses
Our sensitivity analyses revealed that our findings were fairly consistent when comparing results stratified by different demographic subgroups (eTables 7 and 8).
Salient DIF
Despite finding evidence of DIF by vision and hearing impairment status in both BLSA and ARIC-NCS, our analysis of salient DIF based on the difference between DIF-adjusted and DIF-unadjusted cognitive scores indicated that there were no instances of DIF which resulted in bias of >1 standard error of measurement in estimated cognitive scores in participants with and without vision and hearing impairment, respectively (Figure 2).

Fig. 2. Differences in differential item functioning (DIF)-adjusted and non-DIF-adjusted factor scores to evaluate salient DIF by Hearing and Vision Impairment in the Atherosclerosis Risk in Communities Neurocognitive Study (ARIC-NCS) and the Baltimore Longitudinal Study of Aging (BLSA). The box and whisker plots show the distribution of individual-level differences in factor scores (a measure of latent cognitive ability) from a model adjusted for DIF and a model ignoring DIF. Dotted vertical lines indicate 0 as well as ± 1 SE of measurement, which is a threshold indicating the presences of clinically meaningful DIF.
DISCUSSION
This study found evidence of DIF by vision impairment status in cognitive test items that did not rely on vision as well as evidence of DIF by hearing impairment status in cognitive test items that did not rely primarily on hearing. This indicates that vision and hearing impairments may affect performance on cognitive testing, controlling for underlying cognitive ability. However, our evaluation of salient DIF indicated that these differences may not lead to substantial differences in measurement of cognitive functioning in older adults by sensory impairment status.
We were able to replicate the main pattern of findings in our results across the two independent samples (ARIC-NCS and BLSA) that we included. However, we found the most evidence of DIF by hearing and vision impairment in more cognitively impaired and less healthy subgroups in both the BLSA and ARIC-NCS samples. Our analysis of comparative cognitive performance in BLSA and ARIC-NCS (eMethods) indicated that underlying cognitive ability was higher in BLSA as compared to the ARIC-NCS sample (eFigure 5). BLSA represents a group of volunteers, who were screened to be healthy at baseline, whereas ARIC-NCS was initially sampled to be population representative. Therefore, participants in ARIC-NCS are on average less healthy and have a larger number of comorbidities (Shock et al., Reference Shock, Greulich, Arenberg, Costa, Lakatta and Tobin1984; The ARIC investigators, 1989). In the analysis of hearing impairment, we found evidence of DIF on 5 of 11 tests in ARIC-NCS but only 2 of 14 tests in BLSA. For the analysis of vision impairment, there was a smaller difference in the number of DIF findings between the samples, as we found evidence of DIF on 2 of 11 items in ARIC and 2 of 14 items in BLSA. However, the measurement of vision in ARIC-NCS entailed selection into the EyeDOC sub-study, which had additional criteria, including requiring participants to score at least a 23/30 in the Jackson, MS site or at least a 25/30 in the Washington County, MD site on the Mini-Mental State Examination.
Items that rely strongly on vision, including the Trail-Making Test, Parts A & B, and clock drawing, did not show evidence of DIF (although digit symbol substitution, which relies on vision did have poorer discrimination). Similarly, items that rely strongly on hearing, i.e., the digit span backwards test and the logical memory test, did not show evidence of DIF. This indicates that, contrary to our hypothesis, among people who had levels of vision and hearing function sufficient to validly complete cognitive testing, there may not be difficulty with test administration due to vision and hearing impairments, respectively. It is possible that participants in BLSA and ARIC-NCS are a selected sample due to having volunteer (BLSA), selection based on cognition (EyeDOC sub-study) and survival bias to measurement of sensory characteristics (BLSA and ARIC-NCS) and that these individuals are better able to compensate for their impairment as compared to the general population of those with hearing and vision impairments.
We observed DIF on vision in tests whose administration do not rely on vision and DIF on hearing in tests whose administration do not rely on hearing. Though this finding is difficult to explain, if verified, it might be consistent with the hypothesis that cognitive load may be playing a role in mediating the effect of sensory impairment on cognitive functioning. Previous studies focusing on hearing impairment have shown that in settings where auditory perception is made more difficult, additional cognitive resources are recruited to help decode sound (Rönnberg et al., Reference Rönnberg, Lunner, Zekveld, Sörqvist, Danielsson, Lyxell and Rudner2013; Tun, McCoy, & Wingfield, Reference Tun, McCoy and Wingfield2009). The Framework for Understanding Effortful Listening draws on this prior evidence and posits that both motivation and demand, which may be affected by sensory impairments, combine to influence perceived effort (Pichora-Fuller et al., Reference Pichora-Fuller, Kramer, Eckert, Edwards, Hornsby, Humes and Wingfield2016). Although there is less evidence from studies directly assessing the impact of degraded visual stimuli on cognitive processes and cognitive load, a similar mechanism could be hypothesized, whereby additional resources are recruited to understand visual cues and fewer cognitive resources are available (Roberts & Allen, Reference Roberts and Allen2016).
The effect of increased cognitive load due to either vision loss or effortful listening may depend on individual-level characteristics, such as working memory capacity (Nitsan, Wingfield, Lavie, & Ben-David, Reference Nitsan, Wingfield, Lavie and Ben-David2019). Our observation of a larger number of DIF findings in less healthy and more cognitively impaired samples may indicate that the effect of cognitive load may play a larger role in these populations. Future research, investigating differences in the effect of cognitive load by characteristics of how individuals perform on encoding trials for memory tasks, or by individual comorbidities and health factors, may provide further insights into the mechanisms that underlie the effects of cognitive load.
Despite finding evidence of DIF on a number of cognitive items, there was little evidence of salient DIF. This indicates the measurement of cognition among most individuals who were able to complete cognitive testing might not be biased due to sensory impairments in these samples. This finding strengthens previous evidence linking hearing and vision impairment with cognitive impairment by suggesting these relationships are likely not explained by differential measurement error in the measurement of cognition in individuals with hearing and vision impairments.
Interestingly, we found that the Boston Naming Test, a visually presented measure of object naming ability, appeared to be easier for those with hearing impairment in ARIC-NCS and easier for those with vision impairment in both BLSA and ARIC-NCS. It is possible that individuals with sensory impairments have compensated for these impairments through different mechanisms. Individuals with hearing impairments may rely more on vision, thus helping them on a visual task like the Boston Naming Test. However, this finding was not consistent across any other visual tasks. It is unexpected that individuals with vision impairment would perform better on this visual task. Even though we approximately replicated this finding in two independent samples, future research should seek to explain and further replicate this finding beyond BLSA and ARIC-NCS.
This study has limitations. First, our samples were restricted to individuals who completed cognitive testing in BLSA and ARIC-NCS. Although we showed that sensory impairment likely does not meaningfully bias measures of cognition among those who complete testing, if missingness in cognitive testing is related to sensory impairment and cognitive ability, the estimation of cognition without accounting for systematic missingness could still be subject to selection bias. Second, there are a number of different methods for evaluating DIF, and different methods test slightly different hypotheses and can lead to different conclusions (Liu, Yin, Xin, Shao, & Yuan, Reference Liu, Yin, Xin, Shao and Yuan2019; Penfield & Lam, Reference Penfield and Lam2000). We chose to use alignment analysis to test for DIF in our sample, as alignment analysis easily allows for the testing of DIF by various parameters. This statistical approach is appropriate to the questions that we sought to address (Asparouhov & Muthén, Reference Asparouhov and Muthén2014). Fourth, the confirmatory factor analysis models used in this study make a missing at random assumption (Muthén, Kaplan, & Hollis, Reference Muthén, Kaplan and Hollis1987). This assumption requires that missingness in the sample must be able to be explained by the other variables included in the analysis. However, this assumption may be violated if individuals with sensory impairment have missing values for the tests that are most affected by their impairments, as in this case their non-missing data may not fully reflect their underlying cognitive abilities. Ongoing work will further investigate the potential ramifications of data missing not at random in the detection of DIF. Fifth, as the framework for testing for DIF involves a large number of hypothesis tests (for each discrimination and threshold parameter), there is a risk of multiple comparisons. However, we did not apply a multiple comparisons correction, as the goal of the paper was to examine the patterns of findings across the range of tests examined, rather than to interpret individual findings. To avoid interpreting findings that may have been due to chance, we focused on instances where there were multiple significant adjacent thresholds or significant thresholds at the ends of the distribution of thresholds. We found that overall, of the 286 tests of DIF conducted, there were 29 significant findings (10.1%), greater than double the 5% level that would be expected due to random chance. Sixth, if most items in a battery have DIF, the alignment algorithm may interpret these items as representative of the true relationship between sensory impairment and cognition; in such a setting, items that demonstrate the true underlying relationship might be erroneously identified as having DIF. We suspect this may potentially explain some of our unexpected findings in which DIF favors the impaired group. Future research is needed to confirm and further explore and disentangle potential effects as well as resulting implications.
In this study, we report evidence of DIF by hearing impairment for items that do not rely on hearing and evidence of DIF by vision impairment for items that do not rely on vision, which could be consistent with the cognitive load hypothesis. Despite finding DIF in these samples, there was no evidence of salient DIF. Therefore, in well-conducted studies where neurocognitive testing is done in a quiet, face-to-face setting, sensory impairments may not impact the measurement of latent cognitive ability, among individuals who complete cognitive testing. Future research should further explore the potential effects of selection bias related to missing cognitive testing data on investigations of the association between sensory impairments and cognition. Additionally, studies in other samples are needed, as we found differences in DIF by sensory impairments between the BLSA and ARIC-NCS samples.
SUPPLEMENTARY MATERIAL
To view supplementary material for this article, please visit https://doi.org/10.1017/S1355617721000400
ACKNOWLEDGEMENTS
Ms. Nichols conducted statistical analyses and wrote the manuscript. Dr. Gross designed the study, designed the study’s analytic strategy, conducted statistical analyses, and revised the manuscript. Dr. Deal and Dr. Swenor designed the study, designed the study’s analytic strategy, and revised the manuscript. Dr. Abraham, Dr. Resnick, Dr. Sharrett, Dr. Reed, Dr. Mosley, and Dr. Griswold supervised data collection for contributing studies and critically reviewed the manuscript. Dr. Armstrong, Dr. Carlson, Dr. Lin, and Dr. Ramulu critically reviewed the manuscript. The Atherosclerosis Risk in Communities Study is carried out as a collaborative study supported by National Heart, Lung, and Blood Institute contracts (HHSN268201700001I, HHSN268201700002I, HHSN268201700003I, HHSN268201700005I, and HHSN268201700004I). Neurocognitive data are collected by U01 2U01HL096812, 2U01HL096814, 2U01HL096899, 2U01HL096902, 2U01HL096917 from the NIH (NHLBI, NINDS, NIA, and NIDCD), and with previous brain MRI examinations funded by R01-HL70825 from the NHLBI. The BLSA is supported by the Intramural Research Program, NIA/NIH. The authors thank the staff and participants of the BLSA and ARIC studies as well as the EyeDOC study for their important contributions. The EyeDOC website is located at: https://www.hopkinsmedicine.org/wilmer/research/dana-center/research/eyedoc.html.
FINANCIAL SUPPORT
This work was supported by the National Institute for Health/National Institutes of Aging (NIH/NIA) R21AG060243. Dr. Deal was supported by NIH/NIA K01AG054693. Dr. Swenor was supported by NIH/NIA K01AG052640. Dr. Gross was supported by K01AG050699. Dr. Lin, Reed, and Deal were funded in part by the Centers for Cochlear Health. The EyeDOC study is generously funded by the National Institute of Aging: R01AG052412. This work was supported in part by the Intramural Research Program, National Institute on Aging, NIH.
CONFLICTS OF INTEREST
Nicholas S. Reed is on the scientific advisory board (non-financial) Shoebox, Inc. and Good Machine Studio. Frank R. Lin is a consultant to Frequency Therapeutics, a speaker honoraria from Caption Call and a director of a research center funded in part by a philanthropic gift from Cochlear Ltd to the Johns Hopkins Bloomberg School of Public Health. No other authors have conflicts of interest.


