


INTRODUCTION
Brief and accurate cognitive screening tools that can reliably identify and map cognitive changes over time are essential for use in cognitive disorders and dementia clinics. Early identification of such cognitive changes enables timely psychosocial interventions and support services that can maximize quality of life for both the person with dementia and their carers (de Vugt & Verhey, Reference de Vugt and Verhey2013; DeKosky & Marek, Reference DeKosky and Marek2003).
One screening tool is the Addenbrooke’s Cognitive Examination (ACE) (Mathuranath, Nestor, Berrios, Rakowicz, & Hodges, Reference Mathuranath, Nestor, Berrios, Rakowicz and Hodges2000). The ACE was developed to address the poor coverage of cognitive domains and low diagnostic accuracy of another popular screening tool, the Mini-Mental State Examination (MMSE) (Folstein, Folstein, & McHugh, Reference Folstein, Folstein and McHugh1975). The ACE examines the integrity of five cognitive domains (attention and orientation, memory, verbal fluency, language, and visuospatial skills), summed to create a total score out of 100 points. The ACE also contains the MMSE items, so that this score could be generated from the ACE results.
In its second iteration, the ACE-R expanded the scope of some subtests, and introduced five defined cognitive domain subscores (Mioshi, Dawson, Mitchell, Arnold, & Hodges, Reference Mioshi, Dawson, Mitchell, Arnold and Hodges2006). The most recent revision, the ACE-III, was initiated in part to address the copyright issue associated with the MMSE items. As such, the MMSE items, which were part of the ACE-R, were replaced with items with similar face validity and difficulty (Hsieh, Schubert, Hoon, Mioshi, & Hodges, Reference Hsieh, Schubert, Hoon, Mioshi and Hodges2013). Additional improvements included the removal of items that were too culturally specific (“No ifs, ands, or buts”) (Valcour, Masaki, & Blanchette, Reference Valcour, Masaki and Blanchette2002), had low correlations with each other despite putatively loading on the same domain (Serial 7 Subtraction and Spelling WORLD backward) (Ganguli et al., Reference Ganguli, Ratcliff, Huff, Belle, Kancel, Fischer and Kuller1990), or suffered from ceiling effects (the comprehension items) (Brugnolo et al., Reference Brugnolo, Nobili, Barbieri, Dessi, Ferro, Girtler and Rodriguez2009).
Validation studies have shown the domain scores of the ACE-III to have good convergent validity with other standardized neuropsychological tests. There were significant correlations between the language domain score and the Sydney Language Battery total score (r=0.86), the visuospatial domain and the Rey-Osterrieth Complex Figure Copy score (r=0.77), the attention domain and Digit Span total score (r=0.42), and the memory domain and performance on the immediate recall trial of the Rey Auditory Verbal Learning Test (r=0.59) (Hsieh et al., Reference Hsieh, Schubert, Hoon, Mioshi and Hodges2013; Matias-Guiu, Cortes-Martinez, et al., Reference Matias-Guiu, Cortes-Martinez, Valles-Salgado, Rognoni, Fernandez-Matarrubia, Moreno-Ramos and Matias-Guiu2017).
The ACE-III is also sensitive to cognitive changes on a spectrum from mild cognitive impairment to severe dementia (Jubb & Evans, Reference Jubb and Evans2015; Matias-Guiu, Cortes-Martinez, et al., Reference Matias-Guiu, Cortes-Martinez, Valles-Salgado, Rognoni, Fernandez-Matarrubia, Moreno-Ramos and Matias-Guiu2017). The ACE-III is used worldwide and is available in several languages (Matías-Guiu et al., Reference Matías-Guiu, Fernández-Bobadilla, Fernández-Oliveira, Valles-Salgado, Rognoni, Cortés-Martínez and Matías-Guiu2016; Pigliautile et al., Reference Pigliautile, Ricci, Mioshi, Ercolani, Mangialasche, Monastero and Mecocci2011; Torralva et al., Reference Torralva, Roca, Gleichgerrcht, Bonifacio, Raimondi and Manes2011; Yoshida et al., Reference Yoshida, Terada, Honda, Kishimoto, Takeda, Oshima and Uchitomi2012), many of which are freely available from our website (www.ftdrg.org). Importantly, the diagnostic accuracy of the ACE-III is as good, if not better, than other standardized screening instruments, including the Rowland Universal Dementia Assessment Scale (RUDAS), the Montreal Cognitive Assessment (MoCA), the Memory Impairment Screen (MIS), and the MMSE (Cheung et al., Reference Cheung, Clugston, Croucher, Malone, Mau, Sims and Gee2015; Matias-Guiu, Valles-Salgado, et al., Reference Matias-Guiu, Valles-Salgado, Rognoni, Hamre-Gil, Moreno-Ramos and Matias-Guiu2017). Importantly, our own studies have shown that the sensitivity and specificity of the ACE-III are similar to those of the ACE-R at the cutoffs previously recommended: 88 (sensitivity=1.0; specificity=0.96) and 82 (sensitivity=0.93; specificity=1.0) (Hsieh et al., Reference Hsieh, Schubert, Hoon, Mioshi and Hodges2013).
Several questions, however, remain. First, it is unclear whether scores on the ACE-R and ACE-III are directly comparable. Indeed, direct comparisons between the two versions of the test, or whether the scores need to be converted (and by how much), have not yet been reported. Second, in keeping with previous versions, the ACE-III proposes two cutoff scores to detect dementia: 88 and 82/100. Although these ACE-III scores appear to retain similar sensitivity and specificity to the ACE-R, they may vary depending on dementia subtype and/or context (Elamin, Holloway, Bak, & Pal, Reference Elamin, Holloway, Bak and Pal2016; Hsieh et al., Reference Hsieh, Schubert, Hoon, Mioshi and Hodges2013; Jubb & Evans, Reference Jubb and Evans2015). Moreover, these scores were derived in relatively small populations of less than 100 patients, and the only studies with larger sample sizes have been conducted in non-English speaking countries (Matias-Guiu, Cortes-Martinez et al., Reference Matias-Guiu, Cortes-Martinez, Valles-Salgado, Rognoni, Fernandez-Matarrubia, Moreno-Ramos and Matias-Guiu2017; Qassem et al., Reference Qassem, Khater, Emara, Rasheedy, Tawfik, Mohammedin and Abdel Aziz2015). Large studies are, therefore, needed to confirm the cutoff scores and to characterize normal performance on the ACE-III in healthy English-speaking older adults.
Finally, to date, the relationship between ACE-III performance and everyday functioning has not been systematically examined. How overall cognition is related to an individual’s functional capacity and whether this relationship is similar across different clinical syndromes has been relatively underexplored. This is an important variable to consider, given the diversity of clinical dementia presentations, and their likely variability across daily functioning and cognitive deficits (Hodges, Bozeat, Ralph, Patterson, & Spatt, Reference Hodges, Bozeat, Ralph, Patterson and Spatt2000; Mioshi et al., Reference Mioshi, Kipps, Dawson, Mitchell, Graham and Hodges2007). For instance, patients presenting with predominant memory (Alzheimer’s disease: AD), behavior (behavioral-variant frontotemporal dementia: bvFTD), expressive language (progressive non-fluent aphasia: PNFA, logopenic progressive aphasia: LPA) or receptive language (semantic dementia: SD) problems may experience comparable day-to-day functional burden but for different reasons. A small study of 39 patients with non-specified dementia showed that measures of everyday function were strongly related to ACE-III performance, more so than to the MoCA or the MMSE (Giebel & Challis, Reference Giebel and Challis2016). Because of the limited sample size and exploratory nature of the study, however, specific analyses in different subtypes of dementia were not conducted.
This study aimed to establish the psychometric properties of the ACE-III in a large population of healthy individuals and patients with dementia to address some of the limitations of previous studies. In doing so, this study aimed to: (i) determine the nature and degree of any differences between the ACE-III and ACE-R total and domain scores, as well as provide a method to convert scores between the two tests; (ii) establish appropriate dementia cutoff scores and “normal” performance on the ACE-III, and (iii) examine the relationship between ACE-III scores and everyday functioning, stratified by dementia subtype.
This study was approved by the South Eastern Sydney Local Area Health District and the University of New South Wales Ethics committees. Consent to take part in the study was obtained from all participants or their Person Responsible in accordance with the Declaration of Helsinki.
STUDY 1: COMPARISONS BETWEEN THE ACE-R AND ACE-III
Methods
Participants
Two hundred fifty-one individuals (199 diagnosed with dementia; 52 healthy control volunteers) seen at FRONTIER, the clinical dementia research group in Sydney, Australia, were included in this study (Table 1). Patients were excluded if they were not proficient in English, did not have a reliable informant, or were unable to complete the assessment. All patients underwent a clinical examination and cognitive assessment and met the relevant clinical diagnostic criteria at the time of testing: bvFTD (Rascovsky et al., Reference Rascovsky, Hodges, Knopman, Mendez, Kramer, Neuhaus and Miller2011), typical AD (McKhann et al., Reference McKhann, Knopman, Chertkow, Hyman, Jack, Kawas and Phelps2011), PNFA, SD, LPA (Gorno-Tempini et al., Reference Gorno-Tempini, Hillis, Weintraub, Kertesz, Mendez, Cappa and Grossman2011), corticobasal syndrome (CBS) (Mathew, Bak, & Hodges, Reference Mathew, Bak and Hodges2012), progressive supranuclear palsy (PSP) (Litvan et al., Reference Litvan, Agid, Calne, Campbell, Dubois, Duvoisin and Zee1996), frontotemporal dementia-motor neuron disease (FTD-MND) (Strong et al., Reference Strong, Grace, Freedman, Lomen-Hoerth, Woolley, Goldstein and Figlewicz2009), motor neuron disease (MND) (Costa, Swash, & de Carvalho, Reference Costa, Swash and de Carvalho2012), or posterior cortical atrophy (PCA) (Tang-Wai et al., Reference Tang-Wai, Graff-Radford, Boeve, Dickson, Parisi, Crook and Petersen2004).
Table 1 Study 1: Demographic characteristics for each patient group and heathy controls

Note. Values are mean (standard deviation).
bvFTD=behavioral-variant frontotemporal dementia, AD=Alzheimer’s disease, SD=semantic dementia, NOS=dementia not otherwise specified, PNFA=progressive nonfluent aphasia, LPA=logopenic progressive aphasia, CBS=corticobasal syndrome, mixed FTD=mixed frontotemporal dementia, MND=motor neuron disease, FTD-MND=frontotemporal dementia-motor neuron disease, PCA = posterior cortical atrophy, PSP=progressive supranuclear palsy; ACE-III=Addenbrooke’s Cognitive Examination – Third Edition, ACE-R=Addenbrooke’s Cognitive Examination – Revised, CDR=Clinical Dementia Rating Scale, SoB=Sum of Boxes. a Number of missing values: Controls=41, bvFTD=5, AD=10, SD=4, NOS=7, PNFA=3, LPA=2, CBS=3, FTD-MND, MND or mixed FTD=4, PCA=1.
Diagnosis was established by multidisciplinary consensus between the neurologist, neuropsychologist and an occupational therapist after reviewing the clinical, cognitive, and (when available) imaging data. Patients with reported cognitive difficulties that did not fit within specific diagnostic criteria for dementia, not otherwise specified (NOS), were also included in the study.
Healthy controls were recruited from a research volunteer panel and local community clubs. Similar to the patients, all controls underwent cognitive testing and had a brain MRI scan (see Supplementary Material for details of the cognitive assessment of study participants). All healthy controls scored 88 or above on the ACE-R (Mioshi et al., Reference Mioshi, Dawson, Mitchell, Arnold and Hodges2006), with the exception of one individual who scored 85, but was well-within normal limits on all other neuropsychological tests and displayed a normal MRI. Exclusion criteria for all participants included prior history of mental illness, significant head injury, movement disorders, cerebrovascular disease, alcohol and other drug abuse, and limited English proficiency.
Cognitive testing
All participants were tested on the same day on the ACE-R and the addendum (novel) ACE-III items. To minimize practice effects, the testing order was counterbalanced whereby the ACE-III addendum items were administered either before or after the administration of the ACE-R. The ACE-III total score was calculated using the items common to the ACE-III and ACE-R, together with the ACE-III addendum items. Testing was conducted by a neuropsychologist or researcher trained in cognitive assessment. The addendum ACE-III items are described in detail in the Supplementary Materials (see also Hsieh et al., Reference Hsieh, Schubert, Hoon, Mioshi and Hodges2013).
Statistical analyses
Data were analyzed using IBM SPSS version 24.0. Here, analyses focused on the ACE-III scores that were modified from their ACE-R counterparts (i.e., overall score and attention, language, and visuospatial scores). Scores were first checked for normality using the Shapiro-Wilks Test. As the results showed that none of these variables were normally distributed (all p values<.001), the Wilcoxon Signed Rank Test was used to compare ACE-III scores to their respective ACE-R scores.
For Study 1, we used the data of all participants (n=251) and ran four linear regressions between the ACE-III (predictor variable) total, attention, language, and visuospatial functioning scores and their respective ACE-R scores (outcome variable). The regression equations obtained were used to derive conversion formulae. This process was repeated with each different dementia type, to obtain conversion formulae between the ACE-III and ACE-R as a function of diagnostic group.
Autocorrelation in these regression models was measured using the Durbin-Watson test, and outliers were counted (defined as cases with residuals>2 standard deviations from zero). Normality of residuals was assessed using the Shapiro-Wilks test, while homoscedasticity was examined using a scatterplot of residuals against the regression predicted values.
Finally, we explored whether specific domain scores could account for differences between the ACE-R and ACE-III. First, the domain scores were converted into percentages. Then, a two-way repeated-measures analysis of variance (ANOVA) was conducted with test (ACE-R vs. ACE-III) and cognitive domain (attention vs language vs visuospatial) as the variables of interest. Helmert contrasts were conducted to further characterize differences between the ACE-III and ACE-R domain scores.
Results
Significant differences between the ACE-III and ACE-R total, attention, and language scores were present (all p values<.001). The visuospatial score was not significantly different between test versions (Z=-.895; p=.371). Overall, all regression equations were significant, indicating that performance on these two versions of the ACE is highly related (all p values<.001; Table 2). The regression equations were used to convert between ACE-III and ACE-R total score and domain scores. The analyses between these corresponding scores demonstrated that overall, the ACE-III total and attention scores were consistently 1 point lower than their ACE-R counterparts. Significant differences between pairs were also present for the other cognitive domain scores but reflected a difference of less than 1 point. Analyses conducted on each dementia subtype separately provided similar results; a 2- to 3-point drop was observed between ACE-R and ACE-III total and attention scores, with the largest difference observed in the CBS group.
Table 2 Study 1: Conversion equations between ACE-III and ACE-R scores and R2 values, all participants combined
*=significant at the p<.001 level (outliers removed). A calculator to convert between ACE-R and ACE-III scores for each dementia type is provided in the Supplementary Materials.
ACE-III=Addenbrooke’s Cognitive Examination – Third Edition, ACE-R=Addenbrooke’s Cognitive Examination – Revised.
Finally, a two-way repeated-measures ANOVA was carried out on the scores to determine the source of differences across ACE-R and ACE-III subtests. The analyses revealed a significant test by domain interaction (F(2,500)=64.655; p<.001). Post hoc tests revealed that this interaction was driven by the difference on the attention score between the ACE-R and ACE-III (p<.001) and not the language and visuospatial scores (p value=.541) (Figure 1).
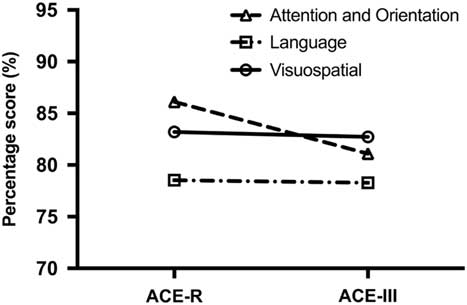
Fig. 1 Differences between ACE-R and ACE-III domain scores. The Attention and Orientation score has the greatest drop in score from the ACE-R to the ACE-III.
Discussion
Our results revealed significant differences between the two versions of the ACE for total and domain scores, with the exception of the visuospatial domain score. Our regression equations, however, demonstrated that the magnitude of these differences is small, ranging between <1 and 3 points lower on the ACE-III than on the ACE-R, even when accounting for different dementia types. Although statistically significant, these differences are unlikely to be clinically meaningful. Our results also showed that differences between the ACE-III and ACE-R were primarily driven by discrepancies on the attention domain, with no appreciable differences across the language and visuospatial domains (Figure 1).
Having established the correspondence between the ACE-R and the ACE-III, the next aim was to identify the most relevant cutoff scores for dementia on the ACE-III in a large undifferentiated sample of individuals with dementia.
STUDY 2: DEVELOPMENT OF ACE-III CUTOFF SCORES FOR DEMENTIA
Methods
Participants
All 251 individuals from Study 1 (199 patients with dementia; 52 healthy controls) were included in this study, as well as an additional 167 participants (132 patients with dementia; 35 healthy controls) who had completed the ACE-III as part of their clinical assessment, for a total of 418 individuals (331 dementia patients; 87 healthy controls) (Table 3; see Supplementary Table 1 for the demographic characteristics of each dementia group). Methods of recruitment and selection of participants were identical to those described in Study 1.
Table 3 Study 2: Demographic characteristics for the healthy controls and the dementia patient group

*=significant at the p<.01 level, **=significant at the p<.001 level. Values represent mean (standard deviation). In order of prevalence, the dementia group include patients with behavioral-variant frontotemporal dementia, Alzheimer’s disease, dementia not otherwise specified, semantic dementia, logopenic progressive aphasia, progressive non-fluent aphasia, corticobasal syndrome, mixed frontotemporal dementia or motor neuron disease or frontotemporal dementia with motor-neuron disease, progressive supranuclear palsy, and posterior cortical atrophy.
Statistical analyses
For Study 2, before analyses, all variables were checked for normality of distribution using Shapiro-Wilks test. Independent t tests were run to examine potential differences in demographic characteristics (e.g., age, education) between the combined patient group and controls. Control performance scores were used to generate a set of normative data for the ACE-III total score and domain scores. Years of education was missing for 8 healthy controls; their data were, therefore, excluded from these analyses. Four two-way ANOVAs were conducted to examine differences in ACE-III total, attention, visuospatial, and language scores across age (50–65 years vs. 66–71 years vs. 72+ years) and education (< 14 years vs. ≥ 14 years) in the healthy controls.
A receiver operator characteristic (ROC) curve was used to obtain sensitivity and specificity for a range of different cutoff scores to differentiate between healthy controls and patients with dementia using the entire sample. Positive and negative predictive values for the same range of cutoff scores were also calculated.
Results
Controls were significantly older than the patients with dementia (mean difference=2.8 years; t(419)=2.734; p=.007), and they had greater years of education (mean difference=1.7 years; t(408)=4.615; p<.001) (Table 3). Within the healthy control group, analyses showed no effect of age on the ACE-III total or domain scores (all F tests<2; p values>.24), and no interactions between age and education (all F tests<2; p values>.36). A significant main effect of education was, however, observed on the ACE-III total (F(1,73)=9.930; p=.002), language (F(1,73)=5.288; p=.024) and memory scores (F(1,73)=9.103; p=.004), whereby higher education resulted in higher scores (Supplementary Table 2). As such, we generated ACE-III normative total and domain scores stratified into three age groups (50–65 years, 66–71 years, 72+ years) and two levels of education (≥ 14 years and<14 years) (Supplementary Table 3).
The ROC analysis revealed an area under the curve of .959 (95% CI .941–.976; p<.001), in differentiating patients with dementia from healthy controls. Two optimal cutoff scores were identified: A low cutoff score (84/100) which maximized specificity (100%) with moderate sensitivity (79%), and a high cutoff score (88/100), which improved sensitivity (86%), while maintaining high specificity (95%). Sensitivity and specificity, and positive and negative predictive values, for scores between 80 and 90 are provided in Table 4. Figure 2 shows the ACE-III scores of controls and patients with dementia, with cutoff scores highlighted.
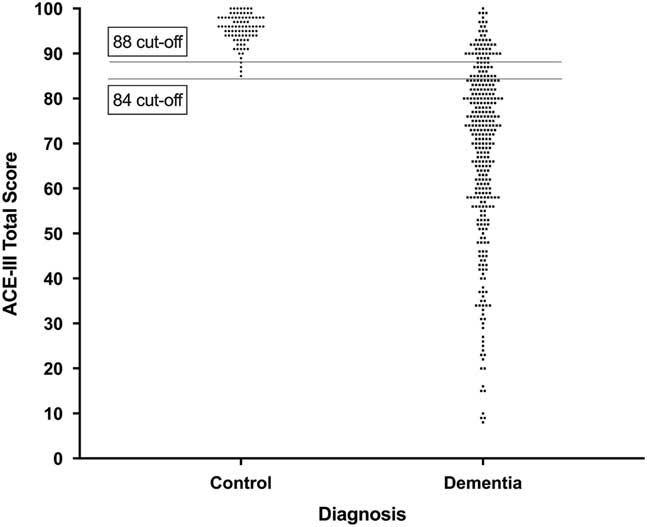
Fig. 2 Distribution of ACE-III total scores in healthy controls and patients with dementia. Lower and upper cutoff scores of 84 and 88 are displayed. Each dot represents one data point.
Table 4 Sensitivity, specificity, positive and negative predictive values of the ACE-III according to total score
Note. Recommended upper and lower bound cutoff scores are shaded in gray.
Discussion
Our analyses on ACE-III total scores identified two cutoff scores that provide high sensitivity and specificity in detecting dementia. The high cutoff score (88/100) is identical to that of the ACE-R. Notably, however, the low cutoff score of 84/100 points, which achieves 100% specificity, while retaining 79% sensitivity, is 2 points higher than its ACE-R counterpart (Mioshi et al., Reference Mioshi, Dawson, Mitchell, Arnold and Hodges2006). This new cutoff likely reflects the novel items used in the attention domain in the ACE-III, as highlighted in Study 1.
STUDY 3: RELATIONSHIPS BETWEEN THE ACE-III AND FUNCTIONAL IMPAIRMENT
Methods
Participants
One hundred ninety-four patients with dementia (bvFTD=67; typical AD=54; SD=27; LPA=23; PNFA=23) from Study 1 and 2 participated, each with an informant at the assessment (Table 5). Patients with a predominantly motor syndrome (i.e., CBD, PSP, FTD-MND) or with marked vision impairment (i.e., PCA, PSP) were excluded. Methods of recruitment, selection and assessment of study participants were identical to those described in Study 1 and 2.
Table 5 Study 3: Demographic characteristics for the patient groups

Note. Values are mean (standard deviation).
bvFTD=behavioral-variant frontotemporal dementia, AD=Alzheimer’s disease, SD=semantic dementia, PNFA=progressive nonfluent aphasia, LPA=logopenic progressive aphasia.
Cognition and dementia severity assessment
All patients completed the ACE-III. Spouses, relatives, or carers of patients completed a questionnaire version of the Clinical Dementia Rating Scale (CDR). The CDR is a clinical staging tool that assesses six cognitive and functional domains: memory, orientation, judgement and problem solving, community affairs, home and hobbies, and personal care (Morris, Reference Morris1997). The CDR Sum of Boxes (SoB) score was used as an overall measure of functional ability, with higher scores representing worse day-to-day functioning (mild: 4.5–9.0; moderate: 9.5–15.5; severe:>15.5) (O’Bryant et al., Reference O’Bryant, Waring, Cullum, Hall, Lacritz and Massman2008).
Statistical analyses
Patients were stratified by dementia subtype (AD, bvFTD, PNFA, LPA, and SD), and general linear regression equations were obtained for each dementia subtype by regressing the total ACE-III score (predictor variable) against the CDR SoB (outcome variable). A regression model was also obtained for the overall dementia group. Outliers in these models, defined as cases with residuals>2 standard deviations from zero, were counted. Normality of residuals in these regression equations was assessed using the Shapiro-Wilks test and homoscedasticity was examined using a scatterplot of residuals against the regression predicted values.
Results
No significant group differences were observed for age (F(4,184)=0.435; p=.783), education (F(4,184)=1.179; p=.322), or disease duration (F(4,184)=1.564; p=.186) across the different subtypes of dementia.
The regression equations between the ACE-III and the CDR SoB were significant for all dementia subtypes with the exception of the SD group. These models indicated that CDR SoB accounted for between 17% (bvFTD) and 49% (LPA) of the ACE-III score variance (Table 6). Some of the models (bvFTD, PNFA, and Overall Dementia), however, were heteroscedastic and showed non-normally distributed residuals, with several influential cases with high leverage.
Table 6 Study 3: Regression equations as a function of diagnosis

*=significant at the p<.01 level, **=significant at the p<.001 level.
ACE-III=Addenbrooke’s Cognitive Examination – Third edition, CDRSoB=Clinical Dementia Rating Scale Sum of Boxes score, AD=Alzheimer’s disease, bvFTD=behavioral-variant frontotemporal dementia, PNFA=progressive non-fluent aphasia, LPA=logopenic progressive aphasia, SD=semantic dementia.
Table 7 provides ACE-III total cutoff scores for different functional severity levels in common dementia syndromes. These scores were obtained by applying the dementia staging SoB cutoff scores of the CDR (O’Bryant et al., Reference O’Bryant, Waring, Cullum, Hall, Lacritz and Massman2008) to the above mention regression equations (Table 6). These scores varied for each group, but generally the cutoff for mild, moderate, and severe dementia lay around 65, 50, and 20, respectively. The bvFTD group consistently had the highest score for each cutoff at 76, 62, and 43, while the LPA consistently had the lowest score at each cutoff, at 54, 25, and 0.
Table 7 Study 3: ACE-III cutoff scores for mild, moderate, and severe dementia according to the CDR
ACE-III=Addenbrooke’s Cognitive Examination – Third edition, CDR=Clinical Dementia Rating Scale, AD=Alzheimer’s disease, bvFTD=behavioral-variant frontotemporal dementia, PNFA=progressive non-fluent aphasia, LPA=logopenic progressive aphasia.
Discussion
Consistent with previous work (Giebel & Challis, Reference Giebel and Challis2016), our findings confirm the relationship between cognitive and functional ability in dementia. Our analyses showed a significant relationship between overall ACE-III performance and CDR scores in all dementia subtypes, with the exception of SD. Derived from our regression equations, we have provided ACE-III cutoff scores that correspond to the levels of functional severity in the most common dementias (Table 7). These cutoff scores should be interpreted with some caution as some of the regression equations were found to violate certain statistical assumptions. Nevertheless, these results provide an important step toward understanding the relationship between cognitive deficit and functional impairment in different dementia syndromes.
General Discussion
This study is the largest and most comprehensive investigation of the ACE-III to date. It demonstrates that, similar to its predecessors, the ACE-III remains an excellent screening tool for the identification of dementia (Hsieh et al., Reference Hsieh, Schubert, Hoon, Mioshi and Hodges2013; Matias-Guiu, J.A., Cortes-Martinez, et al., Reference Matias-Guiu, Cortes-Martinez, Valles-Salgado, Rognoni, Fernandez-Matarrubia, Moreno-Ramos and Matias-Guiu2017), even in a large, heterogeneous dementia sample. We also reveal the high sensitivity and specificity of the ACE-III, as well as its relationship to functional impairment in the most common dementia syndromes.
Since its significant revision in 2013, and the removal of the MMSE items, one recurring question regarding the ACE-III has been how well it compares to its predecessor, the ACE-R. Here we demonstrate that, despite changes in several items, the magnitude of difference between the ACE-R and ACE-III total scores is negligible at a clinical level. In our large sample of dementia patients, we found that the total score on the ACE-III is broadly 1 point lower than on the ACE-R, a difference that is primarily driven by changes in the attention subscale (Ganguli et al., Reference Ganguli, Ratcliff, Huff, Belle, Kancel, Fischer and Kuller1990). Accordingly, patients initially assessed with the ACE-R can be confidently reassessed with the ACE-III, given that the total and remaining subdomain scores are comparable across versions.
Importantly, our analyses demonstrate that this concordance between the two versions of the ACE holds irrespective of diagnostic category, albeit with some variation contingent on dementia subtype. As such, in cases with an established diagnosis, and where disease progression is of primary interest, we provide a calculator to derive scores between ACE versions for the main dementia syndromes (Supplementary Materials; also available at www.ftdrg.org).
It is worth noting, however, that this calculator cannot account for the variability in conversion scores as dementia progresses. It may be the case that the neurodegenerative process affects the corresponding items on the ACE-III and ACE-R at different rates. Future studies may find it worthwhile to investigate the differences between the ACE-R and ACE-III as a function of dementia severity. Additionally, this calculator was developed using the English version of the ACE-R and ACE-III and, therefore, further studies of the same nature will need to be conducted for non-English versions of the ACE.
The validity of the ACE-III as a screening instrument for dementia with high diagnostic accuracy was further demonstrated in Study 2 (see also Hsieh et al., Reference Hsieh, Schubert, Hoon, Mioshi and Hodges2013; Matias-Guiu, Valles-Salgado, et al., Reference Matias-Guiu, Valles-Salgado, Rognoni, Hamre-Gil, Moreno-Ramos and Matias-Guiu2017). Our analyses indicate that whereas the original lower cutoff score of 82/100 retains respectable sensitivity and specificity, a cutoff score of 84/100 improves sensitivity without compromising the specificity of the test. In contrast, the upper cutoff score of 88/100 remains unchanged.
The current study had some limitations. Our control group was highly educated, with 70% of participants reporting more than 12 years of education, compared to 28% reported in the general Australian adult population over 65 years of age (ABS, 2012), and demonstrated significantly higher years of education than the dementia group. This is relevant as positive correlations between ACE-III performance and education have been reported (Jubb & Evans, Reference Jubb and Evans2015; Matías-Guiu et al., Reference Matías-Guiu, Fernández-Bobadilla, Fernández-Oliveira, Valles-Salgado, Rognoni, Cortés-Martínez and Matías-Guiu2016; Qassem et al., Reference Qassem, Khater, Emara, Rasheedy, Tawfik, Mohammedin and Abdel Aziz2015). To this point, it is possible that our highly educated control group inflated the specificity and positive predictive values in Study 2 and, therefore, false positives could occur when clinicians use our revised recommended lower bound cutoff ACE-III score of 84/100 (compared with 82) in healthy individuals with less than 12 years of education.
Furthermore, as the number of control participants was quite low, the stratification process resulted in small numbers of controls in each age and education cell. Additional investigations with larger samples of healthy individuals of a wider range of educational backgrounds are, therefore, warranted. It will be important to confirm these findings in cohorts of individuals with diverse cognitive deficits, such as mild cognitive impairment, and how performance in this population compares to that of dementia patients. Similarly, it will be important to establish the contribution of other potential variables (e.g., age, socioeconomic status, cultural background) to test performance.
Finally, we identified a relationship between ACE-III and functional ability as measured by the CDR, whereby cognitive dysfunction was positively related to functional impairment in all dementia groups, except SD. The most robust statistical models were obtained for the AD and LPA groups, a finding that may reflect the loading of memory and orientation items on the CDR (Morris, Reference Morris1997), and the fact that these capacities are typically compromised in AD and LPA (Flanagan, Tu, Ahmed, Hodges, & Hornberger, Reference Flanagan, Tu, Ahmed, Hodges and Hornberger2014; Weintraub, Wicklund, & Salmon, Reference Weintraub, Wicklund and Salmon2012). In contrast, no significant relationship between overall cognitive impairment and functional decline was observed in SD. The CDR is arguably less sensitive to focal language disturbances characteristic of SD, prompting the development of the CDR-FTLD, which incorporates language and behavior subscales to improve its sensitivity to FTLD syndromes (Mioshi, Flanagan, & Knopman, Reference Mioshi, Flanagan and Knopman2017).
We, therefore, recommend future FTD studies explore the relationship between the ACE-III and CDR-FLTD and recognize that this is a limitation of our study. Alternately, given the relatively slow progression of SD, functional decline may emerge at a much slower pace relative to other neurodegenerative conditions (Mioshi, Hsieh, Savage, Hornberger, & Hodges, Reference Mioshi, Hsieh, Savage, Hornberger and Hodges2010; O’Connor et al., Reference O’Connor, Clemson, Hornberger, Leyton, Hodges, Piguet and Mioshi2016). For example, SD patients may show marked cognitive impairment yet continue to engage meaningfully in hobbies and many activities of daily living (Graham, Lambon, & Hodges, Reference Graham, Lambon and Hodges1997; Hodges et al., Reference Hodges, Bozeat, Ralph, Patterson and Spatt2000). In this regard, we emphasize the importance of taking into account the intricacies of each dementia subtype when estimating the relative functional impairment, and we caution that cognitive deficits do not necessarily map consistently onto functional outcomes across dementia syndromes. In that respect, future studies examining the type and sequence of functional changes (e.g., instrumental vs. basic functional abilities) and their relations to cognitive deficits will be valuable in improving our understanding of disease progression in dementia syndromes.
In summary, this body of work demonstrates that the ACE-III is a valid and reliable cognitive screening test for the detection of dementia, that it is an acceptable alternative to the ACE-R, and that ACE-III performance relates to functional ability in most common dementia syndromes.
ACKNOWLEDGMENTS
We thank all the participants for their time and contribution to this study. We also thank Nathan Bradshaw, Angela Scharfenberg, Lucienne Barhon, and Mirelle D’Mello for their help in test administration and scoring. Financial Support:This work was supported in part by funding to ForeFront, a collaborative research group dedicated to the study of frontotemporal dementia and motor neuron disease, from the National Health and Medical Research Council of Australia (NHMRC) (APP1037746) and the Australia Research Council (ARC) Centre of Excellence in Cognition and its Disorders Memory Program (CE11000102). In addition, FK is supported by an NHMRC-ARC Dementia Research Development Fellowship (APP1097026); SH is supported by an NHMRC-ARC Dementia Research Development Fellowship (APP1110183); JRB is supported by an NHMRC Early Career Fellowship (#1072451); MI is supported by an ARC Future Fellowship (FT160100096); OP is supported by an NHMRC Senior Research Fellowship (APP1103258). The authors certify that no actual or potential conflict of interest in relation to this study exists. Authors MS and DF contributed equally to the work.
Supplementary material
To view supplementary material for this article, please visit https://doi.org/10.1017/S1355617718000541


