Introduction
The surveillance epidemiology and end result (SEER) cancer registry data have been extensively used to model prognostic models for adenoid cystic carcinoma.Reference Ellington, Goodman and Kono1–Reference Bhattacharyya and Fried3 Adenoid cystic carcinomas are a heterogeneous group of carcinomas, mostly occurring in salivary gland tumours,Reference Lloyd, Yu, Wilson and Decker4–Reference Boukheris, Curtis, Land and Dores7 but it could occur in a large variety of anatomic sites.Reference Ghabach, Anderson and Curtis2, Reference Shindo, Aoki and Ikeda8 SEER data are a particularly important source for identifying disparity in treatment. The cause-specific survival rates for adenoid cystic carcinoma are about 75–80%Reference Ellington, Goodman and Kono1, Reference Ghabach, Anderson and Curtis2, Reference Kakarala and Bhattacharyya5–Reference Li, Xu, Zhao, El-Naggar and Sturgis9 (this study). Thus, there is room for improvement. For the first time, this study used receiver operating characteristic curve (ROC) to analyse SEER adenoid cystic carcinoma outcome data. The aim of this study was to identify and optimise predictive adenoid cystic carcinoma models to aid treatment and patient selection. This study also examined socio-economic factors that were predictors of treatment outcome.
SEER (http://seer.cancer.gov/) is a public-use cancer registry of the United States. SEER is funded by National Cancer Institute and Center for Disease Control. It covers 28% of all oncology cases in the United States. SEER started collecting data in 1973 for seven states and cosmopolitan registries. Its main purpose is, through collecting and distributing data on cancer, to strive to decrease the burden of cancer. SEER data are used widely as a benchmark data source for studying cancer outcomes in the United States and in other countries.Reference Perez, Kassira and Cheung10–Reference Sultan, Qaddoumi, Yaser, Rodriguez-Galindo and Ferrari16 The extensive ground coverage by the SEER data is ideal for identifying the disparity in oncology outcome and treatment in different geographical and cultural areas for cancers.Reference Polednak17 In addition to the biological staging factors and the treatment factors, this database also contains a large number of county-level socio-economic factor data. This study aimed to identify barriers to good treatment outcome that may be discernable from a national database.
Materials and methods
SEER registry has massive amount of data available for analysis; however, manipulating this data pipeline could be challenging. SEER Clinical Outcome Prediction Expert (SCOPE)Reference Cheung18 was used to mine SEER data and construct accurate and efficient prediction models.Reference Cheung, Altschuler and D'Amico19, Reference Cheung, Altschuler and D'Amico20 The data were obtained from SEER 18 database. SEER is a public-use database that can be used for analysis with no internal review board approval needed. The SEER website www.seer.gov has detailed information and data of SEER databases. SEER*Stat (http://seer.cancer.gov/seerstat/) was used for listing the cases. The filter used was: Site and Morphology.ICD-O-3 Hist/behav, malignant =‘8200/3: Adenoid cystic carcinoma’. This study explored a long list of socio-economic, staging and treatment factors that were available in the SEER database. The outcome used was ‘SEER cause-specific death classification’.
The codes of SCOPE are posted on Matlab Central (www.mathworks.com). SCOPE has a number of utility programmes that are adapted to handle the large SEER data pipeline. All statistics and programming were performed in Matlab (www.mathworks.com). Each risk factor was fitted by a generalised linear model to predict the outcome (cause of death: brain and other nervous system as coded in SEER). The areas under the ROC were computed. Similar strata were fused to make more efficient models if the ROC performance did not degrade.Reference Cheung, Altschuler and D'Amico19, Reference Cheung, Altschuler and D'Amico20 In addition, it also implemented binary fusion and optimisation to streamline the risk stratification by combining risk strata when possible. SCOPE uses Monte Carlo sampling with replacement to estimate the modelling errors and allows t-testing of the areas under the ROC. SCOPE provides SEER-adapted programmes for user-friendly exploratory studies, univariate recoding and parsing.
Results
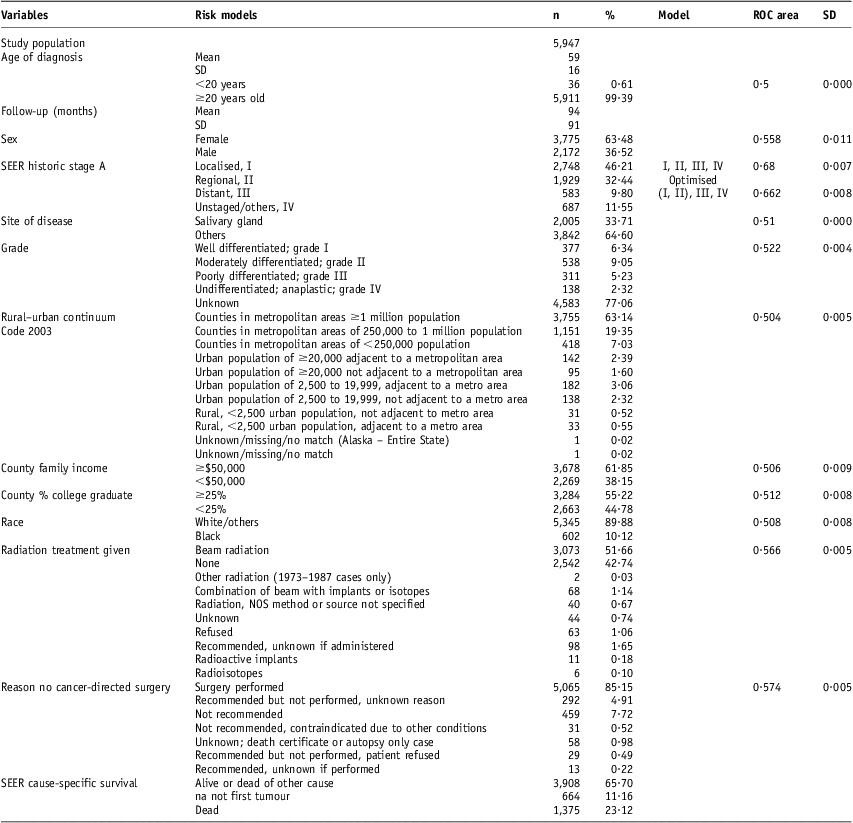
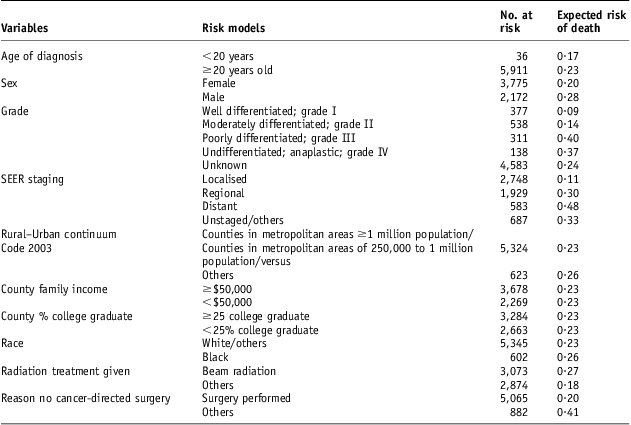
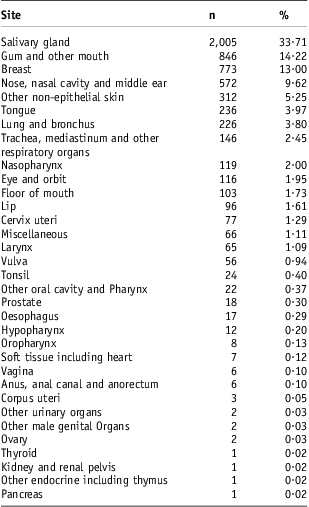
There were 5,937 patients included in this study (Table 1). The follow-up (SD) was 93·8 (90·6) months. Of the patients, 64% were women. The mean (SD) age was 58·55 (16·01) years. Patients younger than 20 years old had 16·7% risk for cause-specific death compared with 22·3% for older patients (Table 2). Complete staging was done nearly for all these patients. There is a significant female to male difference in the risk for cause-specific death (Table 2). Gender has a ROC (SD) of 0·56 (0·011). Radiation treatment has a ROC (SD) of 0·566 (0·005). Surgical resection has a ROC (SD) 0·574 (0·005). There were 66% ungraded adenoid cystic carcinoma cases (Table 1). Histological grade has a ROC (SD) of 0·52 (0·004) (Table 1). Unknown grade has a 24% risk for cause-specific death compared with 9% for grade I, 14% for grade II, 40% for grade III and 37 for grade IV (Figure 2). With respect to the socio-economic factors, African American patients had 26% risk for death compared with 23% for non-African Americans. Urban patients had a 23% risk for death compared with a 26% risk for rural patients (Table 2). However, these differences were not significantly associated with high ROC areas (Table 1). County-level family income and county education attainment were found not to be predictors of poor outcome (Tables 1 and 2). A third of the patients had salivary gland adenoid cystic carcinoma. But they could also occur in many other anatomic sites (Table 3). The distribution of other sites included: gum and other mouth sites 14·2%, breast 13%, nose, nasal cavity and middle ear 9·6%, other non-epithelial skin 5·3%, tongue 4%, lung and bronchus 3·8%, trachea, mediastinum and other respiratory organs 2·5% and nasopharynx 2%.
Table 1 The risk models include the socio-demographic, tumour and treatment factors for adenoid cystic carcinoma

Abbreviations: ROC, receiver operating characteristic curve; SD, standard deviation; SEER, surveillance, epidemiology and end results.
Table 2 Risk of SEER cause-specific mortality (%) associated with different models
Abbreviation: SEER, surveillance, epidemiology and end results.
Table 3 The distribution of adenoid cystic carcinoma by anatomical sites
A four-tiered staging model (with a ROC area 0·68) was optimised to a three-tiered model (with a ROC area of 0·66) by SCOPE (Figure 1). ROC areas were used to optimise the risk models. For example, the SEER staging could be slimmed down to three-tiered risk model, while not maintaining the strong ROC prediction performance (Table 1). There was only 50% use of RT (Table 1). There were about 60% adult patients younger than 40 years old received RT compared with 40% older patients received RT (Figure 3). There was a decreasing rate of RT use with increasing age (Figure 3).
Figure 1 Interactive graphical interface of SCOPE. The ROC areas of SEER Stage of adenoid cystic carcinomas were calculated without (upper right-hand side panels) and with (the corresponding lower panels) optimisation. Abbreviations: SCOPE, SEER Clinical Outcome Prediction Expert; ROC, receiver operating characteristic curve; SEER, surveillance, epidemiology and end results.
Discussion
This study is interested in constructing models that will aid patient and treatment selection for adenoid cystic carcinoma cancer patients. To that end, this study examined the ROC modelsReference Hanley and McNeil21 of a long list of potential explanatory factors (Table 1). ROC models take into account both sensitivity and specificity of the prediction. Ideal model would have a ROC area of 1, and a random model is expected to have a ROC area of 0·5.Reference Hanley and McNeil21 For example, a clinical ROC model can be used to predict whether a patient receiving the recommended treatment will die from the disease.
SEER staging model (localised, regional, metastatic and unstaged/others) has a ROC of 0·68 that is the highest among all the factors tested. For this study, these stages were risk-labelled as level I, II, III and IV. The unstaged/other patients had outcome better than those with metastatic models (Table 2). However, for this study, it is assigned level IV as there was no a priori reason to assume that unstaged patients had good outcomes. SCOPE optimised the four-tiered risk model to a three-tiered risk model (I and II), III and IV. In this case, the reported ROC area is marginally lower than the original risk. However, on the basis of tested variables of other sites (data not shown), SCOPE in general simplifies the model without sacrificing the ROC area. Second, a Monte Carlo simulation estimated the ROC areas. The estimates are expected to have random fluctuations.
When there are competing prediction or prognostic models, the most efficient (i.e., the simplest) model is thought to prevail.Reference D'Amico, Desjardin and Chung22 This has an information theoretic underpinning. For practical purposes, simpler models require fewer patients for randomised trials because fewer risk strata need to be balanced. In the clinic, simpler models are easier to use. SCOPE streamlined ROC models by binary fusion (Table 1). Two adjacent strata were tested iteratively to determine whether they could be combined without sacrificing the higher predictive power, usually belonging to the more complex models. This study has shown that SCOPE can build efficient and accurate prediction models.
For radiotherapy, the ROC area of 0·57 was modestly more than 0·5. For a point of reference, using we computed the prostate risk model was 0·75 in its accuracy of predicting biochemical failure.Reference Cheung, Altschuler and D'Amico19, Reference Cheung, Altschuler and D'Amico20 Low ROC areas imply that the information content (i.e., the staging accuracy) of the models may be limited. Another variable Grade (Tables 1 and 2) may be a potential source for improvement. When divided into grade I/I versus grade III/IV, grading model separated patients with a low risk for cause-specific death from the high-risk ones (Table 2). However, the ROC areas were lower than expected. This was probably owing to the fact that more than 70% tumours were not graded. It is consistent with the fact that most patients did not have complete grading or staging (Table 2). This is an area of improvement. It may be a consequence of having a better guidance model in treatment and patient selection.
Adenoid cystic carcinoma is a heterogeneous (Table 3) and aggressive disease. There was a 23% risk for adenoid cystic carcinoma death (Table 1) despite treatments. There was only 50% use of RT (Table 1) even when the indication for RT was clear as for the localised and regional adenoid cystic carcinoma (Figure 2). Furthermore, more adult patients than paediatric patients did not get RT (Figure 3) and therefore did not get the benefit of RT. Thus, radiation oncologists should be more attentive in recommending RT for these patients. For the paediatric populations, proton use is expected to improve the outcome of these patients by primarily decreasing the rate of secondary cancers.Reference Kuhlthau, Pulsifer and Yeap23–Reference Miralbell, Lomax, Cella and Schneider26 Among the socio-economic factors, race/ethnicity and urban rural residence status were associated with an increase in cause-specific death (Table 2) but were not significantly associated with high ROC areas (Table 1). This may be associated with relatively small numbers of the higher risk groups (African American patients and rural residents), but this may be further investigated.
Figure 2 The outcome of adenoid cystic carcinoma patients by SEER stage. Abbreviations: SEER, surveillance, epidemiology and end results; RT, radiotherapy.
Figure 3 Fraction of patients received radiotherapy as a function of age of diagnosis.
In conclusion, this study has identified that the staging models are the most prognostic factors of treatment outcomes of adenoid cystic cancer patients. The relatively high understaging rates may have prevented patients from selecting definitive local therapy. The poor rates of radiotherapy after surgery may have contributed to the poor outcomes in these patients with this aggressive disease. Improving the completing rate of grading is another way to improve the modelling. This study did not identify any socio-economic disparity in the outcome of this disease.
Conflicts of Interest
None.