


INTRODUCTION
Modern radiation therapy has advanced considerably in recent decades through the development of conformal techniques that better shape the therapeutic dose to tumour volumes while minimising the dose to surrounding normal tissues.Reference Schreiner1 Advanced treatment techniques such as intensity-modulated radiation therapy (IMRT) and volumetric modulated arc therapy require dosimetric verification before treatment because of the complexity of the delivery beams. Since the introduction of the IMRT, various dosimeters, such as film, semiconductor detectors and ion chambers,Reference Pallotta, Marrazzo and Bucciolini2 have been used extensively for pre-treatment quality assurance (QA).Reference Chandraraj, Stathakis and Manickam3, Reference Simon, Kozelka and Simon4 The purpose of IMRT pre-treatment verification is to verify the accuracy of the dose delivered to the patient. The traditional method of performing QA is by utilising films, flat panel detectors positioned in phantoms at select depths and delivering the treatment beams from a single gantry angle or from the actual treatment plans.
Diode or ionisation chamber-based 2D array of detectors such as MapCHECK (Sun Nuclear, Melboume, FL, USA),Reference Létourneau, Gulam and Yan5–Reference Herzen, Todorovic and Cremers8 MatriXX (IBA Dosimetry, GmbH, Schwarzenbrook, Germany)Reference Li, Yan and Liu9–Reference Alashrah, Kandaiya and Yong11 and 729 (PTW, Freiburg, Germany)Reference Chandraraj, Stathakis and Manickam3, Reference Van Esch, Clermont and Devillers12–Reference Mezzenga, Cagni and Botti19 are routinely used for IMRT QA. These devices should have linear response, reproducibility and energy independence.Reference Syamkumar, Padmanabhan and Sukumar20, Reference Stathakis, Myers and Esquivel21 Various research teams have studied radiation therapy delivery and pre-treatment verification by means of 2D arrays. Letourneau and Jursinic worked on MapCHECK,Reference Létourneau, Gulam and Yan5–Reference Jursinic and Nelms7 and Li et al., Wagner and Alashrah et al. studied on MatriXX.Reference Li, Yan and Liu9–Reference Alashrah, Kandaiya and Yong11 In addition, Van Esch et al., Stathakis, Poppe, McGarry and Anvari evaluated PTW 2D arrays.Reference Van Esch, Clermont and Devillers12, Reference Van Esch, Basta and Evrard15, Reference Anvari, Aghamiri and Mahdavi16, Reference Stathakis, Myers and Esquivel21–Reference Myers, Stathakis and Buckey24 Most of the studies were performed with only a 6 MV photon beam. The major drawback of solid-state detectors, such as temperature and energy dependence, and the well-known behaviour of ionisation chambers, such as their accuracy and stability, favour ion chamber arrays as standard devices for QA measurements in IMRT.Reference Syamkumar, Padmanabhan and Sukumar20
In this work, the performance of PTW Octavius detector 729 was evaluated for low and high photon energies from Siemens Primus and Varian Clinac linear accelerators throughout the detector plane. Detector performance evaluation included sensitivity, reproducibility and linearity of detector response, as well as field size dependence, dose rate and source-to-surface distance (SSD) dependence. For reference measurements, a PTW ionisation chamber of 0·6 cm3 (FC65-G) in a water tank was used.
MATERIAL AND METHODS
Octavius detector 729
The PTW Octavius detector 729 was used in this work. It consists of a 27×27 cm matrix of 729 air-vented cubic plane parallel ionisation chambers. The ion chambers are 0·5×0·5×0·5 cm in size, and the centre-to-centre spacing is 1·0 cm. The sensitive volume of each single ionisation chamber is 0·125 cm3. The array is 2·2-cm thick, including the surrounding material of polymethylmethacrylate, and weighs 3·2 kg. Current integration time is between 400 and 1,000 ms with a voltage of 400 V applied for complete charge separation. The number of measurement points can be increased to 2,916 by shifting the array three times with movements of 0·5 cm to decrease the gaps between chambers covering the radiation field. Thus, if higher resolution is desired, the radiation beam can be delivered multiple times with various shifts of the array and then merged using VeriSoft software.
According to the PTW technical manual, the Octavius detector should be placed between at least 3-cm back scattering material and 5 cm of build-up material. The arrangement of the ionisation chambers allows performing the following tasks: measuring planar dose distributions, measuring profiles in the gun-target, left-right and diagonal directions, checking the congruence of light and radiation fields and leaf position accuracy. The chamber’s warm-up time is around 15 minutes with the initial calibration performed by the manufacturer and recommended re-calibration every 2 years. The system is able to measure the absorbed dose and dose rate.
Data analysis
Data analysis and comparison of the Octavius detector with reference ion chamber data were performed using PTW VeriSoft software, version 5.1. All data were also analysed using an in-house code developed using Matlab (MATLAB 7; Math Works Inc., Natick, MA, USA). Matrices in the central region of the detector and eight peripheral regions were investigated. In order to do this, nine 5×5 cm2 matrices were selected as regions of interest, as shown in Figure 1. This array size was chosen to minimise statistical fluctuation in pixel response. Statistical analysis was performed with SPSS version 14.0 software (SPSS, Chicago, IL, USA). The level of statistical significance was adjusted for p-values less than 0·05.

Figure 1 Position of the nine regions of interests (ROIs) selected on the 2D array plate for more investigation.
Linear accelerators
Measurements were performed using a Siemens Primus linear accelerator (Siemens Medical Solutions, Erlangen, Germany) with 6 and 15 MV photon energies, as well as with a Varian Clinac 2100 (Varian Medical Systems, Palo Alto, CA, USA) at 6 and 18 MV photon beams. Linear accelerator (linac) output constancy has always been an important part of a regular QA programme. Linacs outputs were calibrated following the IAEA TRS-398 protocolReference Andreo, Burns and Hohlfeld25 and checked daily and monthly using a daily check device and ion chamber measurements in a water tank, respectively.
Sensitivity
The sensitivity of the ion chambers of the detector was tested at 6 and 15 MV photon energies by shifting the detector in subsequent exposures, placing different chambers in the central axis and irradiating the detector in a 10×10 cm2 field with 100 MU at SSD of 95 cm.
Reproducibility and stability
Short-term and long-term reproducibility of the detector was evaluated by repeating consecutive measurements every 10 minutes over a 1-hour period and every week over a 1-month period using the same setup. Measurements were recorded between April and November 2013, with checking more than 30 times by delivering 100 MU for 6 MV at a fixed field size of 10×10 cm2.
Linearity
The linearity of the detector response was assessed by irradiating 6 and 15 MV photon beams from 5 to 500 MU for a field size of 10×10 cm2 at 95 cm SSD.
Field size dependence
The response of the Octavius detector 729 for linear accelerator radiation field size dependence was evaluated by delivering 100 MU for field sizes ranging from 2×2 to 27×27 cm2 for 6 and 15 MV photon beams.
Dose rates
Dose rate dependency of detector 729 was studied by irradiating the detector with 6 and 18 MV photon beams at a fixed field size of 10×10 cm2 and 100 MU for a range of dose rates from 100 to 600 MU/minute.
SSD
The SSD dependency was studied with measurements in different SSDs (75–125 cm), every 10 cm, for 6 and 15 MV photon beams and 100 MU at 10×10 cm2 field size.
RESULTS
Sensitivity, reproducibility and stability
The dose measurement of any ion chamber (10 samples in various directions) that was shifted and placed in a 2D array isocentre showed the same signal with a maximum deviation of ~0·1%. The reproducibility and stability of the measurements are excellent, and the maximum standard deviation is <0·5%.
Linearity
Dose response of the Octavius detector was linear in 5–500 MUs for both 6 and 15 MV photon energies with a maximum variation of 0·01% (Figure 2). The regression analysis for 6 MV data of the detector 729 was assessed by SPSS software, and the linear equation is shown. The detector exhibits excellent linearity with monitor units (MU) as shown in Figure 2. A linear function was fit to the data using the following equation:
 $$y=0\!\cdot\!0{\rm 1}x-0 \!\cdot\! 00{\rm 5}$$
A linear regression fit shows that the linear relationship between the MU and the detector response is good, down to the lowest delivered dose, with a regression coefficient of 1 and an offset of −0·005.
Figure 2 Linearity test for the Octavius detector 729 for 6 and 15 MV photons and 0·6 cc reference ion chamber in the water phantom for 6 MV photon beams. The solid line represents the linear regression fit for 6 MV data of the detector 729.
The response of the detector to increase in MUs in the array was investigated. The regions shown in Figure 1 have been investigated to evaluate the increase in MUs within and outside the irradiation field. As seen in Figure 3, there is a linear relationship between MUs and the detector signal in all regions. The slopes of the lines are similar, except for the right and left central ones where the slopes are smaller. The four regions in the periphery of the field have lower overall signal, which is because of an inverse square drop-off of the dose.
Figure 3 Linearity test for the central point and for eight peripheral points was acquired for 6 MV.
Field-size dependence
Field size dependence measurement results are plotted in Figure 4. The field size dependence estimated using the array detector was found to be in close agreement with the 0·6 cm3 ionisation chamber data. As seen in Figure 4, with increasing field size the array signal increases, which can be modelled with the following equation:
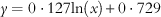 $$y=0 \cdot {\rm 127 ln(}x{\rm )}{\plus}0 \cdot {\rm 729}$$
The logarithmic regression using SPSS yielded a coefficient of determination (R 2) of 0·997. Statistical analysis showed good correlations between the fitted curves and measured values for detector 729.
Figure 4 Field size dependence results of the detector 729 for 6 and 15 MV photons, as well as 0·6 cc reference ion chamber measurements for 6 MV photons. The logarithmic regression of 6 MV-729 data is also shown (solid line).
To further investigate the field size dependence of the array, this correlation was evaluated in each of the nine regions. As seen in Figure 5, the signal increases logarithmically in agreement with Equation (2).
Figure 5 Field size dependence results for detector 729 in the central point and eight peripheral points for a 6 MV photon beam, 100 MU at 10×10 cm2 field size.
Dose rates
The response of the detector was found to be independent of dose rate between 100 and 600 MU/minute for both 6 and 18 MV photons (Figure 6). The observed results were in close agreement with the ion chamber measurements.
Figure 6 Dose rate dependency of detector 729 response for 6 and 18 MV photons and 0·6 cc reference ion chamber in the water phantom for 6 MV photon beams.
SSD
The responses of the detectors as a function of SSD for 6 and 15 MV photon beams are shown in Figure 7. Measurements were recorded for SSDs of 75, 85, 95, 105, 115 and 125 cm. The results were compared with a 0·6 cc ion chamber for 6 MV in the same measurement setup. The detector agrees with the ionisation chamber measurement within 0·01% for the range of SSDs performed in this study. With increasing SSD, reading dose value by the detector decreases; a binomial model providing a better fit to the response of the Octavius detector 729 to SSD changes was found to be as follows:
 $$y=0.00{\rm 1}x^{{\rm 2}} -0.0{\rm 71}x{\plus}{\rm 5}.{\rm 454}$$
The correlation coefficient in the binomial regression was 0·998.
Figure 7 Source-to-surface distance (SSD) dependency of the Octavius detector 729 for 6 and 15 MV photons and 0·6 cc reference ion chamber in the water phantom for 6 MV photon beams. Also shown is the binomial regression model (solid curve).
The SSD dependence of the detector in regions within and outside the irradiated field was evaluated using Matlab. As seen in Figure 8, detector response increases in peripheral regions because of increased scatter to these regions.
Figure 8 Source-to-surface distance (SSD) dependency of the detector 729 in the central point and eight peripheral points for a 6 MV photon beam, 100 MU at 10×10 cm2 field size.
DISCUSSION
The purpose of this study was to extensively evaluate a detector array as a common QA tool and a pre-treatment plan verification in radiotherapy. We evaluated dosimetric properties of PTW Octavius detector 729 by using low- and high-energy beams in and out of the irradiation field. The evaluations included sensitivity, reproducibility and linearity of the detector response, as well as field size dependence, dose rate and SSD dependence in low and high photon energies. The performance of detector 729 was also compared with the PTW 0·6 cm3 ion chamber in a water tank.
The results showed that both short-term and long-term reproducibility and stability of 2D array response are <0·5%. They were found to be consistent with data reported for 2D ion chamber array in the literature. Spezi reported that short-term reproducibility was well within 0·2% and long-term reproducibility was within 1%.Reference Spezi, Angelini and Romani13 Syamkumar et al.Reference Syamkumar, Padmanabhan and Sukumar20 also reported values within ±1% over a period of 5 months. The comparison with ion chamber data carried out in a water tank was very satisfying; the detector showed the same signal with a maximum deviation of ~0·1%. The detector linearity to dose was also assessed by irradiating 2–500 MU of 6 and 15 MV photon beams. The dose response of the 2D array is very linear with a regression coefficient of 1 and an offset of −0·005. Field size dependence measurements of the array showed no considerable deviation from the reference ion chamber data for 2×2 to 27×27 cm2. Logarithmic regression y=0·127 ln(x)+0·729 for detector signal and field—size changes yielded a coefficient of determination of 0·997. It can be considered a very good achievement, as it is not a trivial matter to obtain a good output factor response for small radiation fields when using matrices of detectors.Reference Spezi, Angelini and Romani13 The deviation of measurement for SSD of 75 to 125 cm was within 0·1% for 6 and 15 MV beams. The detector response for SSD changes of 6 MV photon beam modelled by a binomial equation with a coefficient of determination of 0·998 agrees with the ionisation chamber measurement within 0·01% for the range of SSDs performed in this study. In the regions outside the irradiated field, detector response increases with increasing SSD due to increased scattering. On the basis of the results of the dosimetric analysis, it can be concluded that the Octavius detector 729 is a reliable and accurate dosimeter for QA and pre-treatment plan verification.
CONCLUSION
Dosimetric properties of the PTW Octavius detector 729 have been characterised. Measurement and evaluation results indicate that linac QA and even the pre-treatment plan verification process using detector 729 and VeriSoft software is very fast, reliable and precise. The spatial resolution of it is sufficiently high to obtain suitable results. The Octavius detector 729 has been shown to be efficient for linac QA and pre-treatment plan verification.
Acknowledgements
The reliable and friendly cooperation of Dr Omid Khademnoe for his valuable assistance is gratefully appreciated. The authors thank Mr. Majid Sharaf from PTW Freiburg for many useful discussions, and Pars RT centre for aiding in data collection.
Conflict of Interest
There is no conflict of interest including any financial, personal or other relationships with other people or organisations for this work.

