Introduction
Pretreatment verification is a major concern in complex radiation therapy treatment plans such as intensity-modulated radiation therapy (IMRT). Modern cancer treatments using radiation therapy are mostly used with multileaf optimised plans as in IMRT. As a result, the total dose delivered to the tumour in IMRT has been escalated to achieve a better tumour control and minimum dose to organs at risk (OAR). The highly modulated radiation dose distribution creates a higher risk of unexpected irradiation of OAR with target overdose/underdose. Research performed by Huq et al. and Budgell G. J. et al. in 2004 suggested that improvements be made in the efficiency of verification methods.Reference Huq, Fraass and Dunscombe 1 – Reference Oldham, Sakhalkar, Guo and Adamovics 7
In 2011, international specialty products (ISP) released a new robust film generation, the Gafchromic EBT3 (International Specialty Products, ISP, Wayne, NJ, USA) film. The most modern Gafchromic EBT3 film is similar in construction to its ancestor EBT2 film, with additional features of a symmetric construction, insensitivity to visible light and anti-Newton ring artefact coatings. The most important EBT3 characteristics have been investigated, such as response at high-dose levels, sensitivity to scanner orientation and post-irradiation colouration and energy independence.Reference Iqbal, Iqbal, Akram, Altaf and Buzdar 8 – Reference Iqbal, Gifford, Ibbott, Grant and Buzdar 13
Electronic portal imaging device (EPID) was originally implemented for patient position verification, but their use had been later extended to obtain dosimetric information for pretreatment field verification. High contrast, large detector density, large detecting surfaces, linear response to radiation dose and efficient online capabilities make EPIDs attractive candidates for IMRT quality assurance.Reference van Elmpt, McDermott, Nijsten, Wendling, Lambin and Mijnheer 14 – Reference Howell, Smith and Jarrio 21
The researchers Jursinic et al. and Letourneau et al. examined the linearity and temperature characteristics of the diode-based MapCHECK®2 detectors and found that the diode response is linear with the radiation dose delivered.Reference Jursinic and Nelms 22 Buonamici et al.Reference Buonamici, Compagnucci, Marrazzo, Russo and Bucciolini 23 compared the MapCHECK®2 and film measurement for IMRT QA. The MapCHECK®2 system provides accurate information about the dose distribution and is being used at many cancer centres for evaluation.Reference Liu, Wang, Kumaraswamy, Nazareth, Podgorsak and Malhotra 24
In this work, three dosimeter systems were compared for their use in the quality assurance of patient-specific IMRT treatment plans: The Gafchromic EBT3 film, EPIDs and MapCHECK®2 diode-based array (Model 1175, Sun Nuclear Corporation, Melbourne, FL, USA). The MapCHECK®2 is straightforward, highly sensitive, light weight with miniature size and is a less time-consuming tool. A practical advantage of EPID is its availability and simplicity of use. Neither phantom nor additional connection of devices is necessary. These considered dosimeters are examined at both 6 and 15 MV energies for brain and prostate patients.
Finally, in this study, we have compared the measured doses from EBT3 Film, EPID and MapCHECK®2 with treatment planning system (TPS)-calculated dose to assess their suitability and the potential role they can play in patient-specific IMRT quality assurance procedures.
Material and Methods
Gafchromic EBT3 film dosimeter
The Gafchromic EBT3 film from lot no. A10171102 with a sheet dimension of 20·3×25·4 cm2 was used in this project. The film was handled according to the procedures described in the AAPM-TG-55 report. The film comprises an active substrate layer of 27-micron thickness embedded between two transparent polyester substrates of 120 microns thickness. The active layer consists of the active component, marker dye, stabilisers and other additives, which provide low-energy dependence. The yellow marker dye decreases UV or light sensitivity; when it is used in junction with a red, green and blue (RGB) film scanner, it enables all the benefits of multichannel dosimetry. The polyester substrate has a special surface treatment containing microscopic silica particles that maintain the gap between the film surface and the glass window in a flatbed scanner. As the gap is nearly 10 times the wavelength of visible light, the formation of Newton’s rings interference patterns in images acquired by using flatbed scanner is prevented.Reference Budgell, Perrin, Mott, Fairfoul and Mackay 3 – Reference Fuss, Sturtewagen, De Wagter and Georg 6
The amorphous silicon (aSi)-based EPID detector
One of the advanced pretreatment QA tools for IMRT plan verification is the EPID. It provides two-dimensional (2D) dose verification against that predicted by a TPS. The EPID verifies the plan by checking the Agreement evaluation of predicted and measured 2D dose. The LINAC used in this study is Varian Clinac® DHX (Varian Medical System, Palo Alto, CA, USA) equipped with EPID, which consists of aSi detector technology; the aSi active detector area is 30×40 cm2, resolution is 512×384 pixels (0·78 mm) and maximum image resolution is 1024×768 (0·39 mm), as shown in Figure 1. It is an Exact Arm portal imager with two single robotic arms and driven motors. Its positioning accuracy is ±1 mm. Eclipse ARIA 11 (Varian Medical System) TPS is capable of portal dose prediction. The dose image acquisition is performed using the image acquisition system (IAS). Dose image is acquired by 4DTC (4D treatment console), and all data are stored in Varian Medical System database. This system includes the following components: (1) image detection unit (IDU), which features the aSi detector and accessory electronics; (2) IAS containing acquisition electronics for the IDU and interfacing hardware; and (3) a Portal Vision workstation. Within the detector, a scintillator converts the incoming X-rays into visible photons. The light is sensed by a photodiode array attached to the amorphous silicon panel. The photodiodes integrate the incoming light into charge captures, and the detector electronics transfer the charges from pixels to read-out electronics. The number of rows read between two pulses is controlled by the NRP parameter, which can be chosen by the user.Reference van Elmpt, McDermott, Nijsten, Wendling, Lambin and Mijnheer 14 , Reference Pasma, Dirkx, Kroonwijk, Visser and Heijmen 25 – Reference Nelms, Rasmussen and Tome 31

Figure 1 Electronic portal imaging device.
The diode-based MapCHECK®2 detector
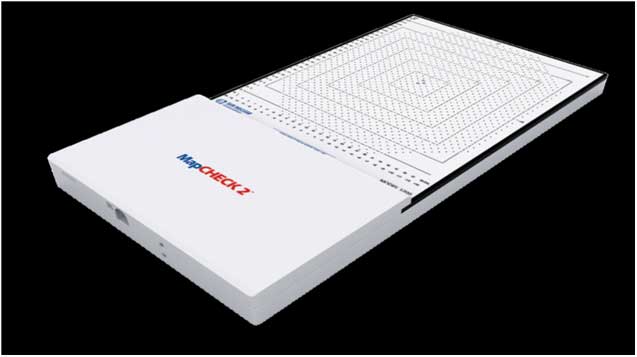
The 2D diode-based detector, the MapCHECK®2, consists of 1,527 SunPoint Diodes, including PC software interfaces with TPS to import the calculated dose file for comparison with the measured dose file. It has a field size of 32·0×26·0 cm2 with uniform detector spacing of 7·07 mm. The MapCHECK®2 used in this study also contains the following specifications—active detector area: 0·64 mm2, active detector volume: 0·019 mm3, detector sensitivity: 32 nC/Gy, sampling frequency: 50 ms, dimensions: 28·7×56·0×4·3 cm3 and weight: 7·1 kg, as shown in Figure 2. The MapPHAN, water equivalent phantom, securely holds the MapCHECK®2 arrays at measurement plane depth of 5 cm and backscatter depth of 5 cm. MapCHECK® 2 is provided with SNC Patient™ Software, which compares the measured dose with the planned dose. Users can compare relative or absolute dose data by using distance-to-agreement or gamma analysis with this software.Reference Létourneau, Gulam, Yan, Oldham and Wong 32

Figure 2 MapCHECK®2 (Sun Nuclear Corporation, Melbourne, FL, USA).
Treatment delivery equipment and film scanner
A dual-energy DHX-S Linac (Varian Medical Systems) equipped with a millennium 120-leaf multileaf collimator (MLC) was used to produce 6 and 15 MV photon beams to irradiate the EBT3 film. Dose rates of 300 MU/min were performed. The MLC has a leaf width of 5 mm at the central 20 cm and 10 mm at the outer 20 cm of the field. Varian specifies the leaf position end accuracy to be 1·0 mm and the end repeatability in millimetres at the isocentre to be 0·6 mm. The Epson Expression 10000 XL (Seiko Epson Corporation, Nagano, Japan) is a flatbed colour scanner that was used for scanning radiochromic EBT films. This scanner is equipped with its associated Epson scan V3.4 software and spatial resolution of 72 dpi corresponding to a pixel size of 0·35×0·35 mm2. It can scan opaque and transparent samples. The films were scanned under transmission mode according to the protocol described by Bouchard et al. The RGB-positive images were collected and saved in TIFF (tagged image file format) format. A white fluorescent Xenon lamp was used as a light source. The light detector is a charge-coupled device coated with three optical filters that split up the incident light spectrum into three specific measurable wavelength bands corresponding to fundamental primary colours red, green and blue. As a result, EBT3 film was scanned in 48-bits colour mode at 72 dpi resolutions without applying image processing features.Reference Ferreira, Lopes and Capela 33 , Reference Borca, Pasquino and Russo 34
Treatment planning and delivery
IMRT QA treatment plans for 20 patients (10 with brain and 10 with prostate disease) were selected in this study. Treatment plans were generated in Varian Eclipse 8.9 (Varian Medical Systems) TPS by using the anisotropic analytical algorithm (AAA). The films were exposed in a phantom composed of 30×30 cm2 sheets of solid phantom (PTW, Freiburg, Germany), which were used in acquiring dose profiles following the AAPM-TG 142 recommendations.Reference Klein, Hanley and Bayouth 35 The Epson Expression 10000 XL flatbed colour scanner was used for scanning radiochromic EBT3 film. The standard geometry used for measurement of conformal dose distributions was an isocentric geometry. All three dosimeters were irradiated to 6 and 15 MV photon beams at the same geometric setup by using a dual-energy Varian DHX-S Linac equipped with a millennium 120-leaf MLC. A γ test was implemented for dose comparisons.
The experimental conditions were fixed through the following parameters: source-to-detector distance (SSD)=100 cm, depth (d)=10 cm, field size (FS)=5×5, 10×10 and 15×15 cm2, region of interest (ROI) for 10×10 cm2 and dose rate=300 MU/min.
2D dose measurement by EBT3
The scanned image of the films was measured and analysed through Film QA Pro software by using triple-channel dosimetry to eliminate scanner artefacts. Film QA Pro software is a sophisticated tool designed to streamline the IMRT QA and allows one scan analysis. The film dosimetry protocol takes dose–response measurements from the exposed and unexposed calibration films, and applies those data to re-scale pre-determined and lot-specific calibration response data. The re-scaled calibration was then used to convert the application film image to a dose image. Comparison between measured and TPS dose was made through the Film QA Pro software by using gamma analysis.
2D dose measurement by EPID
The amorphous silicon-based EPID system attached to Varian Clinac® DHX is used, and its full active detection surface was irradiated by using both energies 6 and 15 MV for 20 brain and prostate patients’ IMRT plan. Figure 1 displays the EPID dose distributions given below. The EPID system has a scintillator that converts the incident radiations into visible light, which is detected by an array of photodiodes. Each pixel on the active matrix has a photosensitive element that generates an electrical charge whose magnitude is proportional to the light intensity emitted in the region close to the pixel. All signals are amplified in charge amplifiers and converted to the digital format, which is transmitted to the data acquisition unit. The EPID dose image acquisition is performed by IAS and all the data are stored in Varian Medical System database. The EPID images were calibrated with dark field and flood field. The PDIP algorithm in Eclipse created the comparison images for IMRT QA.
Dose measurement by MapCHECK®2
The MapCHECK® 2 diode array was also used for pretreatment QAs of the same IMRT plans. MapCHECK®2 has 1,527 n-type diode detectors covering 26×32 cm2 at 7·07 mm uniform spacing across the entire area. The dose was computed by using AAA algorithm. This detector was calibrated by a standard protocol using a 10×10 cm2 field instructed by the vendor. MapCHECK®2 is provided with SNC Patient™ Software, which compares the measured dose with the planned dose.Reference Greer 27
Results and Discussions
We have evaluated the dosimetric performance of three dosimetry systems for their use in the quality assurance of patient-specific IMRT pretreatment verifications. The Gafchromic EBT3-, amorphous silicon-based EPID- and diode-based MapCHECK®2-measured doses have been assessed by comparing them with TPS calculation dose, which is our standard tool. The comparison was made in terms of the agreement parameters, average and standard deviation values. A gamma test was implemented for dose evaluation.
Dosimetry analysis for brain patients
Evaluation for 6 MV energy
A total of 20 patients with brain diseases were included in this study with 6 and 15 MV energies. We have used gamma statistical analysis criteria by using 3%–2 mm, 3%–3 mm and 5%–3 mm in order to identify the agreement between measured dose distribution and calculated dose distribution in the validation of IMRT plans for EBT3, EPID and MapCHECK®2.
Dosimetric comparison of EBT3-, EPID- and MapCHECK®2-measured doses with TPS-calculated doses is summarised in terms of gamma passing rates as the percentage difference in Table 1. In the statistical analysis, numerical values in Table 1 represent average and standard deviation of pass rates. The average gamma passing rates for 6 MV are determined to be 97·3% (SD: 0·28), 98·4% (SD: 0·71) and 99·05% (SD: 0·49) for EBT3; 98% (SD: 0·14), 99% (SD: 0·71) and 99·4% (SD: 0·71) for EPID; and 95·35% (SD: 0·21), 97·05% (SD: 0·21) and 98·4% (SD: 1·13) for MapCHECK®2 using criteria 3%–2 mm, 3%–3 mm and 5%–3 mm, respectively. The γ passing rates of EPID were better than those of MapCHECK®2 and EBT3 for both energies and all criteria, as shown in Figure 3.

Figure 3 Graphical analysis for passing rates between EBT3, EPID and MapCHECK®2 with treatment planning system-calculated dose distributions for 6 MV brain intensity-modulated radiation therapy plans with Gamma criteria.
Table 1 Statistical analysis for passing rates between EBT3, EPID and MapCHECK®2 and treatment planning system-calculated dose distributions for 6 MV brain intensity-modulated radiation therapy plans with Gamma criteria

This subjected comparison is also described in Figure 3 graphically. The plot is made between passing rates along y-axis and patient number along x-axis. In this graph, EPID is superior as red colour in the agreement passing rates for all criteria.
Evaluation for 15 MV energy
The quantification of the comparison for 15 MV energy is described in Table 2. The EBT3, EPID and MapCHECK®2 recorded the average values as 95·9% (SD: 0·71), 97·05% (SD: 0·21) and 98·9% (SD: 0·28); 96·35% (SD: 0·64), 97·85% (SD: 0·49) and 99·2% (SD: 0·57); and 95·5% (SD: 0·99), 96·25% (SD: 0·07) and 98·35% (SD: 0·21) using criteria 3%–2 mm, 3%–3 mm and 5%–3 mm, respectively.
Table 2 Statistical analysis for passing rates between EBT3, EPID and MapCHECK®2 and treatment planning system-calculated dose distributions for 15 MV brain intensity-modulated radiation therapy plans with Gamma criteria

The following graphical representation (Figure 4) depicts the assessment for the dosimeters with 15 MV. The red line shows EPID quantification, which is higher than other ones, as shown in Figure 4.

Figure 4 Graphical analysis for passing rates between EBT3, EPID and MapCHECK®2 with treatment planning system-calculated dose distributions for 15 MV brain intensity-modulated radiation therapy plans with Gamma criteria.
Excellent passing rates were obtained for EPID dosimetry system when compared with the planar dose distributions from the TPS for both 6 and 15 MV energies. It is clear from the above Figure 4 interpretation that EPID shows excellent results for all gamma criteria in brain IMRT quality assurance.
Dosimetry analysis for prostrate patients
Evaluation for 6 MV energy
Ten patients with prostate diseases were included in this study with 6 and 15 MV energies by using gamma criteria at 3%–2 mm and 5%–3 mm. We quantified the agreement between three dosimetric verification methods to determine the best agreement pass rates for 6 MV prostate IMRT QA. In Table 3, the average pass rates are 94·8% (SD: 0·42) and 96·8% (SD: 0·42) for EBT3; 95·5% (SD: 0·49) and 97·25% (SD: 0·49) for EPID; and 94·3% (SD: 0·28) and 96·25% (SD: 0·64) for MapCHECK®2 using criteria 3%–3 mm and 5%–3 mm, respectively. Furthermore, this analysis has been interpreted graphically. Figure 5 clearly shows that EPID-measured results are in excellent agreement with TPS-calculated results.

Figure 5 Graphical analysis for passing rates between EBT3, EPID and MapCHECK®2 with treatment planning system-calculated dose distributions for 6 MV prostate intensity-modulated radiation therapy plans with Gamma criteria.
Table 3 Statistical analysis for passing rates between EBT3, EPID and MapCHECK®2 and treatment planning system-calculated dose distributions for 6 MV prostate intensity-modulated radiation therapy plans with Gamma criteria

Evaluation for 15 MV energy
A total of 10 patients with prostate diseases were included for 15 MV energy by using 3%–2 mm and 5%–3 mm criteria comparison. In Table 4, the results were determined to be 94·45% (SD: 0·49) and 96·05% (SD: 0·49) for EBT3; 95·15% (SD: 0·07) and 96·85% (SD: 0·49) for EPID; and 93·8% (SD: 0·42) and 95·55 (SD: 0·42) for MapCHECK®2 2 at 3%–2 mm and 5%–3 mm criteria, respectively. Graphically, the findings can be represented as shown inFigure 6. Figure 6 also clearly advocates the EPID detector in view of excellent gamma agreement with TPS standard comparatively.

Figure 6 Graphical analysis for passing rates between EBT3, EPID and MapCHECK®2 with treatment planning system-calculated dose distributions for 15 MV prostate intensity-modulated radiation therapy plans with Gamma criteria.
Table 4 Statistical analysis for passing rates between EBT3, EPID and MapCHECK®2 and treatment planning system-calculated dose distributions for 15 MV prostate intensity-modulated radiation therapy plans with Gamma criteria

Conclusions
Noticeable quantification in passing rates was obtained when the EPID-measured dose distributions were compared with the TPS-calculated dose distributions. Therefore, on the basis of our results obtained with EBT3-, EPID- and MapCHECK®2-measured dose and strong passing rate agreement with TPS-calculated dose, we conclude that the EPID dosimetry system has been successfully implemented and validated in the quality assurance of patient-specific IMRT pretreatment verifications for brain and prostate cases. Furthermore, the EPID dosimeter is an efficient and fast method for a routine verification of IMRT QA procedures.
Acknowledgements
The authors are very thankful to Clinical and Radiation Oncology Department, Shaukat Khanum Memorial Cancer Hospital & Research Center Lahore, Pakistan, for providing funds for the completion of this project.