


Introduction
A comprehensive analysing method has been required since long in the field of radiotherapy. The basic purpose of all techniques has been to deliver the prescribed dose safely to the target volume containing tumour and as well as to reduce dose to organs at risk (OARs). The detailed comparison between different treatment techniques is very difficult and inexplicit as well. The gradual improvement in imaging software has made easy to users to assess spatial arrangement of tumour, critical organs and isodose lines in the form of a single 3D representation that can be observed from all angles. Reference Ansari, Satpathy and Ahmad1 3D dose distribution has been represented in the form of dose–volume histograms that can be used to define the maximum, minimum, modal and mean dose delivered to each volume of interest as well as the dose delivered per unit volume of these structures. This dose distribution modelling is easy to interpret for tumour volume because it defines the isodose line that covers a given percentage of tumour volume. The modelling also indicates dose delivered to the critical organs delineated (particularly maximum dose, and dose delivered per unit or percentage of volume of critical organs) and allows comparison of these dose to theoretical dose considered to be the maximum tolerated dose. In spite of all such evaluation methods of radiotherapy plans, a numerical index was urgently needed which could give quantitative information to users at a glance. Finally, conformity index (CI) was introduced in 1993 by the Radiation Therapy Oncology Group (RTOG) described in Report 62 of the International Commission on Radiation Units and Measurements (ICRU) to assess the 3D dose conformation of target volume. Reference Huchet, Caudry and Belkacémi2,Reference Menzel3 The CI as alone is not able to provide gross dosimetric information about treatment plans because it is a single isodose line quantity. It neither covers the volume of hotspot nor gives information about spillage of dose distribution; so users often do not focus on the use of CI during plan analysis. Although its role has not yet been defined, most likely because the value of conformal radiotherapy is just beginning to be demonstrated in terms of prevention of adverse effects and tumour control. Reference Armstrong, Raben and Zelefsky4–Reference Lee, Hanks and Hanlon7 Despite the facts mentioned above, it is very difficult to determine the level of dose conformity to the targets. Analysis of each parameter relevant for the treatment (e.g., radiologic, radiobiologic geometric, clinical, dosimetric) is very complex and time-consuming. So, an additional tool is required for analysis of all these data. The ideal solution would, therefore, be a system that integrates all data and represents them in a simple and quantitative form, that is, providing a score expressing the relationship between irradiated tumour tissue and non-irradiated healthy tissues. Various treatment plans could then be compared on the basis of the scores attributed to each option. The CI with risk factor (RF) assessment could constitute this ideal tool.
There are two main tools such as CI and homogeneity index (HI) for analysis of treatment plans. Moreover, many formulae and definitions have been described by various authors and organisations, but none has been described as an ideal or near ideal for calculating the HI and CI. Reference Petrova, Smickovska and Lazarevska8 Moreover, CI and HI do not assess the risk of damage of normal organs around the tumour.
CI was introduced as an extension of section-by-section dosimetric analysis and dose volume histograms and could be defined as an absolute value resulting from the ratio between a fraction of tumour volume and the volume covered with reference isodose line.
Rather HI, the CI is a quantitative tool that helps the user in comparison and selection of the most appropriate treatment plan. It is used in conformal radiotherapy, stereotactic radiotherapy and brachy therapy, too.
Ansari et al. Reference Ansari, Satpathy and Ahmad1 has developed a new method Triple Point Conformity Scale (CS3 Scale) to evaluate the qualitative nature of radiotherapy plans. Of course, this is an advance tool for plan evaluation which covers both hotter and colder regions of a radiotherapy plan and provides good details about the plan regarding dose coverage to the targets. But, this tool does not give any data about the RF of OARs around the tumour. Hence, there is a need to develop a new advance method which could provide information on target’s dose coverage and simultaneously assess the risk of damage of OARs.
The conformal radiotherapy has designed in such a way that it could achieve the best adaptation of shape of desired isodose line envelope to the exact shape of the tumour. Reference Rosenwald, Gaboriaud and Pontvert9 Carrie et al. in 1995 reported that conformal radiotherapy could be the next major revolution in field of radiotherapy. Reference Carrie, Ginestet and Bey10 Carrie and Ginestet in 2001 concluded that the conformal radiotherapy has now become a standard radiotherapy modality at the dawn of the third millennium. Reference Carrie and Ginestet11
Aim
The aim of this study was to develop a new method to assess the degree of damage numerically for OARs along with CI assessment for the target.
Materials and Methods
The radiotherapy plans of 30 patients of different sites, diagnosed as cancer, were selected for this study irrespective of gender. Out of 30 cases, 8 plans were of head and neck, 2 were of Glyoblastoma(GBM), 10 were of pelvis, 5 were of left breast and other 5 were of oesophagus cancer. The mean age was 42 years ranging from 31 to 72 years. Patient’s consents were taken before starting the treatment and carried out this research. The physics team generated IMRT and VMAT plans using eclipse treatment planning system (TPS) (version 11.0; Varian Medical System, USA). In IMRT plan, 7–9 beams deployed at equal interval, while in VMAT, two beams used for optimisation. All plans were evaluated for target’s dose coverage and sparing of OARs, and patient-specific quality assurance (QA) plan for each patient was generated and checked for the radiation dose before starting the treatment. Target as planned target volume (PTV) was delineated with 2–5 mm margin to clinical target volume (CTV) in each case as per tumour geometry and its complexity. Heart, bilateral lungs, thyroid, parotids, spinal cord, optics nerves, ipsi- and contralateral breasts and other OARs were separately contoured according to RTOG guidelines. Radiation dose was prescribed to targets as per National Comprehensive Cancer Network clinical practice guidelines. For this study, isodose 90–95 % of prescribed dose was considered as reference isodose line just for analysis of the target’s dose coverage depending upon complexity of tumour. We followed Quantitative Analyses of Normal Tissue Effects in the Clinic (QUANTEC) protocol for analysing and prescribing dose to OARs. For measuring the irradiated volume (VVOI) of OARs, we converted the required isodose line into a new structure and then subtracted this isodose volume from desired organ’s volume using the Boolean tools available in the TPS. The computerised tomography (3·0-mm slice thickness) was used to delineate the target volume, OARs and other structures of interest. The CTV and the PTV were delineated according to the definition by the ICRU Report 50.
There are various methods to assess the conformity of target’s dose coverage; CI is one of them. RTOG has defined the CI as following:
 $${\rm{CI}} = {{\rm{V}}_{{\rm{RI}}}}/{{\rm{V}}_{\rm{T}}}$$
where RI stands for reference isodose line, VRI is the volume of the reference isodose line and VT is the target volume. Reference Feuvret, Noël, Mazeron and Bey12
RF calculation for OARs
Generally, the RF of OARs around the tumour during the course of irradiation depends upon mainly three factors described as following:
Irradiated volume of the organ (vvoI)
In general, the RF of any critical organ around the tumour depends upon its volume gets irradiated during irradiation. VVOI is the volume intersection of desired isodose volume (maximum tolerance dose or mean tolerance dose volume) and the irradiated organ’s volume. It is directly proportional to the fragment of the volume of OAR which gets irradiated by its tolerance dose. It is graphically represented in Figure 1. If the fragment of irradiated volume increases, then the risk of damage of OAR increases and vice versa. The process of measurement VVOI is displayed in Figure 2 (VVOI = organ’s volume – reference isodose volume).
 $${\rm{RF}} \propto {{\rm{V}}_{{\rm{VOI}}}}.$$

Figure 1. Graphical representation of RF versus VVOI.

Figure 2. Pictorial representation of irradiated volume of organ at risk (OAR).
Total volume of the organ (VTVO)
Normally, the RF of an OAR depends on its entire volume (VTVO). If the total volume of an OAR is more, then its risk of damage is less during irradiation and vice versa. This is graphically displayed in Figure 3. It is inversely proportional to the total volume of the organ, that is,
 $${\rm{RF}} \propto 1/{{\rm{V}}_{{\rm{TVO}}}}.$$

Figure 3. Graphical representation of RF versus VTVO.
Tolerance dose of the vital organs (DTDO)
In fact, the tolerance dose of an organ depends on its nature, muscles structure and its capacity to tolerate radiation dose. Tolerance dose decides the degree of damage of a normal organ on account of irradiation. For serial organs, it is the Maximum Dose, and for parallel organs, it is the Mean Dose. If tolerance dose is more, then there is less chance of damage during irradiation and vice versa. This is graphically displayed in Figure 4. Tolerance dose of various critical organs is tabulated in Table 1. Reference Marks13,Reference Emami14 The RF of an OAR is proportional to its tolerance dose which is formulated as following:
 $${\rm{RF}} \propto 1/{{\rm{D}}_{{\rm{TDO}}}}.$$
On combining Equations (2–4), we have
 $${\bf{RF}} \propto {{{{\bf{V}}_{{\rm{VOI}}}}} \over {{{\bf{V}}_{{\rm{TVO}}}} \times {{\bf{D}}_{{\rm{TDO}}}}}}$$
 $${{\therefore}\,\,\bf{RF}} = {{\bf{D}}_{\bf{P}}} \times {{{{\bf{V}}_{{\rm{VOI}}}}} \over {{{\bf{V}}_{{\rm{TVO}}}} \times {{\bf{D}}_{{\rm{TDO}}}}}}$$
where D P is a constant quantity which stands for prescribed dose to the PTV. It depends upon nature and type of cancer.

Figure 4. Graphical representation of RF versus DTDO.
Table 1. Tolerance dose for critical organs

RF scale
Now there was a problem for our medical physics team how to represent the degree of damage of OARs on account of irradiation? To overcome this issue, our physics team proposed a new scale to assess numerically the degree of damage of OARs. It was assumed ‘0’ if there was no damage of normal organ. And for whole organ damage, it was assumed ‘1’. For assessing the risk of damage rationally, we divided the scale into three parts: Low Risk, Medium Risk and High Risk. It is numerically represented on RF scale shown in Figure 5.

Figure 5. Risk factor scale for organs at risk.
Low RF: If the numerical value of RF is 0 or near to 0, then the OAR is completely safe and it is the safest zone for the normal organ. And we can confidently say that the organ will remain unharmed during the course of irradiation.
Medium RF: If the numerical value of RF is 0·5 or near to 0·5, then the OAR will get partially damaged during the course of irradiation.
High RF: If the numerical value of RF is 1·0 or near to 1·0 or more than 1·0, it means the OAR will get completely damaged because of irradiation.
RFC formula
The risk factor conformity index (RFC) includes both the RF of OAR and the concept of CI. Actually, it is the sum of CI and RF. And it must be represented in expanded form as following:
 $${\rm{RFC }}\ \left( {{\rm{risk\ factor\ conformity\ index}}} \right) = {\rm{CI}} + {\rm{RF}}.$$
 $${\therefore}\,\, {\rm{RFC}} = [({{\rm{V}}_{{\rm{RI}}}}/{{\rm{V}}_{\rm{T}}}) + {{\rm{D}}_{\rm{P}}} \times \{ ({{\rm{V}}_{{\rm{VOI}}}})/({{\rm{V}}_{{\rm{TVO}}}} \times {{\rm{D}}_{{\rm{TDO}}}})\} ].$$
Dose reporting
For analysing the radiation dose to OARs, we put them into three categories: (1) serial organ; (2) parallel organ and (3) serial–parallel organ. For serial organ, its maximum tolerance dose was considered as reference isodose line to measure VVOI, while for parallel and serial–parallel organs, their mean dose was taken as reference isodose line to measure VVOI. The prescribed dose was considered as reference isodose line to calculate VVOI for bladder and rectum in pelvic cases in which prescribed dose was 50·4 Gy in 28 fractions or 45 Gy in 25 fractions. And for bowel bag tolerance, isodose line was of 50 Gy. This is displayed in Figure 6a–6e.

Figure 6. (a)–(e) Displaying VVOI and isodose lines in various sites of irradiation.
In order to calculate RFC, irradiated volume of OAR (VVOI) was measured in each plan using Boolean tools of TPS. After that, CI, RF and RFC were calculated for every plan. This is tabulated in Tables 2–9.
Table 2. PTV dose, diagnosis and conformity index in head and neck, and GBM cancer
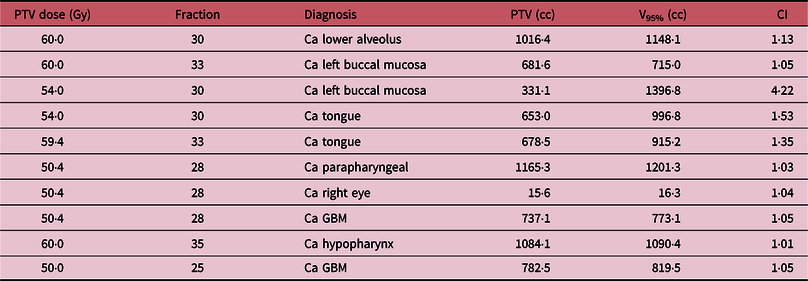
Ca, cancer; GBM, glyoblastoma; CI, conformity index.
Table 3. RF and RFC details for organs at risk
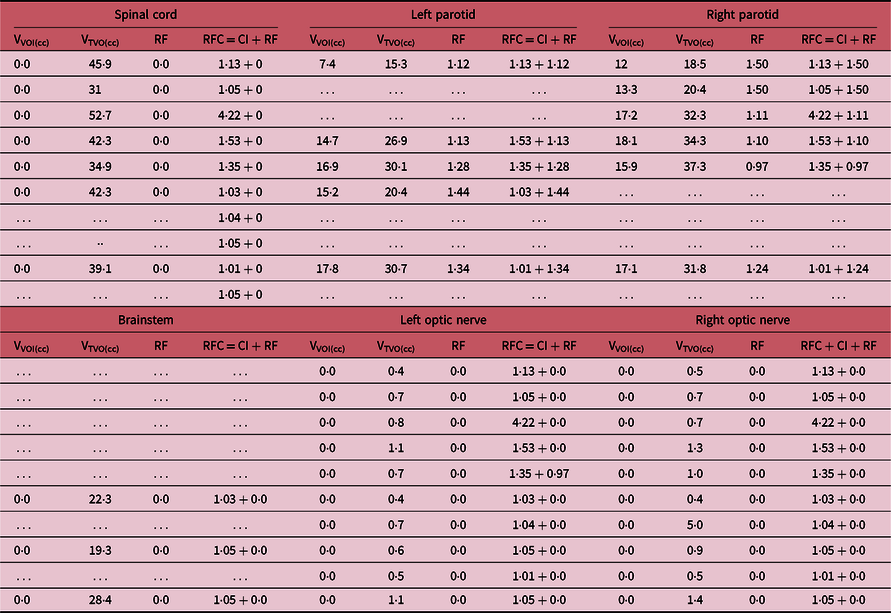
Table 4. PTV dose and diagnosis and CI values in pelvic cases

Table 5. RF, RFC and irradiated volume details for organs at risk

Table 6. Prescribed dose, fraction and CI in breast cases

Table 7. RF, RFC and irradiated volume details for organs at risk

Table 8. Details of PTV dose, diagnosis and CI in oesophagus cases

Table 9. RFC and RF details for organ at risk

Result
The new formula developed for plan analysis is
 $${\rm{RFC}} = [({{\rm{V}}_{{\rm{RI}}}}/{{\rm{V}}_{\rm{T}}}) + {{\rm{D}}_{\rm{P}}} \times \{ ({{\rm{V}}_{{\rm{VOI}}}})/({{\rm{V}}_{{\rm{TVO}}}} \times {{\rm{D}}_{{\rm{TDO}}}})\} ],$$
i.e., RFC = CI + RF.
In head and neck cases, for right parotid, the maximum value of RF is 1·50 and minimum value is observed as 0·97. Maximum and minimum RF values for left parotid are 1·44 and 1·12, respectively. While optic nerve, brainstem and spinal cord are completely safe as their RF values are found to be 0 on RF scale. Left and right eyes are also completely safe.
In pelvic cases, maximum values of RF for rectum, bladder and bowel are 0·39, 0·32 and 0·06, while minimum values are 0·03, 0·13, and 0·0, respectively. In breast cases, maximum and minimum values of RF for heart are 0·27 and 0·03, whereas for ipsilateral lung are 0·80 and 0·32, respectively.
The maximum RF of right parotid in head and neck cancer is 1·50 which shows that the organ has damaged completely on account of irradiation. In pelvic cancer, the maximum RFs for rectum and bladder are 0·39 and 0·32, respectively. Hence, we can say that bladder and rectum are safe as per RF scale and it is clinically observed as well.
The maximum RF of ipsilateral lung is 0·80 in breast irradiation which shows that it is at high risk as per RFC method of evaluation.
Discussion
For this study, patients having diagnosis of cancer were randomly selected. Patient-specific QA was conducted for all plans before execution, and measured dose was found within limit (variation ±3%). All plans were analysed first for clinically relevant isodose that covers the targets, while OARs were analysed on the basis of their tolerance dose using QUANTEC protocols.
In fact, the users make an effort to achieve 95% of prescribed dose should cover 100% of target volume and global maximum dose should be ≤105%. If the plan is inferior, then we evaluate the plan at 90–93% of prescribed dose which must cover the whole target volume as per clinical requirement.
CI is not a routine practice at the present time, except for stereotactic radiotherapy for which the CI was introduced. But, it facilitates the users to compare various available techniques. The ideal tool to analyse the radiotherapy plan does not exist at present time.
CI gives the idea about dose coverage to the target, but it does not bring out any data about the degree of damage of normal organs on account of irradiation. So, users have to analyse the plan again and again just to check the dose to surrounding normal organs which is a time-consuming job.
Now a question arises regarding dosimetric conditions, what substandard parameters should be used for preferential dosimetry? It is difficult to answer such question in respect of limited informations regarding a possible interrelation between clinical data and theoretical parameters. Reference Nakamura, Verhey and Smith15 The question on the reliability of RTOG CI in dosimetric analysis of external beam radiotherapy has also been raised by Knoos et al. Reference Knoos, Kristensen and Nilsson16 as the selection criteria of VRI may vary from centre to centre.
We know that IMRT and VMAT techniques have been introduced to deliver dose to the target homogeneously and spare the normal organs around the tumour. Hence, RFC provides a good tool to users to analyse the radiotherapy plan keeping in the view of sparing the OARs. In this study, RFC is introduced in expanded form. The first part explains the dose conformity of the target, while the second part assesses the degree of damage of OARs around the tumour on account of irradiation, that is,
 $${\rm{RFC}} = {\rm{CI}} + {\rm{RF}}.$$
 $${\rm{Hence}},{\rm{ Z}} = {\rm{X}} + {\rm{Y}}.$$
There is a general observation that the selection of reference isodose line varies from plan to plan and institution to institution depending upon nature of tumour and clinical protocols. Hence, the numerical value of CI will vary accordingly. But, the risk of damage for OARs remains same; it depends upon the part of volume of critical organ gets irradiated and total dose received. The major advantage of RFC is its simplicity and integrity of multiple parameters. We can understand it by the following examples:
-
(a) If RFC = CI + RF = 1·13 + 1·50 for right parotid: It means, the plan is almost good as per view of dose coverage to the target, but right parotid will be burnt out due to irradiation as RF of right parotid is at higher side. Now, it depends upon clinical decision whether to improve the plan or sacrifice the right parotid depending upon nature and complexity of the tumour and patient’s condition as well.
-
(b) If RFC = CI + RF = 1·05 + 0 for spinal cord: In this plan, dose coverage to the target is good and spinal cord is completely safe as its RF is 0. It means 45 Gy dose, which is the tolerance dose of spinal cord in this study, is not reaching to the OAR.
Hence, it is clear that RFC is a comprehensive tool to evaluate the radiotherapy conformal plans. Moreover, it encompasses altogether both the target’s dose coverage and degree of damage of OARs during plan analysis.
Conclusion
It is concluded that the RFC is a comprehensive evaluation tool for conformal radiotherapy plans which encompasses a wider range of clinically relevant parameters, isodose volumes and tolerance dose of OARs. It is an advance tool to check both the qualitative and quantitative nature of a conformal plan including the assessment of degree of damage of the OARs on account of irradiation. The major advantage of this index is that it gives information to users about the conformity of dose to tumour and severity level of damage of OARs at a glance.
If RF ≥ 1, then OAR will be completely damaged as a result of irradiation.
If RF = 0, then OAR will remain completely safe during the course of irradiation.
If RF < 0·5, then the lower risk of damage for OAR.
If RF ≥ 0·5, then the higher risk of damage for OAR.
Hence, the study recommends to use the new index RFC as a radiotherapy plans analysing tool, and RFC must be represented in the expanded form like RFC = CI + RF so that users can easily assess about the dose coverage of the tumour and degree of damage of OARs.
Acknowledgements
The authors are very much thankful to Dr Sajal Sen (COO, Apollo Hospitals Bilaspur, Chhattisgarh, India) for providing us desired supports at every level and encouraging us to set the new dimension for the field of research. Moreover, the authors extend our special thanks to our colleagues who directly or indirectly helped us to complete the brilliant project within the time frame.
Funding
The authors received no funding from any organization for this project.
Conflict of interest
There is no conflict of interest for this project.


