


Background
Across the history of radiotherapy, with gradual technological progress and various techniques of irradiation, the purpose has always been to deliver homogeneously 100% of prescribed dose to target volume containing identifiable tumour and tumour cells potentially present while limiting the dose to adjacent normal tissues.
In beginning, the first method which was used to analyse dose distribution was computed tomography (CT) for two-dimensional dosimetry. Qualitative evaluation of the treatment plan was based on visual dosimetric analysis, section by section.
However, detailed comparison between several treatment plans is difficult and imprecise. Improvements in dosimetry software have progressively allowed visualisation of spatial arrangement of tumour, critical organs, and isodose lines in the form of a single three-dimensional representation that can be observed from all angles.
Qualitatively, three-dimensional dose distributions is represented in the form of dose–volume histograms that can be used to define the maximum, minimum, modal and mean dose values delivered to each volume of interest, as well as the dose delivered per unit or percentage volume of these structures. This dose distribution modelling is easy to interpret for tumour volume, because it defines the isodose line that covers a given percentage of tumour volume. This modelling also indicates dose delivered to the critical organs delineated (particularly maximum doses, and doses delivered per unit or percentage of volume of critical organs), and allows comparison of these doses to theoretical doses considered to be the maximum tolerated doses.
Despite all such methods of evaluation of the radiotherapy plan, a single point quantity was needed for users which could give qualitative information at a glance. Hence, the conformity index was introduced in 1993 by the Radiation Therapy Oncology Group (RTOG) and described in Report 62 of the International Commission on Radiation Units and Measurements (ICRU), it has not become part of routine practice.Reference Huchet, Caudry and Belkacémi 1 , Reference Menzel 2
Although its role has not yet been defined, most likely because the value of conformal radiotherapy is just beginning to be demonstrated in terms of prevention of adverse effects and tumour control.Reference Armstrong, Raben and Zelefsky 3 – Reference Lee, Hanks and Hanlon 6 Clinical value of conformal radiotherapy techniques should be clearly confirmed before the conformity index can be used and evaluated as a complementary tool.
The conformal radiotherapy is designed in such a way that it may achieve the best adaptation of shape of desired isodose line envelope to exact shape of the target volume.Reference Rosenwald, Gaboriaud and Pontvert 7 In 1995, Carrie et al. reported that conformal radiotherapy could be the next major revolution in the field of radiotherapy.Reference Carrie, Ginestet and Bey 8 In 2001, the same authors concluded that, at the dawn of the third millennium, conformal radiotherapy had already become the standard radiotherapy modality. The practical approach to such modalities varies across the various centers that perform this kind of technique. Hence, it is important to define clearly what we mean by conformal radiotherapy in terms of the minimum and necessary standards, such as those consensually proposed by about 30 European institutions in 1997 (DYNARAD: development and standardisation of new DYNAmic RADiotherapy technics).Reference Rosenwald, Gaboriaud and Pontvert 7 , Reference Kolitsia, Dahlb and Van Loonc 9 All these standards are composed of a series of mandatory steps such as compression, acquisition of anatomic data by imaging combined with definition of target volumes (ICRU 50) and critical organs and, finally, verification and implementation of therapy.Reference Bey and Gerard 10 – Reference Pommier, Ginestet and Carrie 13
However, multiple indices have been proposed with difficulties in their interpretation which raised a number of problems. The use of one numerical value including coverage of planning target volume (PTV) and excess volume of the high dose region is not a clear solution.Reference Piotrowski, Martenka and Patoul 14
Purpose
The main purpose of this study was to find out a new comprehensive index to evaluate conformal radiotherapy plans which can extract qualitative information at a glance.
Material and method
Conformity index (CI) of target is defined as
 $$CI\,{\equals}\,V_{{\rm RI}} /V_{\rm T} $$
(As per RTOG),Reference Feuvret, Noël, Mazeron and Bey 15 where RI is the reference isodose line, V RI the volume of the reference isodose line, V T the target volume
 $${\rm CSN\,{\equals}}\,\left[ {\left( {1/NV_{{\rm T}} } \right)} \right]\,\left[ {\mathop{\sum}\limits_{i{\equals}95{\plus}x}^{105} {(V_{i} {\plus}x)} } \right]$$
where x=0, 5 and 10.
For the ‘Triple Point Conformity Scale’, we have taken N=3. Hence,
 $${\rm CS3}\,{\equals}\,{{\left( {V_{{95}} {\plus}V_{{100}} {\plus}V_{{105}} } \right)} \mathord{\left/ {\vphantom {{\left( {V_{{95}} {\plus}V_{{100}} {\plus}V_{{105}} } \right)} {3V_{T} }}} \right. \kern-\nulldelimiterspace} {3V_{\rm T} }}$$
where V 95 is the target volume covered with 95% isodose line (in cc); V 100 the target volume covered with 100% isodose line (in cc); V 105 the target volume covered with 105% isodose line (in cc).
Lower limit determination
As per practical qualitative approach in radiotherapy planning worldwide: V 95/V T=1
 $$V_{{{\rm 95}}} \,{\equals}\,V_{{\rm T}} $$
 $$V_{{{\rm 1}00}} \,{\equals}\,0\!\cdot\!{\rm 93 }V_{{\rm T}} $$
 $$V_{{{\rm 1}0{\rm 5}}} \,{\equals}\,0\!\cdot\!00$$
Hence, CS3=(V T+0·93V T+0·000)/3V T=0·643
Upper limit determination
Since the inception of radiotherapy, the ideal concept has been 100% of prescribed dose should cover 100% target volume.
 $$V_{{100}} \,{\equals}\,V_{{\rm T}} $$
But the actual problem is that there is no relation described throughout the literature, even in ICRU, between V 100 and V T. Everywhere in ICRU, hot spot is defined as a volume of diameter 15 mm or less. In our current study, we have considered a sphere, cylinder and cone of diameter 15 mm. As per practical concept in radiotherapy, the volume of hot spot should be minimal. Hence, we have selected a cone to find out the volume of hot spot displayed in Figure 1.
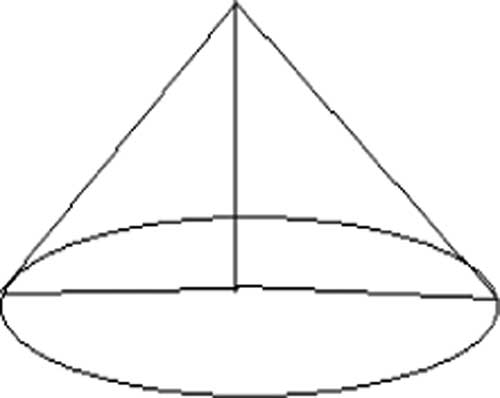
Figure 1 Cone of diameter. d=15 mm and height h=d/2 mm.
 $${\rm Volume}\,{\rm of}\,{\rm a}\,{\rm cone}\,{\rm is}\,{\rm given}\,{\rm by}\,{\rm the}\,{\rm formula}{\equals}{1 \over 3} \pi r^{{\rm 2}} {\rm \cdot}h{\equals}{1 \over 3} \pi r^{{\rm 3}} $$
, where r=h.
$${\rm Volume}\,{\rm of}\,{\rm a}\,{\rm cone}\,{\rm is}\,{\rm given}\,{\rm by}\,{\rm the}\,{\rm formula}{\equals}{1 \over 3} \pi r^{{\rm 2}} {\rm \cdot}h{\equals}{1 \over 3} \pi r^{{\rm 3}} $$
, where r=h.
Hence, the volume of the cone (hot spot) has the diameter 15 mm=0·442cc.
To find the empirical relation between V 105 and V T, our medical physics team has studied over 593 conformal radiotherapy plans of various sites, and an empirical relation has been derived out which is given in equation (8).
 $$V_{{105}} /V_{\rm T} {\equals}0\cdot0007$$
Hence, CS3=(V T+V T+0·0007V T)/3V T=0·6669~0·667
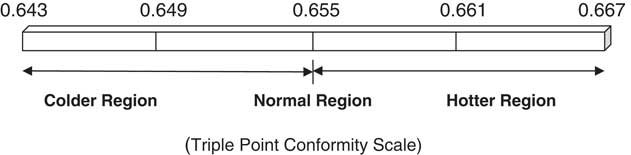
On the basis of lower and upper limit, a scale has been formed for qualitative evaluation of a conformal radiotherapy plan. This will help the users in accurate analysis. The scale is given below:
Plan evaluation as per CS3 scale and dose reporting
In the current study, 10 Intensity Modulated Radiotherapy Treatment (IMRT) plans of head and neck cancer are taken into consideration. A dose-volume histogram (DVH) has been generated for each plan. D 95, V 95, V 100, V 105, CS3 for PTV, and standard deviation (STD) are being analysed, and are tabulated in Table 1.
Table 1 Target’s dose and volume details with CI and CS3 values

Result
Upper and lower limit of CS3 have been calculated as 0·643 and 0·667, respectively. Mean value of the CS3 scale has been found 0·478 with 95·78% of target coverage, displayed in Table 2. On the CS3 scale, the colder region varies from 0·643 to 0·655, while the hotter region varies from 0·655 to 0·667. Maximum and minimum value of CS3 are recorded as 0·656 and 0·478 respectively in the current study, and this is tabulated in Table 3. The mean value of the upper and lower limits on the CS3 scale is 0·655, which is further named as the normal region.
Table 2 Mean value of D 95, CI and CS3

Table 3 Maximum and minimum value of D 95, CI and CS3

Discussion
It is a common practice in radiotherapy for users to first try to achieve that 95% of prescribed dose should cover 100% of target volume and maximum dose should not exceed 105%. If the plan is inferior, then users should try to evaluate the plan at 93% of prescribed dose which must cover the whole target volume as per clinical need. The ideal concept has been that 100% of the prescribed dose should cover 100% of target volume. Hence our medical physics team has decided to focus on the clinically relevant isodose line volumes V 95, V 100 and V 105 for introducing the CS3 scale. All these volumes are calculated and measured in cubic centimeters (cc).
The conformity index alone cannot provide practical information about treatment plan because it is a single isodose line quantity. It neither covers the volume of hot spot nor gives information about spatial dose distribution. Resultantly, the treatment plan has been analysed by visualisation of CT slices and DVH. But on the other hand, the CS3 scale takes care about spatial dose variation starting from lower dose (93%) to higher dose–volume (105%). Actually CI was initially proposed for stereotactic conditions, a method ensuring the most rigorous and precise treatment planning. Generally CI raises two major issues. At first, cut-off values are defined to determine whether the treatment complied with the protocols, but the values indicating that a treatment plan is unacceptable are not defined. What condition should be used to determine the choice of dosimetry with suboptimal parameters?
It is difficult to answer such questions in respect of limited information concerning a possible correlation between clinical data and theoretical parameters.Reference Nakamura, Verhey and Smith 16 Second, in relation to external beam radiotherapy, it has been raised by Knoos et al. and concerned the limitations of the RTOG conformity index,Reference Knoos, Kristensen and Nilsson 17 because the definition of V RI may differ from one center to another. This parameter corresponds to either the minimum isodose volume containing the target volume, as is often the case in radio surgery, or the 95% isodose volume according to ICRU 50 guidelines.
Hence, conformity indices can vary as per the selection of isodose lines. But the CS3 scale does not vary, and encompasses both lower (93%) and higher (105%) dose–volume. Consequently it is able to squeeze out qualitative information about the radiotherapy treatment plan.
For this study 10 patients of IMRT plan of head and neck cancer have been analysed using the CS3 scale and results are tabulated in Table 1.
All plans were generated by the eclipse treatment planning system, version 11.0. Quality assurance was done for all plans before execution on patient and found within limit of variation ±3%.
V 100 plays an important role in passing or failing a conformal plan on the CS3 scale. Only two plans out of 10 have been passed with good target coverage.
CI is not widely used in routine clinical practice at the present time, except for stereotactic radiotherapy for which the conformity index was introduced. However, apart from its contribution to everyday practice, it would also facilitate comparison between various available techniques and could be used to evaluate new technologies.
The ideal tool to evaluate the plan does not exist at the present time. CI and other existing indices are too diverse to achieve the desired objective; that is, to quantify the quality of a treatment with 100% sensitivity and specificity. The future of conformity indices in routine practice, therefore, remains unclear.
From Table 1, it is clear that only those plans which have V 100 of bigger size, but smaller than V T, passed on the CS3 scale. All IMRT plans under this study have passed as per CI parameter. But the same plans are poorly responding on the CS3 scale because of the smaller size of V 100 and poor target coverage.
The CS3 scale is a comprehensive tool for qualitative evaluation of a plan and could be continued further because it facilitates decision during analysis of various treatment plans proposed for conformal radiotherapy. Its major advantages are its simplicity and integration of multiple parameters. It is a precise way to evaluate the radiotherapy conformal plans. Moreover, it encompasses both lower and higher dose–volume.
Conclusion
The triple point conformity scale (CS3) provides gross information about radiotherapy plans as compared with other conformity indices. The CS3 scale gives a range of conformity values starting from 0·643 to 0·667. For precise evaluation of conformal plans, the CS3 scale is subdivided into three parts such as colder region (0·643–0·655), normal region (0·655) and hotter region (0·655–0·667). This subdivision of the scale helps the user to understand spatial dose distribution inside the target volume at a glance.
Hence, it is concluded that the CS3 scale is a comprehensive evaluation tool encompassing a wider range of clinically relevant isodose volumes. It is a precise tool to check the qualitative nature of a conformal plan. So, this study advises the user to use the CS3 scale to evaluate radiotherapy plans.
Acknowledgements
The authors are very much thankful to Dr Vishal Goyal and Dr Sajal Sen for providing us with support at every level and encouraging us to set the new dimension for the field of research.


