


Introduction
Recent clinical studies have shown better local control mainly associated with dose escalation. Reference Kalbasi, Li and Berman1–Reference Zaorsky, Keith and Shaikh5 This has been possible due to conformal dose distribution achieved using advanced planning, imaging and delivery techniques. Advanced 3D treatment planning systems (TPSs) play a pivotal role to meet the requirements of recent delivery techniques coupled with dose escalation. Reference Aarup, Nahum and Zacharatou6–Reference Jeraj, Keall and Siebers8 Accuracy of treatment delivery is strongly influenced by the accuracy of dose calculation which in turn relies on the accuracy of beam modelling on TPS. The last two decades have seen a rapid growth in dose calculation models from correction-based to model-based engines leading up to Monte Carlo dose models in the recent years. Reference Breitman, Rathee and Newcomb9–Reference Ulmer, Pyyry and Kaissl12 Such advanced TPS models compute dose on 3D computed tomography (CT) scans to accurately account for heterogeneity and are most often validated by secondary dose calculation models that are capable of verifying advanced treatment techniques. Reference Chen, Xing and Nath13–Reference Haga, Magome and Takenaka15
Knowledge-based planning, automated treatment planning and integration of treatment techniques to a common platform to promote accurate, efficient and safe treatment delivery are some of the key areas being addressed by various TPS manufacturers. Recent years have seen increase in clinics transitioning their workflows and dose engines to such advanced systems. Reference Ghandour, Matzinger and Pachoud16–Reference Wang, Hu and Yang18 Assimilation of newer TPS into clinical workflow requires fast and accurate commissioning of existing treatment machines on the newer TPS. TPS commissioning is the process by which parameters are determined for a beam model and validated to assess how well the model generated dose profiles and parameters compared to measured data. Commissioning process requires acquisition of beam data as per the TPS vendorʼs requirements followed by procedure of modelling/parameter fitting. Every step of this process has to be verified as even a slight deviation from this could result in an incorrect model. Reference Akino, Gibbons, Neck, Chu and Das19,Reference Gersh, Best and Watts20 The process is concluded with rigorous TPS validation which is to ensure that the calculated dose distribution compares to measured dose distribution including accuracy in monitor unit (MU) calculation for a wide range of tests. Reference Das, Cheng and Watts21,Reference Fraass, Doppke and Hunt22 This process usually disrupts clinical treatments and requires increased manpower to complete the tasks efficiently and accurately. Acquisition of data for commissioning process is the most onerous task and requires the machines to be tuned to enhance accuracy.
The aim of this study is to show that an independent TPS (I-TPS) can be commissioned using data from an existing commissioned TPS (C-TPS) without reacquisition of any beam data. In this study, we show commissioning of Eclipse™ TPS (Varian Medical Systems, Palo Alto, CA, USA) using beam-model data extracted from Pinnacle™ TPS (Philips, Fitchburg, WI, USA). Analytical anisotropic algorithm (AAA) used by Eclipse™ and collapsed cone convolution (CCC) algorithm used by Pinnacle™ are both model-based dose calculation engines. Both engines calculate 3D TERMA grid by projecting the incident energy fluence through the patient representation, followed by superposition of the TERMA with a dose deposition kernel to compute the dose in the patient. Reference Chen, Xiao and Li23 AAA accounts for tissue heterogeneity anisotropically in the entire 3D neighbourhood of an interaction site by the use of radiological scaling of the dose deposition functions and the electron density-based scaling of the photon scatter kernels independently in four lateral directions. Reference Sievinen, Ulmer and Kaissl24 In CCC, heterogeneities are accounted by scaling the point kernel model in three dimensions per the elemental composition and density variations in the medium. Reference Ahnesjo25 The machine used in the study is a 21-EX model by Varian Medical Systems™ (Las Vegas, NV, USA), capable of step-and-shoot intensity modulated radiation therapy (IMRT) and dynamic arc delivery.
This paper is divided into three main sections: In the methods section, we briefly describe the methodologies used for data extraction and algorithm validation. Results of the modelling and I-TPS verification are presented in the following section summarised by the key points of the process in the discussion and conclusion sections.
Materials and Methods
C-TPS was commissioned using measured data acquired at the time acceptance and commissioning of a new linear accelerator and has been in clinical use for over 5 years. The commissioning process for I-TPS was done based on requirements for AAA beam modelling in Eclipse™ version 11. The required set of beam measurements for AAA beam data extracted from C-TPS were as follows:
-
(1) Open field depth dose, crossline and inline profiles at five depths for square field sizes: 3 × 3 cm2, 4 × 4 cm2, 6 × 6 cm2, 8 × 8 cm2, 10 × 10 cm2, 12 × 12 cm2, 15 × 15 cm2, 20 × 20 cm2, 25 × 25 cm2, 30 × 30 cm2, 35 × 35 cm2 and 40 × 40 cm2.
-
(2) Diagonal dose profiles at five depths for field size: 25 × 25 cm2.
-
(3) Output factors for all field sizes from3×3 cm2 to 40 × 40 cm2 at reference depth of 10 cm.
For the extraction process, a 3D water phantom of 50 ×50 × 50 cm3 (Δx, Δy and Δx = 2 mm) was generated using Matlab™ (MathWorks, Inc., Natick, MA, USA) and exported in digital imaging and communications in medicine (DICOM) format to C-TPS. The I-TPS requirements were fed into a template that was used by an in-house Matlab™ programme to generate scripts to be executed in the C-TPS environment. Dose profiles were computed by executing the main script per the requirements described above at grid resolution of 2 mm for field sizes greater than 5 × 5 cm2 and at 1 mm for smaller field sizes isotropically. The last module of the scripts was used to export the computed dose profiles using cubic interpolation at 0·5 mm resolution in the file format as required by I-TPS.
It should be noted that an average dose over 0·5 cc region of interest (ROI) was used to extract calculated dose at required field sizes for output factors instead of dose at a single point. The output factors and profiles were then imported into I-TPS.
Commissioning verification
In this study, commissioning verification was performed by comparing profiles of multi-leaf collimator (MLC)-defined standard fields and shapes. This was followed by verification of dose distribution computed by I-TPS for select clinical treatment plans.
Profiles and standard shapes
Goodness of fit between inline, crossline and percent depth dose (PDD) profiles generated using jaw-defined fields is an integral part of Eclipse™ commissioning process. Hence, verification fields mainly consisted of MLC-defined standard fields and shapes as shown below.
MLC-defined square verification fields
2 × 2 cm2, 3 × 3 cm2, 4 × 4 cm2, 10 × 10 cm2.
Shapes
-
(a) 4 × 4 cm2, C-shape (min MLC separation < 1 cm, J: 10 × 10 cm2).
-
(b) 10 × 10 cm2, C-shape (min MLC separation < 1.5 cm, J: 16 × 16 cm2).
-
(c) 16 × 16 cm2, C-shape (min MLC separation < 1.5 cm, J: 24 × 24 cm2).
-
(d) 6 × 10 cm2, S-shape (min MLC separation < 2 cm, J: 10 × 16 cm2).
-
(e) 23 × 16 cm2 off-axis S-shape (min MLC separation = 2.5 cm, J: 25 × 20 cm2).
Off-axis fields
-
(a) 3 × 20 cm2 off-axis fields (offset 8.5 cm in the -ve X-direction).
-
(b) 20 × 3 cm2 off-axis fields (offset 8.5 cm in the -ve Y-direction).
Dose was computed for the verification fields on a water phantom in I-TPS and was exported in DICOM format. These dose files were subsequently imported into C-TPS using scripts based on Pydicom (https://pydicom.github.io/) and associated tools.
Inline and crossline profiles extracted at various depths from C-TPS and I-TPS calculated dose map for the above verification fields were analysed using in-house software. Each profile was analysed in three regions: infield, penumbra and tail regions. The infield region is defined as the central 80% of the geometric field size projected at known depth, the penumbra region is defined as the region bounded by 20 and 80% of the profile on each side and the tail region is defined as the region between 20% on the curve to an additional 1·5 cm beyond this point on each side of the profile. The infield data were analysed using gamma methodology, with 2%/2 mm as the passing criteria. For the penumbra region, gamma metric was calculated using 3%/3 and 2%/2 mm criteria.
Treatment plan comparison
CT images, structures and plans for select clinical cases planned on C-TPS were anonymised and exported in DICOM format. The plans were then re-calculated while maintaining same MUs on the I-TPS. The calculated dose was re-exported back to C-TPS for evaluation. The clinical plans evaluated were as follows:
Lung: Anterior-Posterior (AP-PA) technique with equal weight.
Intact prostate and proximal seminal vesicles: IMRT.
Thyroid: Small-field IMRT.
Pelvic nodes with simultaneous prostate boost: volumetric modulated arc therapy (VMAT).
Results
Model
Jaw-defined PDD and profiles were imported into I-TPS and the commissioning module in Eclipse TPS was used to auto-generate a beam model for the machine under study. The model generated by I-TPS was within the commissioning requirements as specified in TG-106 Reference Das, Cheng and Watts21 ; however, improvement in the penumbral region was achieved by increase in dosimetric leaf gap by 10%, that is, 0·012 mm and by increasing spot-size parameter in the Y-direction by 0·2 mm.
Verification fields
Agreement results for MLC-defined fields compared between I-TPS and C-TPS showed
-
(a) >95% of points passing 2%/2 mm criteria and >90% passing the 1%/1 mm criteria in the central region.
-
(b) Penumbral region: >95% passing was noted for 2%/2 mm criteria and 99% for 3%/3 mm criteria. 3D dose comparison was done visually on C-TPS and by using dose volume histogram (DVH) analysis for contours created from C-TPS isodose lines.
Figures 1a and 1b show the crossline profile for MLC-defined 4 × 4 cm2 field and crossline profile comparison for the MLC-defined S-shaped field at 15 cm depth. About 100% of the points fulfill the 2%/2 mm criteria. Presented in Figure 2 is the comparison of the S-shaped MLC-defined field in the coronal and sagittal planes. Isodose lines 830 cGy, 200 cGy and 30 cGy for I-TPS are shown in colour wash (blue, green and orange) while are represented by solid lines for C-TPS (red, purple and blue). It can be visually interpreted that the agreement is better for the higher dose regions.

Figure 1. (a) Crossline profile for MLC-defined 4 × 4 cm2 field. (b) Crossline profile comparison for the MLC-defined S-shaped field at 15 cm depth.

Figure 2. The comparison of the S-shaped MLC-defined field in the coronal (left) and sagittal (right) planes. Isodose lines 830, 200 and 30 cGy for I-TPS are shown in colour wash (orange, green and blue) and C-TPS as solid lines (blue, purple and red), respectively. It can be visually interpreted that the agreement is better at the higher dose regions.
Select clinical plans
A lung case using AP-PA beam arrangement was used to compare doses between C-TPS and I-TPS especially in low-density ROIs. Excellent agreement was observed for the higher isodose lines around the target. However, small discrepancy can be observed at the lower dose regions around lungs and carina. Figure 3a shows the DVH comparison for this plan.

Figure 3. (a) The DVH comparison for the lung plan using AP-PA beam arrangement between I-TPS (dashed) and C-TPS (solid). (b) The DVH comparison for the seven-field IMRT prostate treatment plan between I-TPS (dashed) and C-TPS (solid).
An IMRT plan was generated for prostate and proximal seminal vesicles prescribed to 70 Gy in 25 fractions, while minimising dose to rectal wall, bladder wall and femurs. Figure 3b shows the DVH comparison for this plan. Very good agreement can be seen for Planning Target Volume (PTV) and all organs at risk (OAR)s between C-TPS and I-TPS generated doses.
A treatment plan for thyroid carcinoma with a PTV volume of 63 cc was planned using seven-field IMRT while minimising dose to adjacent sensitive structures such as larynx, oesophagus and cord. Figures 4a and 4b show the isodose distribution for this plan as computed by I-TPS and C-TPS, respectively. Comparison of the dose to target and OAR is shown in the DVH as shown in Figure 4c. Excellent agreement can be observed for the target; however, discrepancy between the I-TPS and C-TPS can be seen for the larynx and trachea OAR. This may be attributed to differences in how the algorithms handle inhomogeneity.
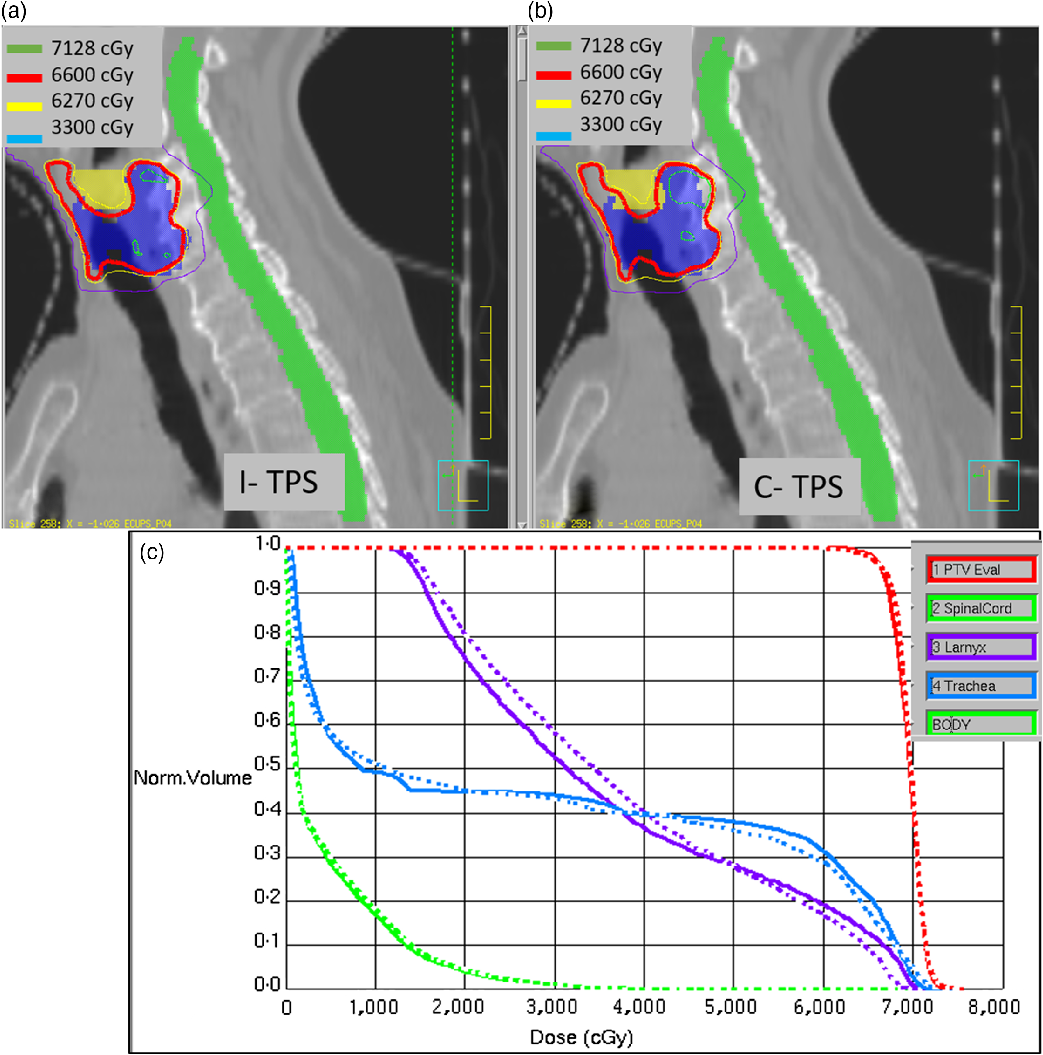
Figure 4. (a) The isodose distribution for a small-field IMRT plan recomputed using I-TPS. (b) The original isodose distribution by C-TPS. (c) DVH comparison between I-TPS (dashed) and C-TPS (solid).
A VMAT plan was optimised with pelvic nodes prescribed to 45 Gy with simultaneous boost irradiation to prostate at 60 Gy in 25 fractions. Figures 5a and 5b show isodose comparison for the large-field VMAT treatment plan. On the left, Figure 5a shows dose re-computed while maintaining the same MUs using I-TPS. On the right, Figure 5b shows the original plan optimised and computed using C-TPS. Minor differences in the hotspots can be noticed in the isodose distribution. DVH comparison for the VMAT plan is shown in Figure 5c.

Figure 5. (a) The isodose comparison for large-field VMAT plan for prostate and nodes recomputed using I-TPS. (b) The original isodose distribution by C-TPS. (c) DVH comparison between I-TPS (dashed) and C-TPS (solid).
Discussion
The work presented in this paper is unique and useful as many clinics are transitioning from older TPS to advanced planning systems due to recent advancement in medical physics and allied fields. There is necessity for a robust system to facilitate this transition in clinics without disrupting clinical workflows and with minimal downtime. Recently, there have been several studies published to automate comparison of verification of standard treatment plans from newly commissioned TPS, Reference Jacqmin, Bredfeldt, Frigo and Smilowitz26,Reference Nelson, Mason, Robinson, Kisling and Kirsner27 most importantly the AAPM MPPG guidelines. Reference Smilowitz, Das and Feygelman28 The efficiency thus gained by automation of data extraction and dose validation can be directed to adapting clinical practices to assimilate the advanced features of the new TPS and seamlessly integrating delivery machines into record and verify systems.
Additionally, successfully commissioned TPS in a busy clinic using such efficient and accurate processes may also be utilised as a secondary dose calculation system. Robust secondary dose calculation has become an essential component especially with increase in utilisation of advanced techniques such as VMAT, Stereotactic Body Radiation Therapy (SBRT) and Stereotactic RadioSurgery (SRS). Very few solutions exist for secondary dose calculation that can handle the complexity of advanced treatment plans. Commissioning of an independent system available in existing clinics is an economical solution, especially in developing countries as compared to a commercially available secondary dose engine. This methodology may also be extended to teaching labs for medical physics graduate or residency programmes, where access to multiple TPS can provide the necessary breadth needed in such programmes.
Conclusion
Commissioning of an independent TPS can be achieved by extracting dose profiles, output factors from existing TPS, without any sacrifice in accuracy of dose distribution or MU calculations. The pilot study presented shows this to be an efficient and accurate substitute in comparison with laborious task of reacquisition of beam data on machines with a full clinical load.
Acknowledgements
None.


