


Introduction
Brain tumours are one of the leading causes of death among cancer patients.Reference Sultanem, Patrocinio and Lambert 1 Approximately, 238,000 new cases of brain tumours and other central nervous system tumours were diagnosed in 2008 with about 175,000 mortality worldwide.Reference Ferlay, Shin, Bray, Forman, Mathers and Parkin 2 Radiotherapy remains the best option for the treatment of un-resectable brain tumours and is responsible for about 78% of non-surgical cancer treatments.Reference Burnet, Thomas, Burton and Jefferies 3 The aim of radiotherapy treatment method is to deliver high radiation dose to tumour volume (TV) while sparing adjacent normal tissues.Reference Mazzara, Velthuizen, Pearlman, Greenberg and Wagner 4 , Reference Rajasekar, Datta, Gupta, Pradhan and Ayyagari 5 This is usually achieved using advanced radiotherapy treatment techniques such as three-dimensional (3D) conformal radiation treatments and intensity-modulated radiotherapy.Reference Prabhakar, Julka, Ganesh, Munshi, Joshi and Rath 6 These treatment methods confine radiation beam strictly to three-dimensional shape of the target/TV.Reference Mazzara, Velthuizen, Pearlman, Greenberg and Wagner 4 The success of these techniques relies upon the accuracy of TV definition. Inaccuracies in delineating the TV could significantly increase the likelihood of the treatment failure.Reference Sultanem, Patrocinio and Lambert 1 , Reference Rajasekar, Datta, Gupta, Pradhan and Ayyagari 5 , Reference Bénard, Romsa and Hustinx 7
To date, computed tomography (CT) remains the most widely used imaging modality in TV definition and dose calculation for Radiotherapy Treatment Planning (RTP).Reference Jonsson, Karlsson, Karlsson and Nyholm 8 , Reference Devic 9 This is due to its high geometrical accuracy and electron density information required for treatment dose calculation.Reference Jonsson, Karlsson, Karlsson and Nyholm 8 However, several authors reported that CT alone does not always adequately delineate TV, most especially when the tumour resides within complex bony structure such as base of the skull.Reference Khoo, Adams and Saran 10 – Reference Datta, David, Gupta and Lal 12 Owing to this challenge several other imaging modalities were introduced into RTP to complement CT through the process of image registration. The use of image registration techniques such as positron emission tomography-computed tomography (PET-CT), positron emission tomography-magnetic resonance imaging (PET-MRI), single-positron emission computed tomography-computed tomography (SPECT-CT), single-positron emission computed tomography-magnetic resonance imaging (SPECT-MRI), PET-CT plus magnetic resonance imaging (MRI), SPECT-CT/MRI in RTP were reported in different studies.Reference Grosu, Weber and Franz 13 – Reference Graf, Plotkin and Steffen 23 These imaging methods were shown to define TV with greater certainties as the information obtained from different imaging modalities were complementary in many instances.Reference Rosenman 24 – Reference Ferrari de Oliveira and Azevedo Marques 27 However, these methods have many downsides which include; errors associated with image registration process, patient inter-procedure positioning error as well as cost and time implication associated with the use of multiple imaging modalities.Reference Jonsson, Karlsson, Karlsson and Nyholm 8 , Reference Stanescu, Jans, Pervez, Stavrev and Fallone 28 , Reference Kristensen, Laursen, Løgager, Geertsen and Krarup-Hansen 29
In the past, MRI alone was introduced into RTP due to its excellent soft tissues characterisation and multi-planar capability.Reference Prabhakar, Haresh, Ganesh, Joshi, Julka and Rath 11 It was shown to give greater tumour information than CT at many different anatomical sites.Reference Ten Haken, Thornton and Sandler 30 , Reference Khoo, Dearnaley, Finnigan, Padhani, Tanner and Leach 31 However, as at then, this technique had not seriously challenged CT in TV definition for RTP due to its inherent image distortion and lack of electron density information required for treatment dose calculation.Reference Kristensen, Laursen, Løgager, Geertsen and Krarup-Hansen 29 – Reference Khoo, Dearnaley, Finnigan, Padhani, Tanner and Leach 31 This precluded its use alone but only to complement CT in TV definition for RTP.Reference Ten Haken, Thornton and Sandler 30 – Reference Lattanzi, Fein, McNeeley, Shaer, Movsas and Hanks 33 Recently, several MRI distortion correction techniques such as gradient distortion correction technique were demonstrated with some successes.Reference Yanke, Ten Haken, Aisen, Fraass and Thornton 34 – Reference Moerland, Beersma, Bhagwandien, Wijrdeman and Bakker 37 In view of this, several authors probed the feasibility of using MRI alone in TV definition for RTP of brain tumours using CT as a yard stick.Reference Khoo, Adams and Saran 10 – Reference Datta, David, Gupta and Lal 12 , Reference Kristensen, Laursen, Løgager, Geertsen and Krarup-Hansen 29 , Reference Weber, Wang and Albrecht 38 However, conflicting findings were noted among these studies. Although MRI-based method was shown to measure larger TV than CT-base method in a number studies,Reference Khoo, Adams and Saran 10 – Reference Datta, David, Gupta and Lal 12 , Reference Kristensen, Laursen, Løgager, Geertsen and Krarup-Hansen 29 with CT defined TV larger in one other study.Reference Weber, Wang and Albrecht 38 Nevertheless, no systematic review was conducted to establish the most appropriate treatment planning method between the two imaging methods.
This review is therefore, aimed at critically evaluating the available literature data that evaluated the use of MRI in TV definition for brain tumours using CT as the baseline. This will establish strong and reliable clinical evidence with regards to the use of MRI alone in TV definition for RTP of brain tumours.
Review Methods
Study identification
A systematic search was conducted on six electronic databases from January 2000 to December 2013 and later updated to 2015. The electronic databases searched were Medline, ScienceDirect, Web of Knowledge, CINAHL, Amed and Cochrane Central Register of Controlled Trials. Medline search method was primarily adopted and this was adjusted subsequently to suit the other databases. Medical Subject Headings and free text key terms were used during the search. Search terms were classified to cover the target participants, interventions and the outcome. The electronic search was limited to only English language published articles but no sex, age or geographical restriction was applied. This was supplemented by Grey literature search and hand search of key journals. In addition, reference lists of potential studies for inclusion were scrutinised for more relevant studies.
Study selection
This review followed the Preferred Reporting Items for Systematic Reviews and Meta-Analysis (PRISMA).Reference Liberati, Altman and Tetzlaff 39 The study selection was conducted by the primary reviewer based on the pre-determined inclusion criteria set in the review protocol. Only studies that compared CT and MRI in TV definition for RTP of brain tumours were considered for inclusion. The selection was done in two stages.Reference Higgins and Green 40 The first stage selection was based on titles and abstracts of all the studies retrieved during the search. The second stage was done based on the full report of the article.
Data extraction
Standardised electronic data extraction form established by Cochrane collaboration was used for the data extraction. The data extraction form was initially pilot tested on a couple of included studies to identify any mislaid or surplus data.Reference Higgins and Green 40 , 41 Participants’ characteristics, details of the interventions (CT and MRI together with their respective imaging parameters used) as well as study characteristics and outcomes were the primary information extracted from each of the studies. The outcomes retrieved were the summary statistics (means and standard deviations) for both MRI and CT defined volumes as well as the number of participants. The available individual patient data (IPD) from three out of the five included studies were accessed and retrieved.
Quality assessment
Effective public Health Practice Project (EPHPP) quality assessment tool for quantitative studies was used for the quality assessment in this review. 42 This tool contains seven components (A–H) with a total number of 18 questions each with answer options; yes, no or unclear. A clear guide on how to answer each of the questions, rating of every component as well as overall rating is contained on a separate document known as dictionary for EPHPP.
Statistical analysis
TV obtained from both CT and MRI were the primary outcomes in this review. The effect estimate was calculated as percentage of non-overlap (percentage mean difference) taking CT volumes as a baseline using Cohen’s d methods.Reference Cohen 43 This was calculated using Microsoft excel 2007 based on IPD retrieved from the three of the five studies. For the remaining two studies, this was calculated based on the published summary statistics. The available IPD were then transferred on to SPSS version 14.0 and re-analysed using Paired t-test for independent variables for purpose of consistency.Reference Higgins and Green 40 The summary statistics obtained from the re-analysis of the three studies and the ones published in the remaining two studies were combined in meta-analysis using RevMan software version 5.0. The statistical method used was inverse variance method using random effect analysis model with 95% confidence interval (CI). Visual examination of the overlap of whisker lines on the forest plot and χ 2 test was done to assess the presence and also quantify the extent of heterogeneity.Reference Collaboration 44 , Reference Huedo-Medina, Sánchez-Meca, Marín-Martínez and Botella 45
Results
A total number of 609 studies were identified during the search but only nine studiesReference Khoo, Adams and Saran 10 – Reference Datta, David, Gupta and Lal 12 , Reference Kristensen, Laursen, Løgager, Geertsen and Krarup-Hansen 29 , Reference Weber, Wang and Albrecht 38 , Reference Krempien, Schubert and Zierhut 46 – Reference Milker-Zabel, Zabel-du Bois and Henze 49 were left after duplicates and irrelevant studies were discarded based on titles and abstract. Out of the nine studies left, only five studiesReference Khoo, Adams and Saran 10 – Reference Datta, David, Gupta and Lal 12 , Reference Kristensen, Laursen, Løgager, Geertsen and Krarup-Hansen 29 , Reference Weber, Wang and Albrecht 38 met the criteria for inclusion based on full article report. The study selection stages and results were presented in the PRISMA flow chart (Figure 1).
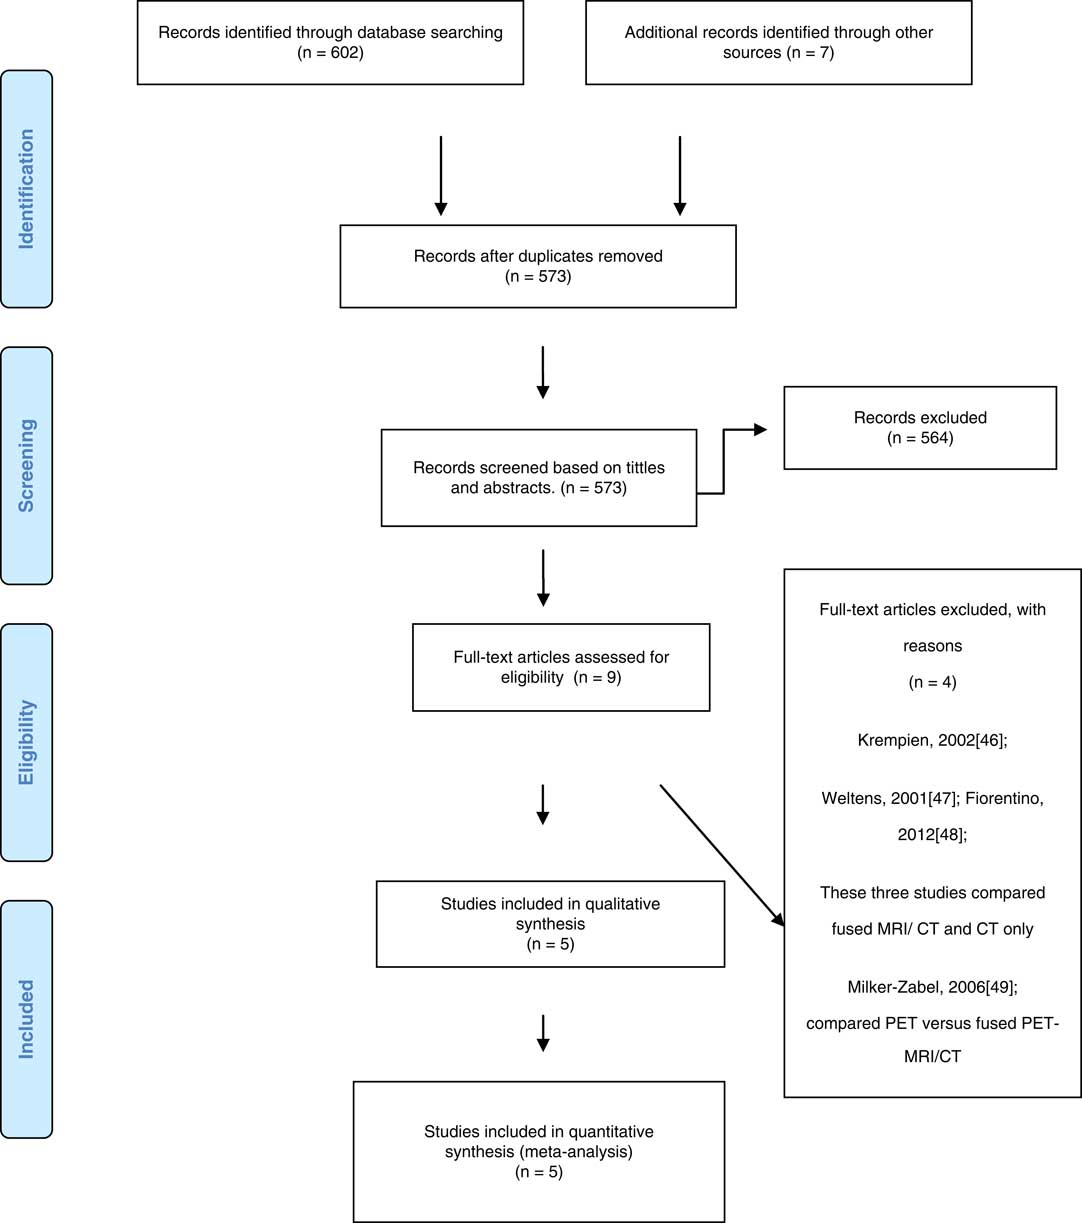
Figure 1 Preferred Reporting Items for Systematic Reviews and Meta-Analysis (PRISMA) 2009 flow diagram.
Five studies with a total number of 72 patients were included in this review. The sample size, mean TV and standard deviation of each of the studies are given in Table 1. Summary of each of the included studies is included in Table 2. The results of the four studiesReference Khoo, Adams and Saran 10 – Reference Datta, David, Gupta and Lal 12 , Reference Kristensen, Laursen, Løgager, Geertsen and Krarup-Hansen 29 revealed that MRI consistently defined larger TV than CT. The percentage mean differences of the included studies are contained in Figure 2. On the basis of the IPD, the only one studyReference Weber, Wang and Albrecht 38 that favoured CT indicated that MRI underestimated the TVs in 90% of cases. The other two studies indicated that MRI identified larger volumes in 54·5Reference Prabhakar, Haresh, Ganesh, Joshi, Julka and Rath 11 and 96%Reference Kristensen, Laursen, Løgager, Geertsen and Krarup-Hansen 29 of cases, respectively. The overall effect estimate was −1·85 (95% CI; −7·24, 10·94), Z=0·40 (p=0·069>0·5) as shown in Figure 3.
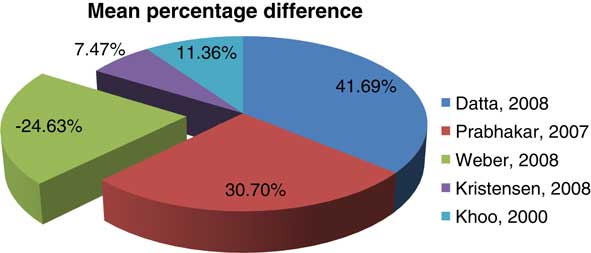
Figure 2 Percentage mean differences of the included studies.

Figure 3 Forest plot: overall estimate. Abbreviations: CT, computed tomography; CI, confidence interval; MRI, magnetic resonance imaging.
Table 1 Sample size and summary statistics of the included studies

Abbreviations: MRI=magnetic resonance imaging; CT=computed tomography.
Table 2 Characteristics of the included studies

Abbreviations: MRI, magnetic resonance imaging; CT, computed tomography; CTV, clinical tumour volume; FOV, field of view; GDC, gradient distortion correction; GTV, gross tumour volume; TE, echo time; TR, repetitive time.
Discussion
A total of five studies (n=72) identified through systematic searches were included in this review. Each of the included studies recruited patients with brain tumours who had both CT and MRI for RTP. The overall estimate of the review showed that MRI when compared with CT, gives larger TV but the difference was not statistically significant. We could not compare this finding with any other study as no systematic review or meta-analytic study was identified on the subject area. However, comparison was done among the included studies.
Four of the studies were in good agreement in favour of MRI-based method, whereas one other study revealed contrasting finding. The four studies revealed that MRI-based method defined larger TV than CT-based method with effects estimates ranging from small to moderate based on Cohen’s interpretation.Reference Cohen 43 In contrast, the other study revealed that CT-based method identified larger volume than MRI in patients with glioblastoma multiforme.Reference Weber, Wang and Albrecht 38
Similarly, detailed evaluation of each of the included studies based on the IPD revealed that in some cases, MRI defined larger volume than CT, whereas in some instances CT defined TVs were larger. This was noted even among the studies where the mean TV appeared larger on MRI. A study by Kristensen et al.Reference Kristensen, Laursen, Løgager, Geertsen and Krarup-Hansen 29 revealed that MRI defined larger TV in 55·5% (n=6) of cases, whereas CT defined TV were larger in the remaining 54·5% (n=5).Reference Kristensen, Laursen, Løgager, Geertsen and Krarup-Hansen 29 Prabhakar et al.Reference Prabhakar, Haresh, Ganesh, Joshi, Julka and Rath 11 reported larger TV in 96% (n=24) of cases on MRI and 4% (n=1) on CT. Similarly, MRI and CT TV were larger in 71·43% (n=5) and 28·57% (n=2) of cases, respectively, in the study of conducted by Khoo et al.Reference Khoo, Adams and Saran 10 In contrast, Weber et al.,Reference Weber, Wang and Albrecht 38 reported larger TV on CT in 90% (n=9) of cases, whereas the remaining 10% (n=1) TVs were larger on MRI.Reference Weber, Wang and Albrecht 38 The variability in effect size across and within the studies could be attributed to slight variation in patients characteristics, intervention design (equipment type and imaging parameters used) as well as the use of small sample size in the included studies.
With regards to the patients’ characteristics, different diagnosis of brain tumours such as glioma, meningioma, glioblastoma pituitary adenoma were reported in different studies. Moreover, there was variation in location and size of the tumours among the patients. It is worthy of note that tumour located adjacent to bony structures would be better demonstrated on MRI as the quality of its image is not compromised due to artefact from the adjacent bony structure. On the other hand, CT gives better information and thus identifies a larger volume than MRI where the tumour has bony component. This is because CT is better than MRI in bone detail demonstration. This could be the possible reason in the variation of the effect sizes within the studies. In addition, HuckReference Huck 50 revealed that effect estimates vary with different set of participants no matter how similar they are with the original population. As different studies used different sets of population, this might also be additional reason for variation in the effect sizes across the studies.
On the part of the intervention design, different studies used CT and MRI scanner from different manufacturers and specification. Some studies used 0·23T, whereas some used 1·5 MRI scanners. Moreover, the use of different imaging protocols/parameters was reported in different studies. These include; slice thickness, kilovoltage and tube current for CT as well as matrix size, Repetition time, slice thickness for the MRI procedure. The use of different imaging parameters and protocols could affect the image quality and thus the outcome in different ways across the studies. This is in accordance with the evidence provided by Stall et al.Reference Stall, Zach and Ning 51 who noted that the TV identified using different MRI protocols would appear differently.
The variability with regards to the effect size within the studies could be due to random error in the outcome measurement. Scientific measurements are not without error either of human nature or from the equipment involved. Moreover, as two imaging modalities are involved and it is nearly impossible to replicate exactly the same patient position on each of the modalities. However, any slight change in patient position might affect the size of the TV. Thus, patient inter-procedure positioning error could also be among the reasons for variation in the effect size within the studies.
Thus, when choosing the best or appropriate method for RTP of brain tumour, the tumour location and characteristics should be considered. In addition, the implication of using the likely best treatment planning option should also be taken into consideration. CT is readily available, cost effective, shorter imaging time relative to MRI and identifies more information where there is bony involvement. However, it involves the use of ionising radiation and thus carries a potential risk. On the other hand, MRI gives more information in cases where the tumour is adjacent to bone, it does not involve ionising radiation and has wide range of imaging protocols. Nevertheless, it is costly and requires the use of longer image acquisition time.
Strength and Limitation of the Evidence
All the studies included were quasi-experimental research and of good quality based on the effective public Health quality assessment tool for quantitative studies. There was excellent control of confounders due to adoption of repeated measure design, where the same group of participants received both CT and MR interventions. However, the quality of the studies varies slightly based on the rigour of approach which with the research design was executed. It was not clear in some studies if some methods have not been used or were omitted from the report. These methods include; blinding of the observers, use of at least two independent observers, time interval between CT and MRI intervention procedures and interval between outcome assessments of different groups. In addition, participants’ demographics, details of the imaging design such as type of the particular imaging modality used, and the imaging parameters as well as distortion correction method were also not reported in detail in some studies. For instance, Khoo et al.Reference Khoo, Adams and Saran 10 was the only study that reported on the participants’ demographics and blinding of the observers with regards to the participants identity and clinical details. In addition, except Khoo et al.Reference Khoo, Adams and Saran 10 who reported an interval of 2 weeks, no study disclosed the interval between TV assessment on CT and MRI modality. This was believed to reduce familiarity of cases and thus bias in the outcome assessment. However, the strength of this study was limited due its small sample size. In the study conducted by Khoo et al.,10 a total of seven participants were involved. This was the least among all the studies in this review. Moreover, Weber et al.Reference Weber, Wang and Albrecht 38 and Datta et al.Reference Datta, David, Gupta and Lal 12 were the only studies who reported interval of 1–2 days between CT and MRI procedure to avoid change in the tumour status due to time. However, it is worthy of note that, omitting a method in a report does not categorically mean it has not been employed during the research. Therefore, these issues should be treated with cautions when interpreting the strength of the evidence of this review.
Furthermore, the review method is associated with some methodological flaws which might introduce bias that could affect the strength of its findings and conclusion. This includes the use of single reviewer in conducting the study selection, quality assessment and data extraction. However, the extent to which biases were introduced was somehow limited as we followed strictly, the pre-determined selection criteria set in the protocol to limit the selection bias. Identification bias was also limited by including large number of sources during the study identification. Standardised data extraction form and quality assessment tool used were also were good method of minimising bias. 41 However, an update of this review is recommended with more rigorous methodological design when more data becomes available.
Conclusion
This study concluded that the TVs measured on MRI-based method for RTP of brain tumours were larger in many instances compared with TVs defined using CT-based method. However, this difference was not statistically significant.
Acknowledgements
The authors are indebted to all academic staff of School of Health University of Bradford, UK, most especially who offered a constructive criticism on this work. Moreover, we appreciate the assistance and corporation of Library staff of the university who helped us in designing and executing the search strategy.
Financial support
This work was extracted from a thesis conducted in partial fulfilment for the award of master’s degree in Imaging in Medicine at University of Bradford, United Kingdom. The Masters programme was sponsored by Tertiary Education Trust Fund, an intervention agency established by Nigerian Federal Government for tertiary education staff development and infrastructures.
Conflicts of Interest
The authors declare no conflicts of interest.


