Introduction
Cancers in the head and neck area are often treated using radiation therapy. This presents certain challenges in sparing adjacent organs from unnecessary irradiation. Intensity-modulated radiation therapy (IMRT) has now replaced conventional radiation therapy and three-dimensional radiation therapy and has become a standard treatment technique for head and neck cancer.Reference Eisbruch, Foote and O’Sullivan 1 This technique provides adequate target coverage while maintaining steep dose gradients at the border between the targets and adjacent normal tissues.Reference Clark, Bidmead and Nutting 2 When first planning the treatment, computed tomography (CT) scan is used. This allows for manual delineation of the tumour and nearby organs to ensure optimal delivery of the radiation. However, significant anatomic changes may occur throughout the entire treatment course. These changes include the shrinkage of the primary disease and metastatic lymph nodes, external contour because of significant weight loss and displacement/size of the normal structures. 3 This can potentially lead to difference between planned and delivered dose. Thus adaptive radiation therapy (ART), a plan modification and implementation according to tumour response and anatomic changes of normal structures, becomes particularly important.Reference Ho, Marchant and Moore 4 , Reference Ahn, Chen and Ahn 5 Nevertheless, this is a very time-consuming process involving several health care professionals. As such, a new treatment plan based on a repeat CT (ReCT) must be implemented when drastic changes in the anatomy are observed. The decision on whether or not to adapt the treatment plan will be based on a cone beam computed tomography (CBCT) scan. This scan is performed in the treatment room, in connection with an on-going treatment. The quality of a CBCT scan is, however, poor compared to that of an ordinary CT. By the use of image analysis, it has been possible to make use of CBCT for adaptation of the treatment plans. Special software can be used to perform image registration between initial CT and CBCT. Based on the set of registered images and structures, the hypothesis is that it should be possible to re-calculate the original treatment plan, and thereby adapt the plan to the newly changed anatomy.
Results from dosimetric studies suggest that the initiation of ART during fractionated IMRT provides various benefits, particularly in preventing overdose to the critical structures. The feasibility of ART in clinical practice, both in online and in offline settings, has been broadly reported in the literature.Reference Elstroem and Grau 6 , Reference Schwartz, Garden and Thomas 7 The purpose of this study is to correct morphological variations by realising one or more plans during the treatment course. CBCT imaging is used to detect these variations, and re-planning on ReCT is done to bring down the organ at risk (OAR) doses.
Objective
The overall aims of this study are:
1. to evaluate the doses to the OARs (parotid, spine and skin) if the initial CT plan continues to the patient during the course of radiotherapy despite weight loss (dosimetric comparison of initial CT plan and initial CT plan calculated on ReCT)
2. to assess the accuracy of CBCT dose calculation in terms of OAR doses (dosimetric comparison of initial CT plan calculated on ReCT and CBCT)
3. to quantify the OAR doses in ReCT plan and compare it with initial CT plan for all five patients (dosimetric comparison of initial CT plan and ReCT plan on the basis of OAR doses).
Materials and Methods
This prospective study includes data from five head and neck cancer patients. Out of the five patients, two were Ca nasopharynx, one was Ca buccal mucosa, one was Ca base of tongue and one was neck node (unknown primary). There were two criteria for patient selection.
Patient selection
1. Patients who were likely to have tumour shrinkage due to response and weight loss at 20th fraction (usually in head and neck patients the weight loss or tumour shrinkage occurs in 4th week of the treatment fraction) in the course of radiotherapyReference Wang, Yang and Hu 8 (Figure 1).
2. Owing to the limited field of view with CBCT, some information is lost on the edges of the CBCT images. This may cause errors in the CBCT-based dose calculation if the delineated structures copied from the planning CT are not included in the CBCT. Therefore, patients whose CT and CBCT were alike were selected for this study to minimise this problem.

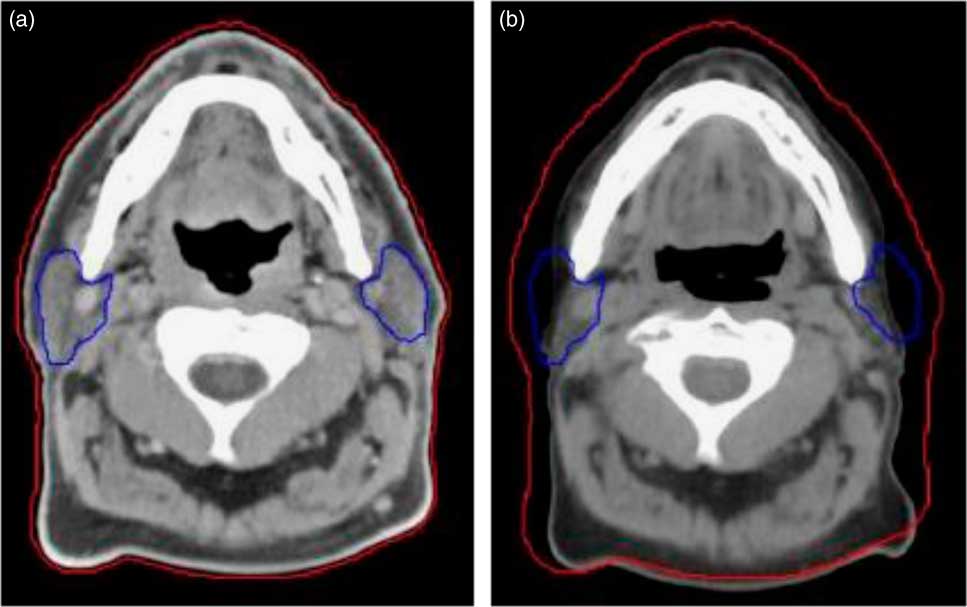
Figure 1 Compared to the planning CT (a), a rescan at 20th fraction (mid-way) through treatment (b) highlights weight loss and changes to the parotids. The external contour is shown by the red line and the parotids by the blue line.
Hounsfield Unit (HU) correction for CBCT
To calculate the daily dose distribution on the CBCT data sets, a calibration of the HU to electron density (ED) is required for inhomogeneity corrections. This was realised with CatPhan® 600 phantom (CatPhan® CTP 600, Phantom Laboratory, Salem, NY, USA). The CatPhan® 600 consists of seven material inserts with a known relative ED (air, PMP, LDPE, water, polystyrene, acrylic, Delrin and Teflon) and was scanned with the standard clinical protocol. 9
The HU for each insert was extracted within a region of interest (ROI) and assigned to the known related relative ED to generate a calibration curve for the treatment planning system (TPS) Eclipse (Varian Medical Systems, v. 11·0, Palo Alto, CA, USA).
To verify which calibration curve is best for dose re-calculation, the HU from the phantoms were compared with the HU values from the CBCT of head and neck patient using ROIs in the areas water, bone, fat and soft tissue.Reference Dunlop, McQuaid and Nill 10
The CT-based dose distribution for planning target volume and OARs are calculated using the measured CT calibration curve for standard head and neck protocol available in TPS Eclipse. The dose distribution on CBCT is calculated using the site-specific calibration curve for head and neck CBCT scan protocol.
All five patients underwent head and neck immobilisation with a thermoplastic masks and initial planning CT simulation with standard protocol. Initially, the target and OARs were delineated and the initial treatment plan was created for all five patients on initial planning CT with nine beams IMRT technique. The prescribed dose for each patient is mentioned in Table 1. All patients were treated with image-guided radiotherapy (IGRT) using on board imager in Varian Trilogy machine. The IGRT protocol for head and neck patients in our centre is alternate day CBCT (thrice a week).
Table 1 Dosimetric comparison of OAR volumes and doses for all five patients in four plans

For each patient, ReCT was taken at 20th fraction (20 #) out of 30/35 fractions of radiotherapy treatment (Table 1). The ReCT image for each patient was registered with the initial planning CT image and CBCT image of 20th fraction individually. The rigid registration of primary CT with ReCT and CBCT was performed automatically and final manual adjustment was used for better alignment. The initial CT scan was marked as the source image and the ReCT or CBCT was set as the target image before the registration. The first part of the registration is performed manually through bone alignment, by moving initial CT to match the ReCT or CBCT.
An automatic rigid registration was used to refine the registration. The recontouring of target and OARs on ReCT and CBCT was undertaken. The initial IMRT treatment plan was transferred to ReCT and CBCT scans and the doses were re-calculated. The dose calculation was performed with present values by the use of fixed monitor units (MU). The initial CT plan was compared dosimetrically with initial CT plan calculated on ReCT and CBCT, and ReCT plan. The re-planning was done on ReCT, and this re-plan was delivered as a modified plan to the patient.
The volumes of the parotid glands were recorded and compared among the scans. The parotids mean doses and spinal cord and skin max doses were compared in all four scans. The mean and SDs were computed for all parameters of OARs in all four plans (initial CT plan, initial CT plan calculated on ReCT, initial CT plan calculated on CBCT and ReCT plan). Intragroup comparisons were made by a two-tailed paired t-test to test the hypothesis that there is a significant difference among the means of two plans (initial plan versus initial plan calculated on ReCT). All statistical tests were evaluated at α=5% level of significance; thus, p-value <0·05 was considered statistically significant.
Results
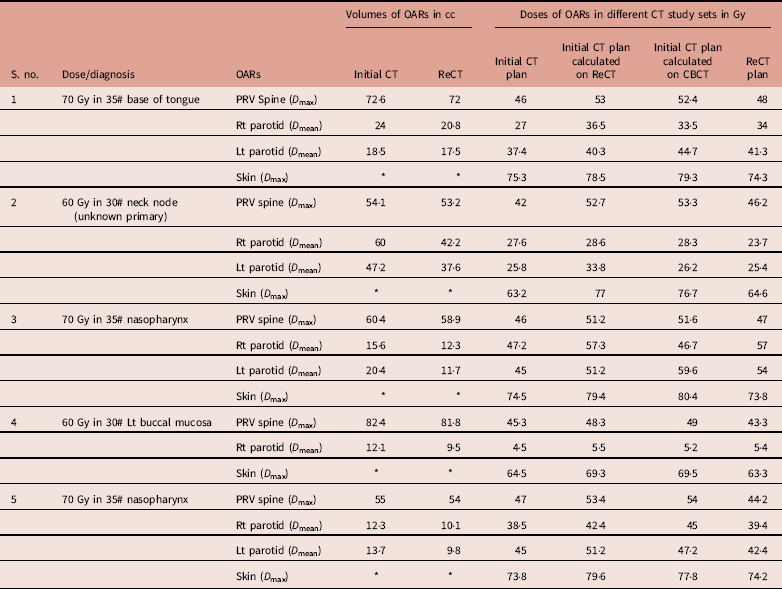
Re-scanning and re-planning at 20th fraction of the treatment shows 27% (13–42%) reduction in parotid volumes (Figure 2), and therefore 21% (7–35%) increase in parotid mean doses. Initial plan calculated on ReCT and CBCT found 15% (9–26%) increase in planning risk volume (PRV) spine maximum doses, which were reduced by re-planning on ReCT. The body maximum doses increased by 6·5% (4–8%) in four patients and 22% in one patient when initial CT plan was calculated on ReCT and CBCT. These results showed a statistically significant difference in the parotids, PRV spine and skin doses with a p-value of 0·01, 0·007 and 0·02, respectively. Figure 3 is the graphical representation of mean doses of parotids and maximum doses of PRV spine and skin in all three plans (initial CT plan, initial plan calculated on ReCT and CBCT).
Figure 2 Parotid volume graphs from initial CT to ReCT in all five patients.
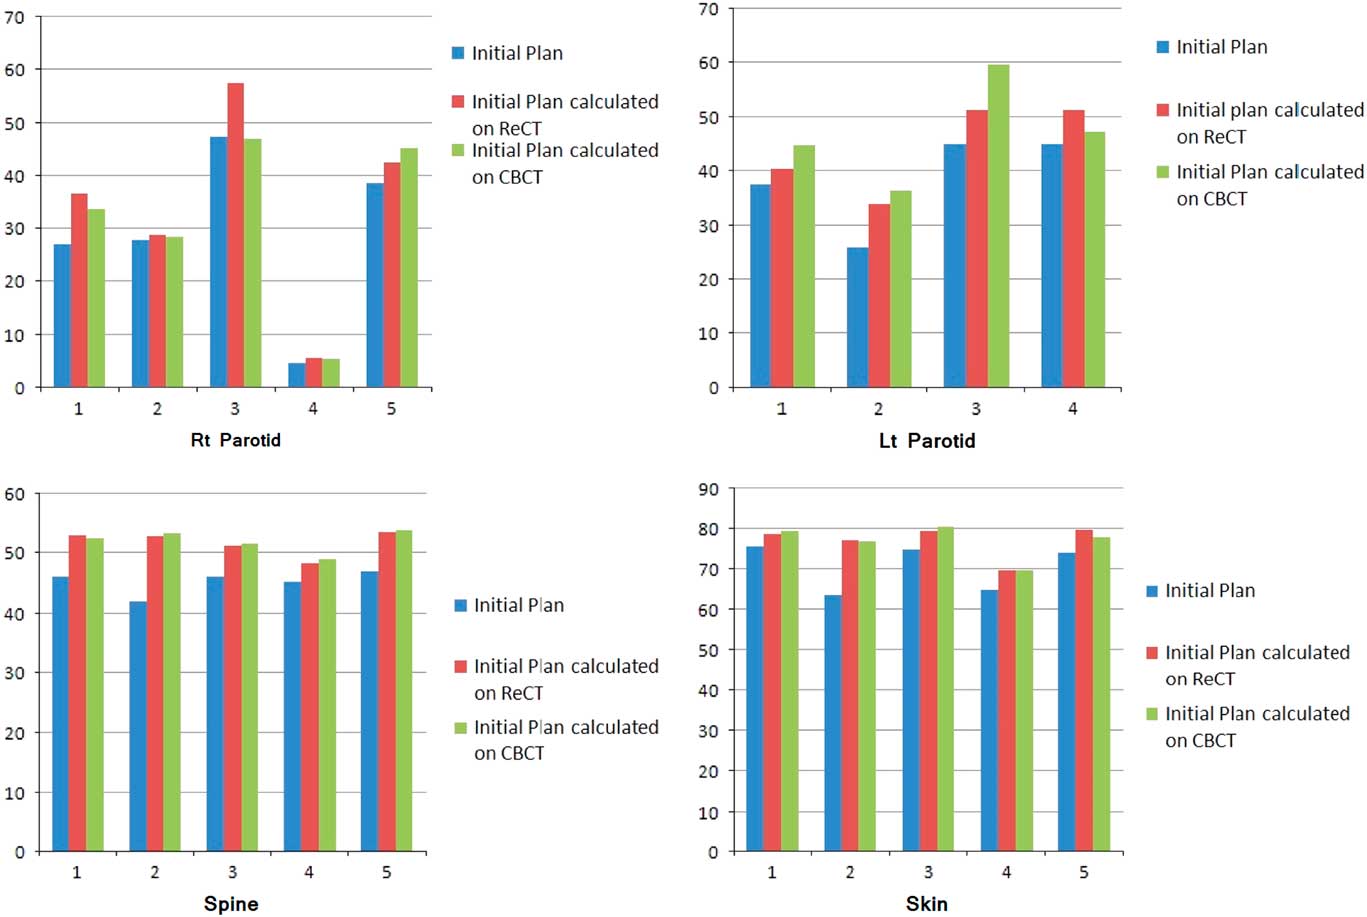
Figure 3 Graphical representation of mean doses of parotids and maximum doses of PRV spine and skin in all three plans of five patients.
Discussion
The most important large salivary glands, parotid glands, secrete 60–65% of total saliva volume. After exposure to a high dose of irradiation, the secretary function of the parotid gland is impaired and saliva secretion decreases. Xerostomia thus becomes the main complication in head and neck cancer patients who have received radiation therapy.Reference Franzen, Funegard, Ericson and Henriksson 11 The volume reduction of parotid gland during the course of radiotherapy for head and neck cancers has been reported by many studies. Wang et al. documented a volume reduction of 20·6 and 19·8% of left and right parotid glands, respectively, of nasopharynx patients at midtreatment,Reference Wang, Yan and Zhang 12 while Hansen et al. indicated a volume reduction of 21·5 and 15·6% in the left and right parotid glands, respectively, during radiotherapy for patients with head and neck cancers.Reference Hansen, Bucci, Quivey, Weinberg and Xia 13 Barker et al. found that the median parotid volume loss was 28·1%.Reference Barker, Garden and Ang 14 In the present study, we showed the mean volume shrinkage of 22 and 20·0% for right and left parotids, respectively, at 20th fraction. The more the volume shrinkage of the gland was observed, the higher the radiation dose of the parotid gland received. Robar et al. and Wang et al. recognised that the lateral border of both parotid glands contracted medially which resulted in an increased mean parotid dose.Reference Robar, Day and Clancey 15 Robar et al. also found that the D mean of left and right parotids increased by 2·6 and 0·3%,Reference Robar, Day and Clancey 15 whereas the results from Wang et al. were 7·0 and 8·3%, respectively.Reference Wang, Yan and Zhang 12 The present study showed that the D mean of the right and left parotids increased by 25 and 18% after 20 fractions of treatment, respectively.
Our results show that the dose to the critical OARs of some patients will exceed the respective tolerance dose if the same treatment is continued. Therefore, repeat imaging and re-planning needs to be done to benefit the patients by avoid overdosing the OARs in case of anatomic changes.
The adaptive treatment can be used to compensate for the underdosage or overdosage of target volumes and OARs (Woodford et al., 2007).Reference Woodford, Yartsev, Dar, Bauman and Dyk 16 Without daily or weekly CBCT/CT images and the subsequent registration process, it is impossible to predict the actual dose delivered to specific points in both target volumes and OARs accurately. Consequently, in our study, it is a conservative simulation to use the dosimetric data from the hybrid techniques to determine the need for re-planning. Moreover, the use of dosimetric indices from the dose–volume histogram (DVH) curve to describe the dose and coverage to the target volumes and OARs may not be adequate. The DVH does not provide geometric information on underdosage or overdosage of target volumes, but is still an effective tool to analyse the need for re-planning.
ART uses imaging information during fractionated treatment to re-optimise the treatment plan and thereby deal with treatment variations such as geometric errors caused by organs motion or anatomic changes due to weight loss. The content of ART is dynamic and becomes sophisticated with the advancement of the feedback techniques during treatment delivery. With the advancement of the on-board volumetric imaging in the field of radiation oncology, the ART becomes more clinically meaningful. The volumetric imaging provides patient’s on-treatment geometric information upon which adaptive re-planning can be performed to adjust for any anatomic and dosimetric changes of both target volumes and OARs. The definition of ART could be extended to the idea of offline corrections and be aimed at reducing all systematic discrepancies between treatment planning and treatment delivery.Reference Yan, Lockman, Brabbins, Tyburski and Martinez 17 With the emergence of CBCT, the ART has significantly changed. The updated on-treatment geometric model of a patient can be built during treatment. The spatial dose distribution can accommodate any change of patient’s anatomy and dosimetric deviation from the prescription incurred in the planned dose.
Conclusion
ART involves the modification of the initial plan to account for patient-specific anatomical changes (re-plan). Re-planning on ReCT in head and neck patients during the course of radiotherapy is an ultimate solution with regard to doses of spinal cord, parotid glands and skin. However, many questions remain unanswered: Who would benefit most for ART? What is the optimal timing and frequency to perform ART? Whether ART re-planning can transfer into clinical benefits? Mature outcomes from basic and clinical researches will be necessary to appropriately mould ART into a future treatment standard.
Acknowledgement
Nil.