


Introduction
A better local tumour control is achieved with dose escalation in prostate radiotherapy as shown in two recent meta-analyses.Reference Viani, Stefano and Afonso 1 , Reference Zaorsk, Palmer, Hurwitz, Keith, Dicker and Den 2 Intensity-modulated radiation therapy (IMRT) represents the technique of choice for this dose escalation since it allows a better conformity of dose distribution to target volume while avoiding irradiation of normal adjacent organs which may preserve quality of life of treated patients. However, using IMRT technique need requires accurate quality control to ensure the safety and efficacy of treatment. IMRT is delivered by linear accelerators (linacs) with multileaf collimators (MLC) according to different techniques, one of the most commonly used modes is sliding window (SW). The SW is a mode that delivers dose from multiple fixed beams. For each beam, the MLC move to project modulated fluence at the isocenter.
Electronic portal imaging device (EPID) is a two-dimensional (2D) detector attached to the linacs able to ensure the quality control of the treatment.Reference Herman, Balter and Jaffray 3 – Reference Moran, Dempsey and Eisbruch 7
The aim of this study is to evaluate the efficacy and safety of routine use of EPID for set-up and dosimetry in IMRT for localised prostate cancer.
Materials and Methods
This is a retrospective study including the treatment plans of 20 patients who underwent radiotherapy using an IMRT technique for localised prostate cancer.
For treatment planning, all patients had a computed tomography (CT) in the supine position with knee rest and ankle stocks immobilisation system to ensure reproducibility of position during all phases of radiation treatment. Patients are instructed to have a comfortably full bladder and to have emptied their rectum, during CT simulation and treatment sessions.
An aSi-based EPID (aS500, Varian Medical Systems, Palo Alto, CA, USA) with a sensitive area of the panel of 512×384 pixels and a pixel size of 0·784 mm was available for patient set-up verification on clinac IX linacs (Varian Medical Systems) and portal dose image prediction (PDIP) software in Eclipse treatment planning system (TPS) for portal dosimetry.
The planning target volume (PTV) corresponds to the clinical target volume (CTV) with an additional margin of 1 cm in all directions except in the posterior one where the margin was reduced to 5 mm to preserve the rectal wall. The prescribed dose to the PTV was 78 Gy in 38 fractions. We treated all patients using five static IMRT fields using 18 MV energy. Dose computation was performed using anisotropic analytical algorithm (AAA) at a grid size of 0·25×0·25×0·25 cm.
Pretreatment verification
In our department, when we started IMRT, our standard for the pretreatment quality control was the ionisation chamber for absolute dose measurement and a 2D ionisation chamber array for 2D relative dose.Reference Jursinic and Nelms 8 , Reference Poppe, Blechschmidt and Djouguela 9
But in view of the increase in the use of the IMRT technique in clinical routine, the pretreatment quality control with this method has become very time consuming. Therefore, we have reconfigured the method based on the EPID coupled with PDIP. This method has been analysed and evaluated against 2D array.
For each IMRT plan, a portal dose verification plan (PV) was created in Eclipse TPS using portal dose prediction algorithm. In PV, a dose distribution at the position of EPID kept at source-to-detector distance of 100 cm was predicted per field without any patient. This same fluence was subsequently exposed onto the EPID, available on a clinic IX linacs under the same geometry.
The measured fluence was then compared with the corresponding predicted fluence in Eclipse TPS using the portal dosimetry software. To evaluate the IMRT quality assurance we used the gamma (γ) evaluation method proposed by Low et al.Reference Low, Harms, Mutic and Purdy 10 The reference gamma index value was set at 3% dose agreement within 3 mm distance-to-agreement.
All 100 IMRT fields were analysed and for each field three parameters were evaluated: gamma maximum (γ max), gamma average (γ avg) and percentage of the field area with all pixels having at most gamma value 1 (γ %≤1). The mean and standard deviation for all the γ parameters were calculated. The use of portal dosimetry software allows visualising the area of the field which has γ values >1.
Portal imaging
After the planning phase, the patient must be correctly positioned using skin markers and room lasers. For patient set-up verification, portal images are acquired at orthogonal gantry angles 0° and 90° using a typical exposure of 1 monitor unit (MU) and 6-MV X-rays.
These portal images are online compared with corresponding digital reconstructed radiography from simulation CT by matching bony structures.
We selected the first five treatment sessions to evaluate the set-up errors along the three directions (lateral, longitudinal and vertical). Note that the first session was not considered in our study to avoid additional errors related to the patient’s stress during this session. Mean displacements, population systematic ∑ which is represented by the standard deviation from the values of means displacement for all individual patients and random errors σ which is expressed by the root mean square of standard deviation of all patients were calculated. The set-up margins (M) were calculated using Van Herck formula (M=2·5∑+0·7σ).Reference Van Herk, Remeijer and Rasch 11 , Reference Van Herk 12 This equation incorporates a differential effect between random and systematic errors on dose distribution.
Imaging dose
Using EPID in the daily control of the patient’s position delivers an additional radiation dose which should be evaluated. This dose was calculated using the Eclipse TPS.
For each positioning field, a plan was created with the same geometric and dosimetric parameters and was calculated with a fixed 1 MU and a fraction number equal to the number of images acquired throughout the treatment. The adding of imaging dose to therapeutic one gives us a real dose distribution.
The differences of maximum dose to the patient and isodose distribution were checked.
Results
Pretreatment verification
For all 100 fields, the predicted and the measured planar dose distribution agrees well with mean±standard deviation value for γ max=2·31±0·57, γ avg=0·36±0·07 and γ %≤1=98·43%±0·71%, respectively.
Figure 1 shows a scatter plot of γ max, γ avg and γ %≤1 for the all evaluated fields. Fourteen per cent of the fields had one or more parameters than 1 SD from the mean and 5% had one or more parameters >2 SD from the mean.

Figure 1 Scatter plot of γ max (a), γ avg (b) and γ %≤1 (c) for each field evaluated in this study.
The check the area of the field which has γ values >1 for all the fields shows that this area was confined to a high-dose gradient region and penumbra.
Portal imaging
The mean total errors with 1 SD in the lateral, longitudinal and vertical directions were 0·11±0·44 cm, 0·02±0·37 cm and −0·02±0·21 cm, respectively. In this study, it was found that the frequency of patient set-up error to be <5 mm were 75, 85 and 99% in lateral, longitudinal and vertical directions, respectively. The frequency of patient set-up error more than 7 mm in lateral, longitudinal and vertical directions were 9, 5 and 0% of errors, respectively.
Figure 2 gives the mean with 1 SD in set-up errors for each patient in all three directions.

Figure 2 Mean with error bars showing 1 SD of individual patient set-up error along lateral (a), longitudinal (b) and vertical (c) directions for 20 patients of prostate cancers.
The mean displacements, systematic and random errors along the three axes are given in Table 1.
Table 1 Mean displacements, set-up errors and margins along three axes

Imaging dose
The mean number of portal images taken per patient was 54 (32–67). The repeated imaging using EPID through several fractions during the treatment and the inclusion of larger volumes of normal structures raises the dose delivered to the patient. The maximum dose and the dose at isocentre have been estimated as 1 cGy per image. The difference between the dose at reference point with and without taking into account the imaging dose was 0·56 Gy which represented 0·75% of prescribed dose.Reference Bahadur, Naseem and Fawzy 13
Figure 3 shows the difference between the distribution dose with and without adding imaging dose. The area covered by the prescribed dose includes more volume of critical organs.
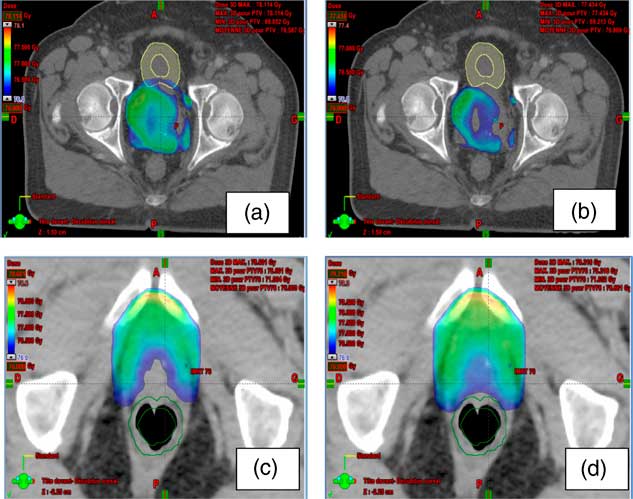
Figure 3 The difference between the distribution dose with and without adding imaging dose. (a, b) The area covered by the prescribed dose in the bladder with and without imaging dose, respectively; (c, d) the area covered by the prescribed dose in the rectum with and without imaging dose, respectively.
Discussion
Pretreatment verification
IMRT is a complex technique which is characterised by the variation of the fluence across the field. The implementation of this technique in clinic requires verification not only of the dose delivered to one reference point but also of its spatial distribution. For this purpose, several tools and methods have been described in the literature.Reference Alber, Broggi and Wagter 14 , Reference Varatharaj, Moretti, Ravikumar, Malisan, Supe and Padovani 15 Several years ago, the standard for pretreatment verification of relative dose distribution for IMRT was the radiographic film. The development of new 2D electronic detector offers quick and easy handling encouraged many centres to implement these tools into routine clinical practice. The 2D arrays is a suitable and precise quality assurance device for complex modulated fields. Also the use of an EPID coupled with the PDIP algorithm had developed a lot of interest in the last few years. In fact, with these two cited 2D detectors we can obtain a good response for IMRT patient quality assurance.Reference Sharma, Mhatre and Heigrujam 16 The advantages of EPID are the fact that we need neither a PC connection nor a phantom for measurements, proving less time consuming of machine and personnel. The use of the EPID is more practical, especially with the increase in the number of patients treated using an IMRT technique. The results of our study with the EPID are consistent with those published by Howel et al.Reference Howell, Smith and Jarrio 17 who reported mean±SD values of 2·3±0·7 for γ max, 0·27±0·1 for γ avg and 98·4%±2·7% for γ %≤1 in their prostate cancer. Sharma et al.Reference Sharma, Mhatre and Heigrujam 16 reported overall mean±SD values of 2·02±0·66 for γ max, 0·24±0·04 for γ avg and 99·43%±0·68% for γ%≤1.
Based on our results of γ values and regarding to the results of various clinical sites, we fixed action level: the γ values of the all fields in an IMRT plan were not exceeding the 2 SD of our mean values. When this action level was not respected, we then undertake an additional check with the 2D array.
Portal imaging
The successful planning of radiotherapy requires a precise definition of PTV. Indeed, the additional margin in relation to the CTV to define the PTV takes into consideration both the risk of internal movement and positioning errors. Although the internal risk is not changeable, the reduction of safety margins is possible by minimising the risk of positioning errors. This reduction is necessary to minimise the dose delivered to the surrounding normal tissues. To determine these set-up errors, the British Institute of Radiology (BIR) recommended to use data from at least 20 patients.Reference Party 18 McGarry et al.Reference McGarry, Cosgrove, Fleming, O’Sullivan and Hounsell 19 reported in their 2009 study a margin from CTV to PTV to take into account the positioning errors of 10·1 mm lateral, 13·1 mm antero-posterior and 13·1 mm superior–inferior direction. These results were consistent with those published by Enmark et al.Reference Enmark, Korreman and Nyström 20 which registers margins of 8·1 mm in lateral, 13·4 mm in antero-posterior and 15·8 mm in cranio-caudal direction. Using bony anatomy displacement, Osei et al.Reference Osei, Jiang, Barnett, Fleming and Panjwani 21 found a mean systematic error ∑ of −0·1 mm in lateral, −0·8 mm in longitudinal and 1·2 mm in vertical direction. The random error σ was 1·3 mm in lateral, 1·3 mm in longitudinal and 1·6 mm in vertical direction. The results of our study were consistent with these results. In view of these results, we decided not to modify our proposed margins of 1 cm in all direction and 5 mm in posterior oneReference De Crevoisier, Pommier, Latorzeff, Chapet, Chauvet and Hennequin 22 especially as the cranio-caudal margins mainly take into account the internal movements associated with bladder and rectal filling. Otherwise, several studies show that the margin around the CTV depends on the set-up errors and the intra-fractional motion of the prostate and this margin can be safely reduced by using the image-guided radiation therapy.Reference Goyal and Kataria 23
Imaging dose
The repetition of portal imaging allows a reduction of set-up errors but it generates in return an excess of dose which should be evaluated. The old model of EPID as500 allows the realisation of positioning images with 3–4 MU for the standard mode and with 7–9 MU for the high-quality mode. The development of this device and the introduction of a new low-dose mode allow an excellent image acquisition with <1 MU which facilitates the periodic patient set-up verification.Reference Vetterli, Riem and Aebersold 24 , Reference Reilly 25 In our study, the additional dose due to portal imaging repetition was estimated at 0·56 Gy at the reference point which represented 0·75% of prescribed dose.Reference Bahadur, Naseem and Fawzy 13 According to these results, the increase of dose with the MV portal imaging was not significant but we have to be prudent when the doses at critical organs were nearing their dose limit, this additional dose could potentially induce unwanted secondary effects. Therefore, the daily patient positioning has to be undertaken accurately and carefully using the skin markers and lasers to reduce the number of MV portal images.
Conclusion
IMRT technique for localised prostate cancer improves local control by facilitating dose escalation to the target volume without increasing the dose to surrounding normal tissue. The success of this radiotherapy technique is highly dependent upon the accuracy of the delivered treatment which can be divided into geometric and dosimetric verification. EPID is a useful tool to verify the dose distribution before patient treatment and to assess the correct field position. The methods used and the results found may encourage departments in developing countries to implement IMRT and benefit from its clinical contribution.
Acknowledgements
None.


