


Introduction
In radiation therapy, high-energy photon beams generated by medical linear accelerators are used for the treatment of many tumour types. Since the dose builds up to a maximum at a given depth below the surface, photon beams have a skin-sparing effect that depends on many factors such as beam energy, field size, source surface distance (SSD), angle of incidence and beam modification devices.Reference Butson, Cheung, Yu and Metcalfe1 Therefore, different types of conventional bolus can be used to increase the dose distribution in build-up region and to reduce the recurrence risk of superficial tumours. Currently, due to the limited malleability and flat form of commercial bolus, it is difficult to achieve a perfect contact with the patient’s irregular surfaces, such as the nose, ears and scalp.Reference Park and Yea2 As a result, small air-gaps between the bolus and the skin are often formed, causing a further disruption of the dose distribution. Previous papersReference Butson, Cheung, Yu and Metcalfe1,Reference Boman, Ojala, Rossi and Kapanen3–Reference Shaw6 have investigated the effect of an air-gap under a bolus on the surface dose using experimental measurements and Monte Carlo calculation. Unfortunately, accurate measurement of dose at the surface and in the build-up region is a difficult task involving a specific type of dosimeters and procedures.Reference Abdel-Rahman, Seuntjens, Verhaegen, Deblois and Podgorsak7–Reference Gerbi and Khan12 However, applying a bolus over phantom surface reduces or removes build-up region and enhances the accuracy of a measurement obtained using an ordinary ionisation chamber available in the clinical environment for radiation dosimetry and quality assurance measurements. The impact of air-gaps under a bolus on the dose distribution is one of the major challenges in photon beam external radiation therapy, but it is nevertheless essential for proper treatment patient. The percent depth doses (PDDs) examined according to the bolus-surface distance in the build-up regionReference Sroka, Reguła and Lobodziec13 have shown a negligible influence when the bolus-surface gap equals 25 cm for 6 MV. In fact, most of the bolus-surface gaps are less thick in clinical situations and could influence the overall dose distribution. Another issue is that the gaps may affect the off-field areas, whereas no previous studies have been published on quantifying the effect of air-gaps under bolus in this region. Therefore, we believe that it is interesting to quantify the effect of air-gaps not only under the bolus region but also on the global dose distribution in the irradiated field and its surrounding areas.
This paper is organised as follows. First, evaluating the depth of maximum dose (R100) and dose value at surface (Ds) as a function of bolus thickness for five square field sizes. Second, investigating the effects of bolus-surface gaps on dose distribution; different comparison modes are used to evaluate the dose distribution with and without the presence of an air-gap under the bolus. Finally, the evaluation of uncertainties has been included and detailed following the literature as closely as possible.Reference Castro, García-Vicente and Mínguez14–Reference Mitch, DeWerd, Minniti, Williamson, Rogers and Cygler20
Materials and Methods
Measurements were performed using the Varian Clinac 2100C (Varian Oncology Systems, Palo Alto, CA, USA) medical linear accelerator commissioned at the Unit of Radiotherapy, Oujda, Morocco. The linac has multileaf collimators of 1 cm width at the isocentre. It delivers a flattened 6 MV X-ray energy at a dose rate of 400 MU/min. The corresponding beam quality (Tissue Phantom Ration TPR20,10) is 0·665. Data acquisition was performed with 31021 Semiflex 3D chamber (PTW Freiburg, Freiburg, Germany) used for high-energy photon fields in absolute and relative dosimetry. It is a waterproof cylindrical chamber, with 0·07 cm3 nominal sensitive volume, 4·8 mm active length and 2·4 mm radius. The reference point is on the chamber’s axe at 3·45 mm from chamber tip. The measurements were carried out into the water phantom (PTW BEAM SCAN) equipped with water detector. MEPHYSTO software was used for data acquisition and analysis.
Depth of maximum dose in terms of bolus thickness
The measurements were performed along the central axis with square open field sizes of 50 mm × 50 mm, 100 mm × 100 mm, 150 mm × 150 mm, 200 mm × 200 mm and 250 mm × 250 mm at a constant source-to-surface distance of 1000 mm. The PDDs are taken from 0 to 300 mm depth with a scanning resolution of 0·5 mm in build-up region, and all curves are normalised to their own maximum value. A water bolus was constructed through an automatic increase of the water level above detector’s origin by a distance corresponding to the desired thickness. The same configuration was maintained while keeping the origin of the detector at the defined surface without bolus, after each water addition of 2 mm thickness. The depth of maximum doses (R100) and dose value at surface (Ds) were calculated by analysing measured scans with the MEPHYSTO software.
Quantify the air-gap effect on dose distribution
A 300 × 300 × 10 mm3 (±0·1 mm tolerance of plate thickness) water-equivalent white polystyrene RW3 (Goettingen White Water) was used to study the effects of bolus-surface air-gaps on dose distribution (see Figure 1). This bolus is composed of polystyrene (C8H8) with admixture of (2·1 ± 0·2) % TiO2. The mass density, the (Z/A) value and the electron density were 1·045 g.cm−3, 0·536 and 3·386 × 1023 e/g, respectively. The slab was upheld by four spacer settled posts, and the air-gaps between the bolus and the phantom surface were created by varying the water level (water draining); the air-gaps studied are ranging from 0 to 30 mm by (5·0 ± 0·5) mm steps. Setting up the source-to-surface water distance to 1000 mm is necessary before carrying out new measurements. Material equivalence means that the absorption and scatter attributes with respect to photons and electrons must be the equivalent in the two materials.
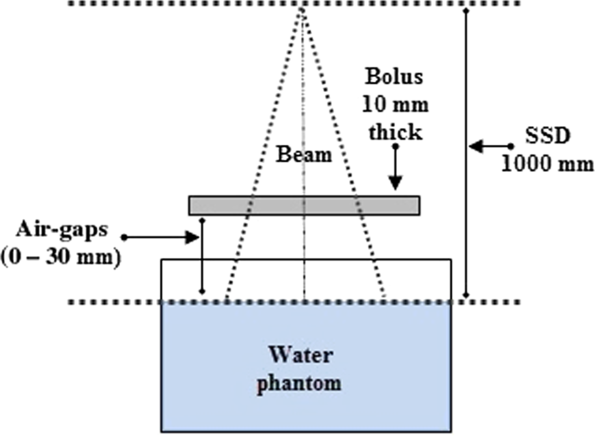
Figure 1. Experimental set-up used to quantify the air-gap effect on dose distribution using a slab and a water tank.
For each bolus-surface gaps, the profiles were measured for a field size of 100 mm × 100 mm at several depths: 0, 5, 15, 50, 100, 200 and 300 mm. The PDDs were taken in a range from 0 to 300 mm depth in the same set-up. The scan resolution is 0·5 mm in build-up and penumbra regions. Afterwards, all scanned curves were smoothed by means of a weighted three-point algorithm implemented in MEPHYSTO software. Finally, all profiles have been symmetrised.
Comparison modes
To show the impact of the air-gaps on dose distribution, comparisons are made between the reference distribution (without air-gap) and those with air-gaps. In order to build a robust analysis, the following methods were used: ‘Local Percentage Difference’ method [Equation (1)], ‘Difference in percentage of Normalization value in reference matrix’ method [Equation (2)] and ‘2D Gamma index’ method [Equations (3) and (4)]. The last method is based on the theoretical concept of Low et al., Reference Low, Harms, Mutic and Purdy21 and the enhanced criteria (second and third pass) elaborated by Depuydt et al. Reference Depuydt, Van Esch and Huyskens22 were included to VeriSoft in MEPHYSTO software.
 $$Local\_Diff\left( \% \right) = {\rm{ }}{{V\left( {i,j} \right) - R\left( {i,j} \right)} \over {R\left( {i,j} \right)}} \times 100\;$$
 $$\;DoN\left( \% \right) = {\rm{ }}{{V\left( {i,j} \right) - R\left( {i,j} \right)} \over {R\left( {{i_0},{j_0}} \right)}} \times 100\;$$
where: V(i, j) is the value at the point (i, j) of the compared matrix, R(i, j) is the value at the point (i, j) of the reference matrix and R(i 0, j 0) is the normalisation value (i 0, j 0) at the maximum point of the reference matrix.
 $$\gamma \left( {{r_r}} \right) = min\left\{ {\Gamma \left( {{r_r},{r_c}} \right)} \right\}\;\;\;\;\;\;\;\forall \left\{ {{r_c}} \right\}$$
 $$\Gamma \left( {{r_r},{r_c}} \right) = {\rm{ }}\sqrt {{{{{\left( {{r_c} - {r_r}} \right)}^2}} \over {\Delta {d_M}^2}} + {\rm{ }}{{{{\left( {{D_c}\left( {{r_c}} \right) - {D_r}\left( {{r_r}} \right)} \right)}^2}} \over {\Delta {D_M}^2}}} $$
where (rc – rr) is the distance between the reference and compared point, (Dc(rc) – Dr(rr)) is the dose difference at the position rc relative to the reference dose Dr in rr, ΔdM represents the distance to agreement and ΔDM is the dose difference tolerance.
To carry out this study, the following passing criteria were adopted for the comparison modes.
- Passing criteria: Local_Diff (%) ≤ 1% and 2%, respectively.
- Passing criteria: DoN(%) ≤ 1% and 2, respectively.
- Passing criteria: γ(rr) ≤ 1.
Uncertainties
Uncertainties of measurements are expressed as relative standard uncertainties and their evaluation is classified into A and B types. In this study, the following components of uncertainty have been evaluated. The SSD was determined with a maximum variation limit of 1·25 mm. Associated with a Gaussian distribution, we estimate an uncertainty value of 0·42 mm. The inverse-square law yields a relative dose uncertainty of 0·09% for a typical 1000 mm SSD machine. For chamber positioning, the maximum limits of 0·5 mm were considered, assuming a rectangular distribution and the gradient of the normalised PDD curve at the reference point in water is 0·36% per mm and an uncertainty of 0·29 mm leads to a relative dose uncertainty of 0·10% at the reference point. A value of around 1% per 10 mm change in field size is considered, then 2 mm accepted when verifying field size in both dimensions results in a relative dose uncertainty of 0·12% with assumption of rectangular distribution. The uncertainties associated with the temperature and the pressure are estimated for calibrated thermometer and barometer. The resolutions of measuring devices are 0·1 °C and 0·1 kPa, respectively. Assuming a rectangular distribution, we estimated an uncertainty value of 0·06 °C and 0·06 kPa. According to the calibration certificate, the associated uncertainties are 0·3 °C and 0·2 kPa, respectively. For the measurement reproducibility, a statistical set of ten consecutive readings has been considered to calculate the mean of standard deviation of the obtained measurements.
In addition, we assume that all components are uncorrelated and the effects of recombination, polarity, humidity, display resolution, zero and linearity of the electrometer, leakage, Linac stability, and the size precision of air-gaps are not taken into account.
Results
Figure 2a shows the PDDs shifting in terms of the bolus thickness for a 100 mm × 100 mm field size. As the bolus thickness increases, the PDD’s built-up region size decreases. In addition, Figure 2b illustrates the measured data points of R100 and Ds for 100 mm ×100 mm field size in terms of bolus thickness. The linear function is considered more suitable for adjusting R100. The logistical function defined in Equation (5) was used to adjust the data points of Ds versus bolus thickness. The fitted coefficients for our measured data for five square field sizes are shown below in Table 1. Adjusted R-square is also given as a sign of the quality of fit. Note that these functions have been applied until 14 mm bolus thickness, the R100 is 0 and Ds is 100% outside this threshold.
 $$y = {\rm{ }}{{{A_1} - {A_2}} \over {1 + {\rm{ }}{{\left( {{x \over {{x_0}}}} \right)}^p}}} + {A_2}$$
where the variable x represents the bolus thickness, the constants A1, A2, x 0 and p correspond to the curve’s minimum value, maximum value, midpoint and power, respectively.

Figure 2. (a) PDD curves normalised at their own maximums for different bolus thicknesses measured into a water phantom. (b) Measured data points of R100 and Ds as a function of bolus thickness, the data points of R100 and Ds are fitted with linear function and logistic function, respectively. 6 MV photon beam and 100 mm × 100 mm field size.
Table 1. Fitting coefficients (and standard errors) obtained for linear (logistic) function applied to R100 (Ds) variation as a function of bolus thicknesses

Notes: Square field sizes ranging from 50 mm × 50 mm to 250 mm × 250 mm for a 6 MV photon beam.
The degradation of the beam profiles at surface and at 5 mm depth shown in Figures 3a and 3b, respectively, illustrates the effect of air-gaps, between the bolus and the phantom surface on dose distribution. As the air-gap is expanded, the profiles turn out more rounded. The air-gaps effect is more dominant at the surface compared to 5 mm depth. By using the definition of penumbra as distance between 80 and 20% isodose levels, the measured penumbra is ranged from (4·72 mm, gap 0 mm) to (14·22 mm, gap 30 mm) and from (4·72 mm, gap 0 mm) to (5·64 mm, gap 30 mm) at the surface and at 5 mm depth, respectively.

Figure 3. Profiles shape variation in terms of air-gap thickness for 6 MV beams, 10 × 10 field size and a 10 mm bolus thickness. The curves are normalised to their own central dose value. Measured data at (a) phantom’s surface and at (b) 5 mm depth.
The comparison modes are used to evaluate the difference between the reference distribution (without air-gap) and those measured including air-gaps. Figure 4 shows gamma 2D index and passed points distributions for 100 mm × 100 mm field size with 30 mm of out-of-field and depth in range from 0 to 300 mm. As presented in Figure 4a, red areas corresponding to gamma value greater than or equal to 1·5 observed in the gamma index distribution particularly outside the radiation field borders. In addition, we can also observe that the distribution of gamma 2D index turns red inside the irradiated field and located near the surface in off-field, when the size of the air-gap increases as shown in Figures 4a, 4c and 4e. Figures 4b, 4d and 4f show the location of failed points illustrating the cold and hot regions. Therefore, we conducted an investigation to characterise the effects of air-gaps on dose distribution. Table 2 outlines statistics of all the comparison modes used to quantify air-gaps effect. Thereafter, possible clinical implications will be discussed below depending on air-gaps effect.

Figure 4. The gamma 2D index (a, c and e) and failed points (b, d and f) calculated by comparison between reference dose distribution and those with air-gaps. For a 6 MV beam, 100 mm × 100 mm field size with 30 mm of out-of-field and 10 mm bolus thickness. Acceptance criteria were defined to be ΔdM = 2 mm and ΔDM = 2%.
Table 2. Statistics of the gamma 2D index, the Local_Diff (%) and the DoN (%) obtained from comparison between reference dose distribution and those with air-gaps 5, 10, 15, 20, 25 and 30 mm, respectively

Notes: For field size of 100 mm × 100 mm including 30 mm off-field and depth in range (0–300 mm)
* Pass criteria: 1 for gamma 2D index, 1% on the left and 2% on the right for Local%Diff and DoN (%)
Table 3 summarises the values of the various quantities considered for absorbed dose to water under reference conditions, and the total relative standard uncertainty was obtained by quadratic combination.
Table 3. Uncertainty budget for dose measurement

Notes: All values are given as relative standard uncertainties.
a The relative uncertainty in the 60Co ND, W coefficient is the value given by PTW-Freiburg.
b The relative uncertainty value is the value quoted in Ref. [Reference McEwen, DeWerd and Ibbott19].
Discussion
Bolus material is frequently placed on a patient’s skin during radiotherapy to reduce or remove build-up effect of photon beams. In clinical cases, a defined bolus thickness should enhance the treatment quality for efficient clinical usage. The fitted curves of measured R100 data versus bolus thickness, for square fields, allow to the clinical planner an accurate definition of R100 (Figure 2b and Table 1). Our detector overestimates doses in the surface and in the first 2 mm of build-up region, compared to other detector devices in the literature. Reference Gerbi and Khan12,Reference Akbas, Donmez Kesen, Koksal and Bilge23 Consequently, an overestimate factor has to be considered when using the obtained data of Ds (Figure 2b and Table 1). Furthermore, the linear behaviour of R100 makes the choice of bolus thickness more convenient in terms of the field size, and the presented model of Ds provides a clinical interest, particularly for the evaluation of skin complications. Reference Bahhous, Zerfaoui and El Khayati24,Reference Glean, Edwards and Faithfull25
In practical radiotherapy, constraints related to the patient anatomy, immobilisation equipment and the malleability of commercial bolus could lead to air-gaps between the bolus and the irradiation surface. The current work confirms that the penumbra width increases in terms of the air-gap size as shown in Figure 3a. This variation of penumbra decreases rapidly within 5 mm phantom depth to reach its value measured without air-gaps (Figure 3b). The irradiation conditions with air-gaps influence superficial dose more than deeper locations in the build-up region. In fact, the red area located in out-of-field of gamma index distribution versus the size of the air-gaps (Figure 4) could be explained by high lateral scattering of electrons created on the bolus and interacting in the air-gap region. The electrons created are finally passing across the water phantom outside the radiation field borders. Reference Shaw6 In addition, the irradiated surface of the bolus is also reduced by increasing the size of the air-gaps. Thus, the fluence of particles decreases which further disrupts the dose distribution. Based on the gamma index analysis, the gold standard for comparison between distributions, when comparing the reference distribution without air-gap and measurements with 5 mm air-gap size (see Table 2), the percentages of points passing the test are 99·8 and 99·9% for the gamma index criteria (2 mm, 2%) and (3 mm, 3%), respectively. This result is also confirmed by Local_Diff (%) and DoN (%) for 2% criterion. However, this is not the case for the acceptance criteria (1 mm, 1%) of gamma index and 1% for Local_Diff (%) and DoN (%), these criteria have not been adopted clinically. In regard to maximum values of the three comparison tools, their positions are located in surface off-field for gamma index and Local_Diff (%), and in the inner surface of the beam edge for DoN (%). As expected, for an air-gap size of 10 mm and more, the percentage of passed points passing the test is decreased and the maximum values are larger for all the comparison modes. In the clinical context, the distortion of dose distribution with increasing air-gap sizes means that a fraction of the prescribed dose was transmitted to the organ at risk near to the beam edge inducing an underdosing of the target volume and overdosing the nearest volumes for the patient.
Conclusion
In radiotherapy, the bolus is a tool to improve the dose distribution coverage for superficial localisations. It is therefore useful to know its optimal thickness upstream the treatment planning process. The two parameters studied (R100 and Ds) are used to estimate the amount of dose deposited in the near-surface region by choosing the appropriate bolus thickness. However, the presence of small air-gaps between the bolus and the irradiated surface could affect the dose distribution inside patient, particularly near the field borders. Disturbance of the dose distribution by air-gaps was greater on the inner edge of the beam and out-of-field surface for an air-gap of 10 mm or more. This was justified by widening the penumbra occurred in the surface and the lateral spread of particles. With respect to realistic clinical situations, the lateral spread of the dose distribution to out-of-field area could have a significant influence on the patient’s treatment. In this concern, the design and the production of 3D printed bolus for photon beam radiotherapy might lead to be a better choice instead of conventional bolus.
Acknowledgements
The authors express their gratitude to Pr. Soufiane Berhili for his contribution in writing assistance.
Conflict of interest
The authors declare that they have no conflict of interest.


