


INTRODUCTION
Radiotherapy aims at providing maximum dose to the tumour while minimising the exposure to the normal tissue. Various developments and advances are happening in the field of radiotherapy to achieve this goal. The volumetric modulated arc therapy (VMAT) is one of the new techniques used to produce highly conformal dose distribution around the tumour while sparing critical structures. VMAT has the ability to produce complex dose distribution in a single rotation of the gantry, within a short time, by modulating gantry speed, dose rate and the position of multileaf collimator (MLC).Reference Otto 1 Therefore, this technique is attaining wide acceptance and is being used to treat several treatment sites.Reference Zhang, Happersett, Hunt, Jackson, Zelefsky and Mageras 2 – Reference Fogliata, Clivio, Nicolini, Vanetti and Cozzi 5 The treatment planning is done based on the assumption that patient anatomy is static over the course of treatment. But during treatment delivery, patient repositioning and motion of internal organs give rise to uncertainties.Reference Fu, Yang, Yue, Heron and Saiful Huq 6 – Reference Fu, Yang, Li, Heron, Huq and Yue 8 In addition, MLC positional errors or small calibration errors in the angular settings of the collimator, couch or gantry may create difference in dose delivery.Reference Oliver, Gagne, Bush, Zavgorodni, Ansbacher and Beck-ham 9 – Reference Noufal, Abdullah, Niyas and Nambiar 11 In combination, the patient setup variations and the machine delivery errors may produce a delivered dose different from that of the planned dose. These effects are especially significant in VMAT techniques, where there is a steep dose gradient between the tumour and the organ at risk (OAR).
The uncertainties in the patient setup and internal organ motions are inevitable part of radiotherapy. Several reports reveal that there are variations in the delivered dose from that of the planned dose, received by the tumour and OARs, due to setup errors. Fu et al.Reference Fu, Yang, Yue, Heron and Saiful Huq 6 investigated the effect of setup errors in head and neck cases treated with intensity-modulated radiotherapy (IMRT), and reported that for some fractions, the dose that covers 98% of target volume (D 98%) was reduced by 5·5% for the clinical target volume (CTV) and the dose that covers 95% of target volume (D 95%) decreased by 13·2% for planning target volume (PTV). They also reported a significant increase in the dose to the spinal cord. Wertz et al.Reference Wertz, Lohr and Dobler 7 reported that there was a 24% decrease in the volume of prostate receiving 95% of prescribed dose (V 95%) and the mean dose to the rectum was increased by up to 41%, due to setup uncertainty. They noticed an increase in V 95% of the prostate by up to 17% and up to 23% reduction in the mean dose to rectum, after linear translational correction was applied. Unlike the translational set-up errors, rotational set-up errors have lesser impact on dose variation in prostate plans.Reference Fu, Yang, Li, Heron, Huq and Yue 8 Fu et al.Reference Fu, Yang, Li, Heron, Huq and Yue 8 reported a variation within 1·5% in equivalent uniform dose (EUD) and only a 1% decline in tumour control probability (TCP) due to a 3° rotational error. These variations, however, can be minimised by proper adoption of the image guided radiotherapy method.Reference Becker-Schiebe, Abaci and Ahmad 12 , Reference Park, Yan and McGrath 13
In order to take these uncertainties into account, margins are always given around the CTV either based on the recommendation of the International Commission on radiation units and measurements 14 or following the formula recommended by van Herk et al.Reference van Herk, Remeijer, Rasch and Lebesque 15 based on the analysis of dose-population histograms. A wider margin around the CTV increases the dose to normal tissue and therefore different online correction methods are being proposed to reduce the margin between the CTV and PTV so as to minimise the exposure.Reference Wen, Kumarasiri and Nurushev 16 , Reference Gill, Reddy, Campbell and Chen 17 Wen et al.Reference Wen, Kumarasiri and Nurushev 16 studied the effect of margin reduction on the radiobiological parameters around the prostate CTV and reported that there is decline in the value of Normal tissue complication probability (NTCP) of the rectum when the posterior margin was reduced; but there is also an average reduction in the predicted TCP of the treated plan. Gill et al.Reference Gill, Reddy, Campbell and Chen 17 had tried to find an optimal PTV margin based on the daily cone beam computed tomography (CBCT) dose calculation in prostate IMRT plans and they reported that the increase in the margin around the CTV have increased the CTV dose coverage. At the same time, the dose to the rectum and the variations in the bladder dose were also found to increase on a daily basis. This implies that, due to positional variations, a smaller margin may result in an under dose to the CTV while a larger margin can increase the dose received by the normal tissue or OARs. This calls for an optimal margin around the PTV and a careful evaluation of treated dose on a daily basis, which necessitate the study presented in this paper.
The imaging techniques allow us to verify patient position on a daily basis and monitor the tumour positional changes. Using this technique, the right–left (R-L), anterior–posterior (A-P) and superior–inferior (S-I) shifts from the planned iso-centre (IC) positions can be obtained. The plan can be executed as such, if the shifts are within certain tolerance limits. But otherwise, either shift should be applied on the couch positions; or repositioning of the patient is required if the shift is larger. However, different plans have different levels of complexity and different dose gradients. In prostate tumour patients the margin is reduced in the posterior part of the CTV in order to reduce rectal complications. In such cases, due to setup variations in A-P direction in the rectal volume, a part of the anterior rectum may regularly receive full prescription dose.Reference Gill, Reddy, Campbell and Chen 17 This will change depending upon the magnitude of the shifts accepted and the dose gradient in the posterior direction, and may lead to rectal complexity.Reference Wen, Kumarasiri and Nurushev 16 Due to the variations in the setup, the dose–volume histogram (DVH) of the accepted base plan may not exactly correspond to the actual treated dose. The exact effect of these variations on the DVH and the radiobiological parameters need to be found on a daily basis for applying couch translational corrections. Our aim is to study the effect of systematic couch translational shifts in R-L, S-I and A-P directions, in the DVH and radiobiological parameters in prostate cases and to develop a simple and swift method to predict the same online on a daily basis.
MATERIALS AND METHODS
Impacts of systematic translational couch shifts on DVH parameters in prostate VMAT plans
In total, ten prostate patients treated with VMAT technology were selected for this study. As data were to be aggregated and no patient identifiable data were recorded, Hospital’s Research Ethics Board deemed that formal ethical approval to access the images or data was not required. The simulation was done in the supine position with a full bladder and empty rectum. CT images were acquired using a GE light-speed CT simulator (GE Medical Systems, Milwaukee, WI, USA) with a 3-mm slice thickness and were then transferred into the treatment planning system (TPS) (Version 10, Varian Medical Systems, Palo Alto, CA, USA). After that, a radiation oncologist contoured the CTVs, PTVs and the OARs on each slice of the CT images. The prostate plan was generated with a dose of 70 Gy in 28 fractions. The whole prostate, along with seminal vesicles were taken to create the CTV 70 Gy and an 8 mm margin was added around it to create the corresponding PTV. The margin was limited to 6 mm in the posterior to restrict the dose to the anterior rectal wall. OARs such as rectum, bladder, bowel and femoral head were contoured. The volumes receiving doses more than 40 Gy (V 40 Gy) and 70 Gy (V 70 Gy) were kept less than 60% and 30%, respectively, in bladder and less than 45% and 20%, respectively, in the case of rectum.
The VMAT plans were generated using the Eclipse TPS (Version 10; Varian Medical Systems, Palo Alto, CA, USA) modelled with Clinac ix (Varian Medical Systems) equipped with a Millennium 120 MLC. The plans were generated using two complementary full arcs with gantry angle from 179° to 181° and collimator rotation of 30° and 330°. The plans were optimised until a minimum 95% of the volume of the PTV received at least 95% of the prescribed dose, and all the OARs dose constraints were met. All VMAT plans were generated with 6MV X-ray beam and the dose calculation was done using Anisotropic Analytical Algorithm with grid size of 0·25×0·25×0·25 cm3. In order to find the effect of systematic translational couch shifts on the DVH parameters, errors were introduced in the clinically accepted base plan. Errors were introduced with an increment of 1 mm and up to 5 mm from the IC in both positive and negative directions on each of the three axis, x (R-L), y (S-I) and z (A-P). Thus for each patient, 30 plans with introduced errors were generated by simply recalculating the base plan, without changing any other parameter. As a result, a total of 300 error plans were generated for ten patients. The variations in the DVH parameters at D 98% and D 95% of the PTV and CTV and at V 70 Gy, V 60 Gy and V 40 Gy of the bladder and rectum were analysed, both for the base plan and the error plans. The percentage of difference in dose (∆D) was calculated for each error plan from the base plan.
Impacts of the systematic translational couch shifts on radiobiological parameters in prostate VMAT plans
In order to assess the impacts of systematic translational couch shifts on the radiobiological parameter such as the TCP, NTCP and EUD, DVHs of the error induced plans described above were used. The DVHs of the base plan and the error plans were imported into the MATLAB software (R2013a, The MathWorks, Natick, MA, USA). All the radiobiological parameters were calculated using the in-house program written in MATLAB and the percentage of variation in the EUD and TCP of the PTV (∆EUDPTV and ∆TCPPTV) and CTV (∆EUDCTV and ∆TCPCTV) were calculated. In the case of OARs, NTCP and EUD of the bladder (∆NTCPbladder, ∆EUDbladder) and rectum (∆NTCPrectum, ∆EUDrectum) were also calculated.
EUD is calculated using the Niemierko model,Reference Gay and Niemierko 18 according to which a uniform equivalent dose will produce the same biological effect as the actual non-uniform dose distribution. It is found by the formula,
 $${\rm EUD}{\equals}\left( {\mathop{\sum}\limits_{i{\equals}1} {\left( {v_{i} D_{i}^{a} } \right)} } \right)^{{{1 \over a}}} $$
where D i is the dose in Gy received by the i th sub volume represented by the parameter and ‘a’ is a unitless model parameter which is a negative number for the tumours and is positive for the normal tissues.Reference Gill, Reddy, Campbell and Chen 17 When a=1, EUD becomes the mean dose. TCP can be calculated from EUD using the following equation,
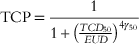 $${\rm TCP}{\equals}{1 \over {1{\plus}\left( {{{TCD_{{50}} } \over {EUD}}} \right)^{{4\gamma _{{50}} }} }}$$
where TCD50 is the tumour dose required to control 50% of the tumour when the tumour is homogeneously irradiated. γ 50 is a unitless parameter that describes the slope of the dose-response curve and is specific to both normal tissues and tumours. The NTCP values were calculated using the Lyman–Kutcher–Burman (LKB) modelReference Semenenko and Li 19 and is obtained using the following equations.
 $${\rm NTCP}{\equals}{1 \over {\sqrt {2\pi } }}\mathop \smallint \limits{\int_{{\!\!\!\!\!\minus \infty}}^t} e^{{{{{\minus}x^{2} } \over 2}}} dx$$
where
 $t{\equals}{{D_{{{\rm eff}{\minus}TD_{{50}} }} } \over {mTD_{{50}} }}$
and
$t{\equals}{{D_{{{\rm eff}{\minus}TD_{{50}} }} } \over {mTD_{{50}} }}$
and
 $D_{{{\rm eff}}} {\equals}(\mathop \sum\nolimits_i v_{i} {\rm }D_{i} ^{{{1 \over n}}} )^{n} $
where TD50 is the dose with which if the entire organ is uniformly irradiated, would cause a 50% chance of normal tissue complication, m the slope parameter and n the volume effect parameter.
$D_{{{\rm eff}}} {\equals}(\mathop \sum\nolimits_i v_{i} {\rm }D_{i} ^{{{1 \over n}}} )^{n} $
where TD50 is the dose with which if the entire organ is uniformly irradiated, would cause a 50% chance of normal tissue complication, m the slope parameter and n the volume effect parameter.
For the calculation of TCP and EUD, the values of parameters used are as given below: TCD50=70·5, γ 50=2·9, and a=−24.Reference Levegrun, Jackson and Zelefsky 20 , Reference Sovik, Ovrum, Olsen and Malinen 21 For NTCP calculation in the bladder using the LKB model, n=0·0099, m=0·022 and TD50=77·60 Gy for late genitorurinary toxicityReference Cheung, Tucker and Dong 22 and for the calculation of NTCP in the rectum, n=0·09, m=0·13 and TD 50=76·9 Gy for Grade ≥2 rectal toxicity.Reference Michalski, Gay, Jackson, Tucker and Deasy 23
Generating DVH for random translational couch shifted plans and calculating radiobiological parameters
A cumulative DVH is a plot between the dose in Gy or percentage along the horizontal axis and the volume of structure receiving that dose in centimeter cube (CC) or in percentage along the vertical axis. Let D j (x 0 , y 0, z 0) is the dose received by V j th volume of a structure in the DVH of base plan, planned with an IC (x 0, y 0, z 0) (Figure 1a). When there is a translational couch shift of ‘i’ on either side of the IC position (x 0+i in the right or positive x direction and x 0−i in the left or negative x direction), the dose received by the V j th volume due to translational couch shift will now become D j (x 0+i , y 0, z 0) and D j (x 0−i , y 0, z 0) provided, there is no positional shift in the y and z axis (Figure 1a). Thus the variations in D j (x 0, y 0, z 0) along the x direction can be represented by the polynomial function f(x, v j ) (Figure 1b). Similarly variation in D j (x 0, y 0, z 0) along the y and z axis can be represented by polynomial functions f(y, v j ) and f(z, v j ), respectively.
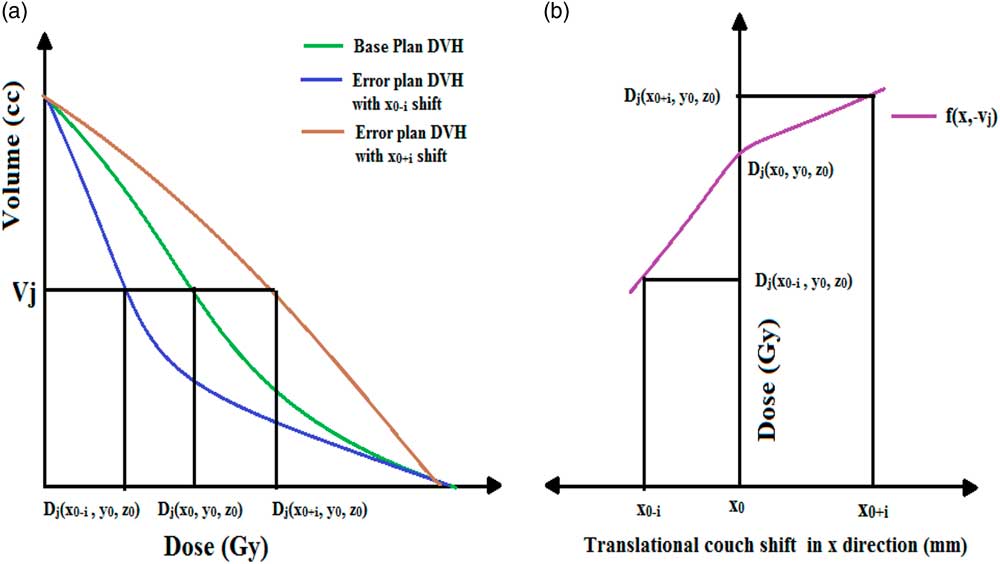
Figure 1 (a) Plot of cumulative dose–volume histogram (DVH) when planned at iso-centre (x 0, y 0, z 0) and with translational couch shift of ‘i’ in the positive and negative x direction, with no errors in y and z axis. (b) Function f(x, v j ) which represent the variations in dose due to translational couch shifts along the x direction.
DVHs of error plans described above were imported to MATLAB and an in-house MATLAB code written to find best fitted polynomials f(x, v j ), f(y, v j ) and f(z, v j ) for each target and OAR at every points on the DVH. These functions can be used to find the variations in the dose points on the DVH due to the daily translation couch shifts in the three directions. If x 1, y 1 and z 1 are the translation shifts in R-L, S-I and A-P directions and ∆D jx , ∆D jy and ∆D jz are the dose difference in D j (x 0, y 0, z 0) due to these shifts, then the variations in the dose can be calculated as follows:
 $$\Delta D_{{jx}} {\equals}{\rm f}(x_{0} ,\,v_{j} ){\minus}{\rm f}(x_{1} ,\,v_{j} )$$
 $$\Delta D_{{jy}} {\equals}{\rm f}(y_{0} ,\,v_{j} ){\minus}{\rm f}(y_{1} ,v_{j} )$$
 $$\Delta D_{{jz}} {\equals}{\rm f}(z_{0} ,\,v_{j} ){\minus}{\rm f}(x_{1} ,\,v_{j} )$$
Then the total deviation in dose, ∆D T can be given by,
 $$\Delta D_{T} {\equals}\Delta D_{{jx}} \,\pm\,\Delta D_{{jy}} \,\pm\,\Delta D_{{jz}} $$
and the new dose point D j for the translational couch shifts of x 1, y 1 and z 1 will become,
 $$D_{j} (x_{1} ,y_{1} ,z_{1} ){\rm }{\equals}D_{j} (x_{0} ,y_{0} ,z_{0} )\,\pm\,\Delta D_{T} $$
Using this methodology, we are able to generate dose points corresponding to each volume by generating predicted DVH of the daily translational couch variations. This predicted DVH is then used to find the daily radiobiological parameters such as EUD, TCP and NTCP as per the method described above. In order to validate the above method, ten plans with random translational couch shifts were generated from the base plan in the TPS for each of the ten patients. Shifts were applied in R-L, S-I and A-P directions with magnitude as shown in Figure 2. The TPS generated DVH is then compared with the MATLAB generated predicted DVH and the percentage of deviation between the two and the radio-biological parameters were analysed.
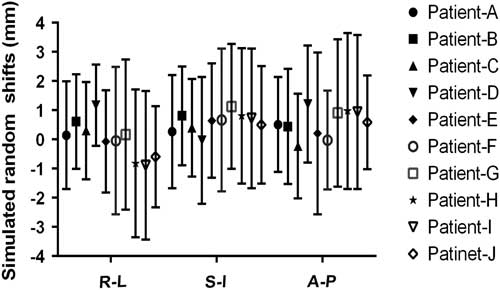
Figure 2 Mean and standard deviations of the simulated random shifts in the right–left (R-L), superior–inferior (S-I) and anterior–posterior (A-P) directions in ten patients.
RESULT
Impacts of systematic translational couch shifts on DVH parameters in prostate VMAT plans
Figures 3 and 4 show the mean and standard deviations in D 98% and D 95% of PTV and CTV due to systematic translational couch shifts in the R-L, S-I and A-P directions. In both the cases, these parameters are seen to decrease after applying the shifts. In CTV, the positional errors made no significant impact in the dose as the variations in any of the three directions were less than 1%. The maximum variations were observed in the S-I direction than in the A-P or R-L directions, both for CTV and PTV. In the case of PTV, it can be seen that the maximum variation is in D 98% than that in D 95%. It is also noted that as the magnitude of the systematic shifts increased, variations in the parameters also increased. The maximum variations in S-I direction in the PTV were found to be −12·6±8·6% and −6·2±3·26% for D 98% and D 95%, respectively, when a 5 mm shift was applied in the superior direction. Similarly, the maximum variations for D 98% and D 95% were −7·2±1·9% and −3·8±2·3% in the R-L direction, and −7·7±4·5% and −4·2±3·7% in the A-P direction, when the 5 mm shift was applied.
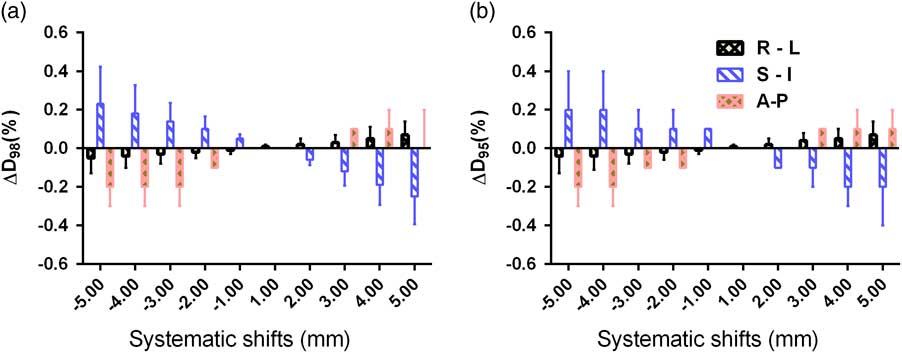
Figure 3 Mean and standard deviations of (a) ∆D 98% and (b) ∆D 95% of clinical target volume due to systematic translational couch shifts in the right–left (R-L), superior–inferior (S-I) and anterior–posterior (A-P) directions.
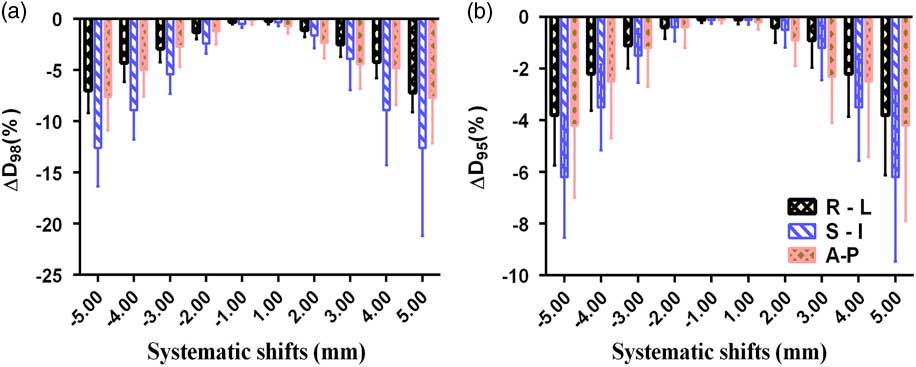
Figure 4 Mean and standard deviations of (a) ∆D 98% and (b) ∆D 95% of planning target volume due to systematic translational couch shifts in the right–left (R-L), superior–inferior (S-I) and anterior–posterior (A-P) directions.
The variations in V 70 Gy, V 60 Gy and V 40 Gy of the bladder due to systematic translational couch shifts in the R-L, S-I and A-P directions are shown in Figures 5 and 6. It was noted that the maximum variation was in V 70 Gy this was due to the S-I shift. Although the variations were more due to S-I shift in V 70 Gy and V 60 Gy, in the V 40 Gy, A-P shift caused higher variation. The R-L shifts produced very small changes in the parameters compared with the other two shifts. It can be observed that in the right, superior and anterior directions of couch shifts, the percentage of deviation is along the positive direction, which means that the bladder dose is more than the base plan dose. While in the left, inferior and posterior couch shifts, the dose received by the bladder seem to decrease compared with the planned dose. A 5 mm shift in superior direction caused a variation of 58·5±9·9% in V 70 Gy and 42·6±7·4% in V 60 Gy, while the same amount of shift in the inferior direction showed a variation of −54±5·1% and −38·4±4·8% in V 70 Gy and V 60 Gy, respectively.
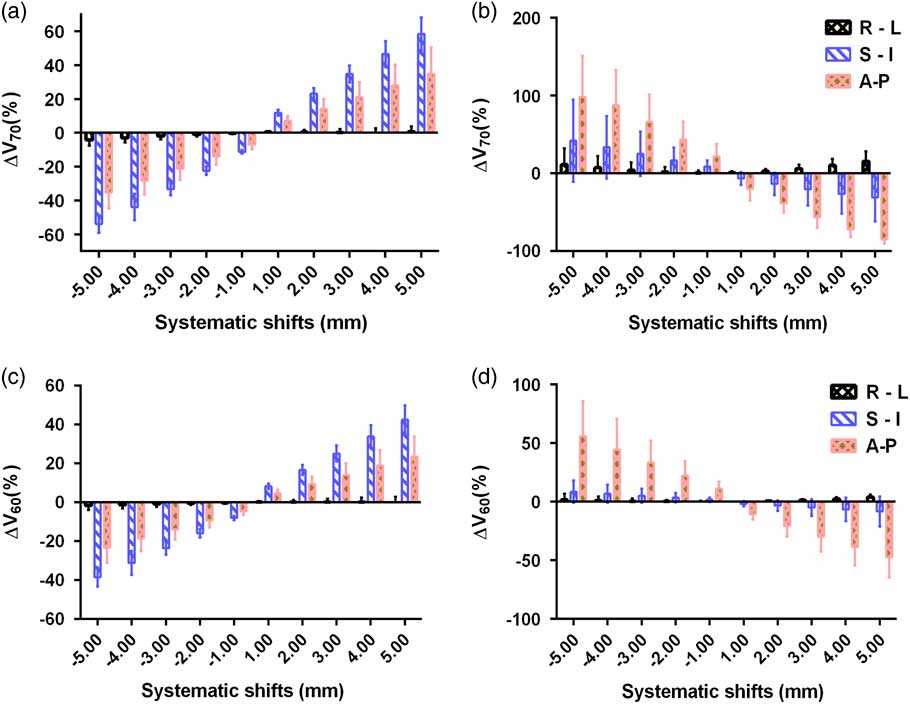
Figure 5 Mean and standard deviations of ∆V 70 Gy of (a) bladder and (b) rectum and ∆V 60 Gy of (c) bladder and (d) rectum due to systematic translational couch shifts in the right–left (R-L), superior–inferior (S-I) and anterior–posterior (A-P) directions.
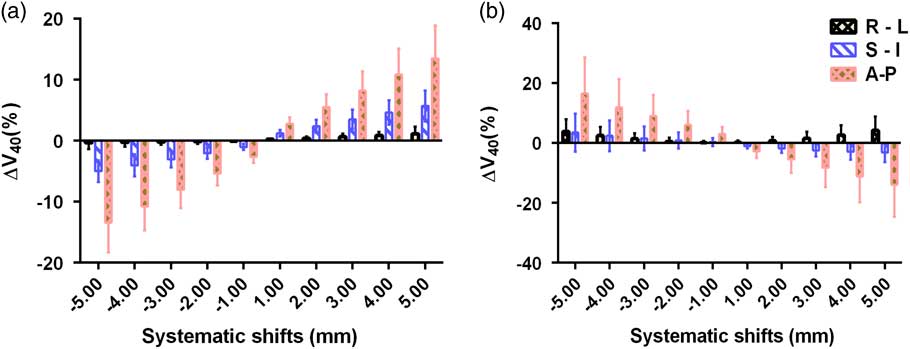
Figure 6 Mean and standard deviations of ∆V 40 Gy of (a) bladder and (b) rectum due to systematic translational couch shifts in the right–left (R-L), superior–inferior (S-I) and anterior–posterior (A-P) directions.
Figures 5 and 6 show the variations in V 70 Gy, V 60 Gy and V 40 Gy parameters of the rectum. The shifts in the A-P direction show the highest variations in all the three parameters. The highest variation is observed in V 70 Gy when a posterior shift of 5 mm was applied and the magnitude of variation was 98±53%, while in the anterior direction, a 5 mm shift produced a variation of −84·7±5·7%. Similarly, a shift of 5 mm in anterior direction produced a variation of 55·7±30% and 16·6±11·95% in V 60 Gy and V 40 Gy, respectively. A 5 mm shift in the right direction causes variations of 15·6±12·73%, 3·9±2·4%, 4·21±4·7% in V 70 Gy , V 60 Gy and V 40 Gy , respectively and a shift of same magnitude in the inferior direction creates variations of 42·1±52·8%, 8·6±9·6% and 3·48±6·3% in the V 70 Gy, V 60 Gy and V 40 Gy, respectively. Unlike the bladder cases, in the rectum, the inferior and posterior shifts produce positive variation in the percentage dose, implying the dose received by rectum is more than the planned dose. While the shifts in superior and anterior direction produced rectum dose less than the planned dose. However, in the R-L shifts, the rectum dose remained more than the base plan dose, irrespective of the direction. It can also be noted that, in the case of rectum, when the magnitude of shifts was increased in any of the direction, the magnitude of variation also increased for all the three parameters.
Impacts of systematic translational couch shifts on radiobiological parameters in the prostate VMAT plans
Table 1 shows the percentage of variation in EUD, TCP and NTCP values of the PTV, CTV, bladder and rectum due to systematic translational couch shifts in different directions. It can be noticed that, when the couch shifts were applied, the variations in EUD is more, compared with that of TCP for PTV and CTV. The magnitude of variations increases with increase in the magnitude of shifts. The variations observed were highest when superior–inferior shifts were applied. When a 5 mm shift was applied in the superior direction, the variation in EUD and TCP were −43·4±25·8% and −37·99±22%, respectively, for the PTV and −0·29±0·30 and −0·03±0·03, respectively, for CTV. It is also noted that, in the case of PTV, the target dose is less than the planned dose for the shifts in R-L, S-I and A-P directions. The variations in EUD and TCP were less than 1% for all the shifts in CTV.
Table 1 mean and standard deviation of the percentage variations in equivalent uniform dose (EUD), tumour control probability (TCP) and normal tissue complication probability (NTCP) values of the planning target volume (PTV), clinical target volume (CTV), bladder and rectum due to systematic translational couch shifts in different directions
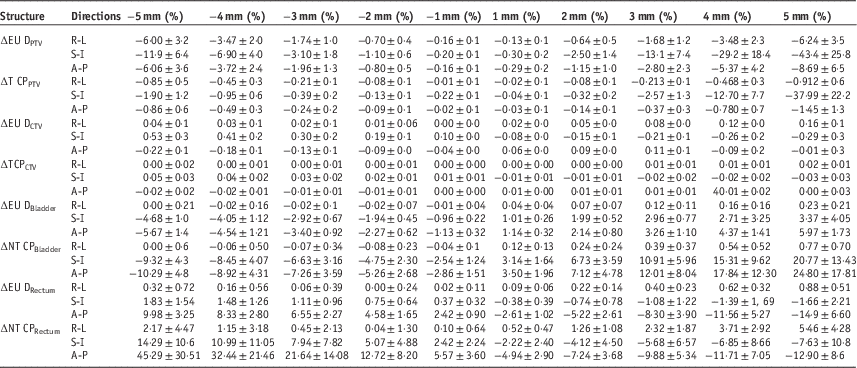
Abbreviations: R-L, right–left; S-I, superior–inferior; A-P, anterior–posterior.
For bladder, the variation in NTCP is much more compared to that of EUD. It is also seen that the couch shifts in the A-P direction produced maximum variations in the radiobiological parameters while the shifts in R-L direction produced very small variations compared with the other two directional shifts. An error of 5 mm in the anterior direction increase the EUD and NTCP by 5·97±1·73% and 24·80±17·81%, whereas the same shift in the posterior direction decrease these parameters by −5·67±1·49% and −10·29±4·88%, respectively. The table also shows that the variations in EUD and NTCP tend to increase as we move towards the anterior, superior and right direction while it shows a decrease when shifts in posterior, inferior and left direction occur.
It is noted that the radiobiological parameters in the rectum are also most affected by the shifts in the A-P direction and the magnitude of variations is very small in the R-L direction compared with the other two directions. It can also be noted that the shifts in anterior and superior direction always result in a lower EUD and NTCP values compared with that of base plan, while the posterior and inferior shifts cause a higher parameter values. However, when errors in the R-L direction were applied, the values of the parameter remained higher than that of the base plan throughout the shifts. The maximum variations for EUD were −14·9±6·60% and 9·98±8·6% when errors of 5 mm were introduced in the anterior and posterior directions, respectively. Similarly, the maximum variations in NTCP for a 5 mm error in anterior and posterior direction were −12·90±8·6% and 45·29±30·51%, respectively.
Generating DVH for random translational couch shifted plans and calculating radiobiological parameters
Figure 7a illustrate the functions f(x, v j ), f(y, v j ) and f(z, v j ) of the D 98% of the CTV and PTV and D 50% of the bladder and rectum, which is represented by three 6th order polynomial curves. In all the cases, it can be noted from the graph that, the values of R 2 is close to 1. Figure 8 comprises of two DVH plots, which showed maximum variation when the TPS calculated and MATLAB predicted DVHs were compared. From the figure, it is clear that both DVH curves almost overlap with each other and the maximum variation between the two curves at any point is less than 0·5% in CTV, PTV, rectum and bladder (Figure 8b).

Figure 7 Fitted polynomial curves values of R 2 for (a) D 98% of clinical target volume, (b) D 98% of planning target volume, (c) D 50% of bladder and (d) D 50% of the rectum in the right–left (R-L), superior–inferior (S-I) and anterior–posterior (A-P) directions.
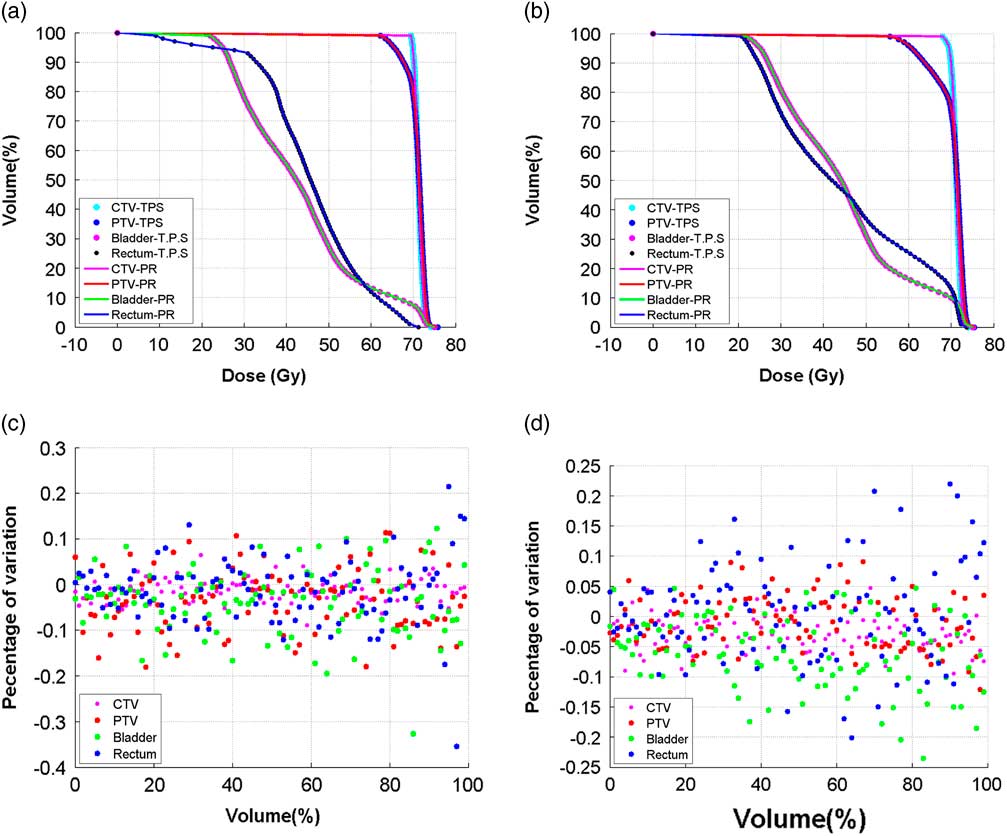
Figure 8 (a) and (b) Comparing treatment planning system (TPS) calculated dose–volume histogram (DVH) of the clinical target volume (CTV-TPS), planning target volume (PTV-TPS), bladder (Bladder-TPS) and the rectum (Rectum-TPS) with the MATLAB predicted (PR) DVH of the CTV (CTV-PR), PTV (PTV-PR), bladder (Bladder-PR) and rectum (Rectum-PR), when random translational couch shifts were applied. (c) and (d) Corresponding percentage of deviation at each point of the TPS calculated and the MATLAB predicted DVH.
The mean standard deviations of the variations, due to random shifts, in the DVH and radiobiological parameters for the targets and OARs calculated by TPS and MATLAB are shown in Figure 9. The graph shows a good correlation between the parameters calculated by both the methods. The mean and standard deviation of D 98% for PTV, when calculated by TPS and MATLAB were −4·75±3·3% and −4·74±3·29%, respectively. Similarly, the mean and standard deviation of EUD and TCP for PTV when calculated in TPS were −2·73±2·92% and −0·344±0·46%, respectively, which exactly matched with the MATLAB predicted values. Likewise, in the case of CTV, the variations calculated using the two methods were in line with each other in all the parameters. In the case of OARs the maximum variation was found in the V 70 Gy which were 6·09±3·2% and 7·32±2·5%, respectively, for bladder and rectum. Here also, the variations in the DVH and radiobiological parameters due to the couch shifts calculated using both the methods were in par with each other.
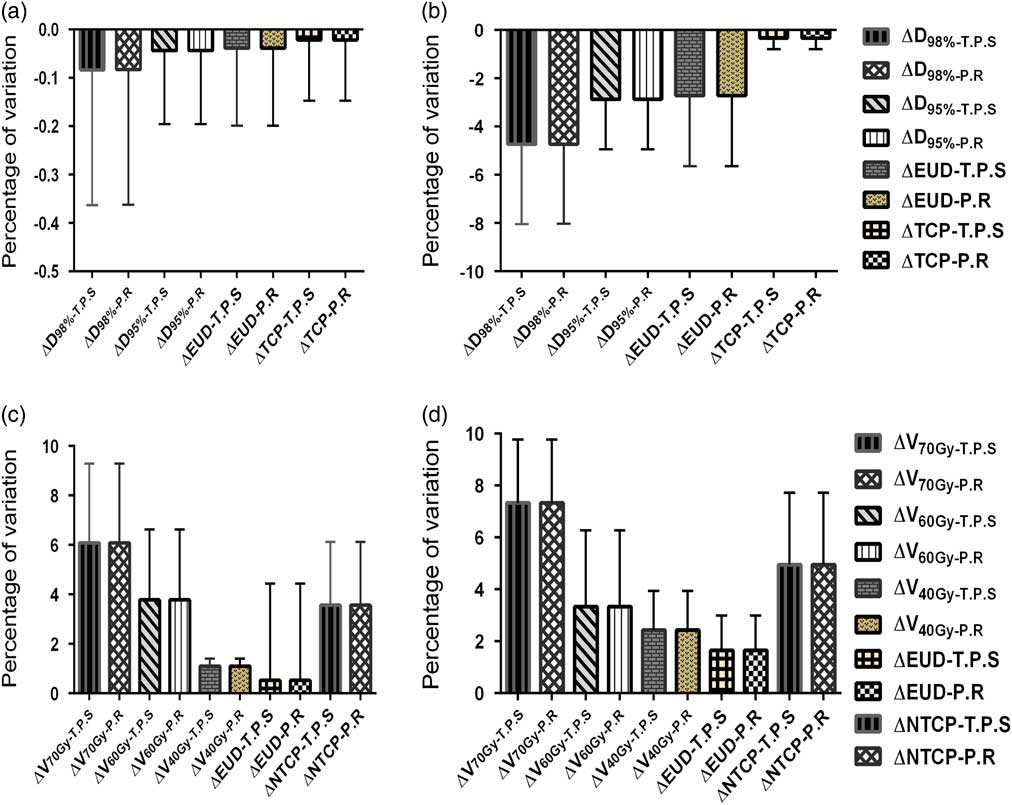
Figure 9 The comparison of treatment planning system calculated and MATLAB predicted values of mean percentage of variation in the dose–volume histogram and radiobiological parameters of (a) clinical target volume, (b) planning target volume, (c) bladder and (d) rectum when the random couch shift plans.
DISCUSSION
VMAT plans produce highly conformal dose distributions around the target with a sharp dose gradient between the PTV and OARs. The degree of dose gradient may differ depending upon the beam arrangement and planning constraints given during the optimisation, and thus setup deviations will have a varying impacts on the final treatment plans. In routine clinical situations, the setup errors are analysed based on modern imaging technology. Analysis of errors for each patient setup and then applying the correction process may result in an increased workload and treatment time. There are also chances of errors arising during the correction procedure. So, if we analyze potential dose delivery errors in advance and incorporate the corrections, the efficiency of the treatment can be improved at the same time, achieving the preferred dose coverage. A tolerance level for setup errors needs to be established on the basis of target site and institutional protocol. Since every plan is different, we need to analyze the effect of accepted tolerance level in couch shifts on the parameters, preferably in the treatment position itself. In our study, we extensively examined the effect of systematic translational couch shifts in the prostate VMAT plans on the DVH and radiobiological parameters and developed a method to predict these effects on a daily basis.
After evaluating the effects of systematic translational couch shifts from the error plans generated for the ten patients, we observed that the variations in the parameters depend upon the direction and magnitude of the shift. Our study revealed that in the case of PTV and CTV, both DVH and radiobiological parameters are affected most due to S-I shifts than the shifts in A-P and R-L directions. As the inferior and superior field borders are common for the field segments, the dose gradient will be highest in the inferior and/or superior direction. The higher dose gradient, compared with the R-L and A-P direction, thus results in higher dose difference due to S-I shifts. Lo et al.Reference Lo, Huang and Hong 24 have studied the effect of systematic and random shifts on DVH parameters and they reported that the effect was insignificant on the prostate CTV, as the D 95% of prostate was more than 99·95% of the prescribed dose. Our study matched with their observation as we could not find any significant changes in the dose to the CTV, due to both systematic and random shifts. We found the value for ∆D 95% was less than 1%. This can be attributed to the fact that the margin given around the CTV was adequate enough to account for the error introduced. Whereas, in the case of PTV, systematic shifts caused significant variation in the parameters, while the variations due to random shifts were comparatively less. Algan et al.Reference Algan, Jamgade and Ali 25 studied the effect of daily setup errors on the prostate IMRT by moving the iso-centre in the opposite direction of the shift, thus mathematically negating the shift. They found significant variations between the planned and delivered doses to the PTV and reported that the mean value for V 95 before and after correcting the patient setup as 87·3% and 99·9%, respectively.
It was noted that, in the case of bladder and rectum, most of the parameters are affected by the A-P shifts than the shifts in other two directions. Lo et al.Reference Lo, Huang and Hong 24 had reported similar findings as they had noted larger variations in rectum volume due to A-P shifts, that is, more than 6% volume changes due to a 1·0 mm shift in anterior direction. We had found that V 70 Gy and V 60 Gy of the bladder were more effected by S-I shifts whereas the shifts in R-L direction produced comparatively less variations in the parameters. Our results matched with those of Lo et al., as they too reported more than 3% change in the bladder volume due to 3·0 mm S-I shift and that the changes in volume in the V 90% and V 70% of bladder and rectum due to systematic errors were within 3·0 mm in the R-L direction. The shifts in A-P direction produced the largest variations in the radiobiological parameters in both the critical structures. This may be due to the position of bladder and rectum, which borders the anterior and posterior walls of the target, respectively. On trying to minimise the dose to the critical structures, a sharp dose gradient exists in this region which leads to high-dose variations even for small shifts. For instance, whenever there is a shift in the posterior direction, the rectum enters the high dose area of the target.
DVH is a potential tool used in evaluating the treatment plans. The shape of the DVH curve and the area under it plays an important role in determining the adequacy and the homogeneity of dose coverage in the tumour volume and also in deciding the acceptable dose to the OARs. The DVH can also be used to calculate the radiobiological parameters. But patient setup errors causes the planned dose to be different from the delivered dose which leads to changes in the daily DVH and in turn causes variations in the radiobiological parameters. So, we have introduced a method for calculating the daily DVH incorporating the random translational couch shifts and by which, the changes in the radiobiological parameters can be monitored on a daily basis.
In order to predict the effect of shifts on the DVH and the radiobiological parameters on a daily basis, we have introduced the method using the polynomial curve fitting method. For this, we found three polynomial functions f(x, v j ), f(y, v j ) in three direction using the data from the DVHs of systematic translational shifts. A program was written to find these functions using the curve fitting tools available in the MATLAB in such a way that the best fitted polynomials are found. This function is then used to find the variation in the dose points of the DVH due to random couch shifts. The validation of the MATLAB predicted and the TPS calculated DVHs was done and the values showed good correlation, with maximum variation being less than 0·5%. These DVHs were then used to calculate the variation in radiobiological parameters and it was found that the predicted and TPS calculated radiobiological parameters were in accordance with each other.
We observed that the daily simulated random shifts produced lesser effect on the DVH and radiobiological parameters than the systematic shifts. The variations due to random couch shifts were less than 0·5% for all the parameters in the CTV. We had observed larger variations in the V 70% and V 60% of the bladder and rectum due to the systematic shifts whereas the variations were less when the random shifts were applied. This can be attributed to the fact that the introduction of random errors resulted in dose smearing.Reference Arumugam, Xing, Holloway and Goozee 26 Lo et al.Reference Lo, Huang and Hong 24 reported that in the DVH parameters of prostate IMRT cases, random setup errors produced lesser volume changes than the systematic errors, which was in agreement with our findings. Arumugam et al.Reference Arumugam, Xing, Holloway and Goozee 26 have analysed the effect of random errors in IMRT and VMAT prostate plans and they reported that the variations in the dose to the CTV between the base plan and the error simulated plans were less than 1%. But they observed a higher difference in the dose in VMAT than IMRT for the PTV and concluded that in the case of dose to the PTV, the VMAT plans are relatively more sensitive than the IMRT to the random errors.
In this contest, our method of predicting the effect of couch shifts on the DVH and radiobiological parameters can be utilised on a daily basis to determine the uncertainties in the dose delivery and to enhance the quality of the treatment. As this method does not require any further re-calculation of the plans, it can be considered as an online tool to predict the variations in the clinics. But, our method uses the data from the DVHs of systematically shifted plans. Hence this does not consider any organ deformation or organ motion. Therefore, further investigation is needed before implementing this method clinically. In our future study, we are planning to incorporate the daily information obtained from the CBCT into this method and predict these effects of shifts on the DVH and radiobiological parameters on a daily basis more realistically.
CONCLUSION
In our study, we have evaluated the effects of couch shifts on DVH and radiobiological parameters of prostate VMAT plans and found that the variations in the parameters depend upon the direction and magnitude of the shift. It was noted that the variations in the dose to the CTV, due to both the systematic and random shifts were very small. Further, for CTV and PTV, the maximum variations were observed in the S-I direction than in the A-P or R-L directions. But it was found that the parameters in rectum and most of the parameters in the bladder were affected by the A-P shifts than the shifts in other two directions due to the sharp dose gradient that exist in this region. We have also checked the feasibility of applying daily translational couch shifts using the MATLAB predicted DVH and was found to be in good correlation with the TPS generated DVH. Further studies are required before clinical implementation of this method so as to incorporate organ motions and deformation.
Acknowledgement
None.


