


INTRODUCTION
Volumetric modulated arc therapy (VMAT) has become a popular option in prostate cancer treatment, because such dose delivery technique can produce comparable dose distribution as intensity-modulated radiotherapy (IMRT) with a shorter delivery time.Reference Otto 1 – Reference Chow and Jiang 6 Prostate VMAT uses one to multiple photon arcs to produce beam intensity modulation instead of static multi-directional beams in IMRT.Reference Chow and Jiang 7 Although the quality assurance (QA) for VMAT is more complex than IMRT due to the interplays among the gantry rotational speed, dose rate and multileaf collimator leaf speed, development of 3D patient-specific QA systems such as ArcCHECK® (Sun Nuclear Corp., Melbourne, FL, USA) and Delta4 Phantom+ (ScandiDos Inc., Madison, WI, USA) greatly enhances the QA process with accurate and precise results.Reference Letourneau, Publicover, Kozelka, Moseley and Jaffray 8 , Reference Liang, Liu, Zhou, Yin and Wu 9
In prostate VMAT, the inverse planning approach based on specific dose-volume criteria is used to determine the beam segments, which are generated by the multileaf collimator in the photon arc.Reference Earl, Shepard, Naqvi, Li and Yu 10 , Reference Chow, Grigorov and Nuri 11 The dose distribution in the patient’s irradiated volume is therefore calculated based on the field fluence in the arc. In dose calculation, commercial treatment planning system allows the user to select a range of grid size in the irradiated volume to determine the dose distribution. This range of grid size uses to be from 1 to 5 mm.Reference Dempsey, Romeijn, Li, Low and Palta 12 – Reference Srivastava, Cheng and Das 14 A large grid size results in a relatively low resolution of dose distribution, but a shorter computing time. Similarly, a small grid size can enhance the dose distribution resolution, but it will at the same time increase the dose computing time. It is, therefore, worthwhile to find out the dosimetric influence due to the calculation grid size variation in the prostate VMAT planning.
One impact of the calculation grid size variation is the changes of dose-volume histograms (DVHs) of the target and organs at risk (OARs). It is because the DVH reflects the dose to patient’s volume of target/OAR, calculated according to the grid/voxel size. For a highly irregular volume, a very small grid size (e.g., 1–2 mm) is needed because the voxel is cubic but the surface contour of volume is usually curved. Therefore, we expect that the grid size variation is more sensitive to the volume-of-interest such as the rectal wall having higher surface-to-volume ratio than the rectum in the prostate treatment plan.
In treatment planning QA, as the dose-volume points, dose-volume parameters and radiobiological parameters are calculated from DVHs of the target and OARs, it can be seen that the calculation grid size variation would affect the results of parameters. Such dose-volume and radiobiological parametrical variations were investigated in other treatment sites such as head-and-neck.Reference Chung, Jin, Palta, Suh and Kim 13 , Reference Srivastava, Cheng and Das 14
In this study, change of DVH due to the calculation grid size variation was investigated using the Gaussian error function (GEF), which is well established in DVH analysis.Reference Chow, Markel and Jiang 15 – Reference Chow, Markel and Jiang 17 Through mathematical modeling, the change of DVH is expressed in term of the GEF parametrical variation for different grid sizes in the prostate VMAT plans.Reference Chow, Jiang and Daniel 18 , Reference Chow, Jiang, Kiciak and Daniel 19 In addition, the GEF parametrical variation was compared with variations of the dose-volume points, dose-volume parameters and radiobiological parameters regarding the grid size variation.
MATERIALS AND METHODS
Patient data
The data from 10 prostate patients treated with VMAT at the Grand River Regional Cancer Centre, Canada, were used in this retrospective study. In the treatment planning, volumes of targets (PTV and CTV) and OARs (rectum, rectal wall, bladder, bladder wall, left and right femur) were contoured based on the patient’s computed tomography image set. The mean volumes of the PTV and CTV were 221·1 and 75·5 cm3 with standard deviations equal to 44·4 and 24·7 cm3, respectively. The range of volume, mean volume, median volume and standard deviations of targets and OARs are shown in Table 1.
Table 1 Range of volume, mean volume, median volume and standard deviation (SD) of the targets and organs at risk (OARs) for the 10 prostate volumetric modulated arc therapy (VMAT) patients

Abbreviations: PTV=planning target volume; CTV=clinical target volume.
VMAT treatment planning
In the prostate VMAT plan created by the Eclipse treatment planning system (ver. 11.0.31), both the gross tumour volume and CTV were equal to the prostate volume. The PTV was created with 1 cm margin from the CTV except 0·7 cm posteriorly. All OARs as shown in Table 1 were contoured by the same planner, and a full 6 MV photon arc produced by a Varian TrueBEAM linac was used in the treatment. The VMAT plan was inversely optimised by the Eclipse RapidArc algorithm based on the dose-volume criteria shown elsewhere.Reference Chow, Jiang and Kiciak 20 , Reference Chow and Jiang 21 For each plan, different calculation grid sizes of 1, 2, 3, 4 and 5 mm were used to generate the dose distribution and then DVHs of the targets and OARs. Dose-volume points, dose-volume parameters and radiobiological parameters were then calculated based on the corresponding grid size.
Calculations of radiobiological and dose-volume parameters
For the radiobiological parameters, the tumour control probabilities (TCPs) of the PTV and CTV were calculated by the equation:
 $${\rm TCP}{\equals}{\rm }{{{\rm exp }(p{\plus}qD)} \over {1{\plus}{\rm exp}(p{\plus}qD)}}{\rm }$$
where p and q are parameters related to the D 50 (dose required for a 50% probability of tumour control) and the normalised slope at the point of 50% control probability, γ 50 which can be found in Okunieff et al.Reference Okunieff, Morgan, Niemierko and Suit 22 Using the differential DVH (v i , D i ), converted from the cumulated DVH, the tumourlet control probability TCP (v i , D i ) can be calculated from Eq. (1) as:
 $${\rm TCP}\left( {v_{i} {\rm },{\rm }D_{i} } \right){\equals}{\rm TCP }(D_{i} )^{{v_{i} }} $$
The normal tissue complication probability (NTCP) of the OAR was calculated using the equation based on the Lyman–Burman–Kutcher algorithm:Reference Lyman 23 – Reference Kutcher, Burman, Brewster, Goitein and Mohan 25
 $${\rm NTCP}{\equals}{\rm }{1 \over {2\pi }}{\rm }\mathop \int \nolimits_{{\!\!\!\!\!\minus}\!\infty}^t e^{{{{{\minus}x^{2} } \over 2}}} {\rm }dx$$
where t can be expressed as:
 $$t{\equals}{\rm }{{D{\,\minus}{\rm TD}_{{50}} (v)} \over {m{\rm TD}_{{50{\rm }}} (v)}}$$
where v=V/V ref and TD50 (v)=TD50 (1) v -n according to Burman et al.Reference Burman, Kutcher, Emami and Goitein 24 m and n are the model parameters controlling the slope of the dose-response curve and dose-volume effects, respectively. In this study, the TCP and NTCP were calculated by an in-house program developed on the MATLAB platform by converting the cumulative DVH to differential DVH.Reference Jiang, Barnett, Chow and Chen 26 The equivalent uniform dose (EUD) was calculated from:
 $${\rm EUD}{\equals}{\rm }\Big( {\sum v_{i} {\rm }D_{i}^{{1/r}} {\rm }} \Big)^{r} $$
where v i is the partial volume of the dose D i , and r is a dimensionless tumour or normal tissue specific parameter.Reference Henriquez and Castrillon 27
For the dose-volume parameters, the homogeneity index (HI) was calculated using the following equation:Reference Kataria, Sharma, Subramani, Karrthick and Bisht 28
 $${\rm HI}{\equals}{{D_{{5{\rm \,\%\,}}} {\minus}D_{{95{\rm \,\%\,}}} } \over {D_{{{\rm mean}}} }}$$
where D 5%, D 95% and D mean are doses received by 5%, 95% and mean dose of the volume-of-interest, respectively. The optimal value of HI is equal to zero.
The conformity index (CI) was calculated using the following expression:
 $${\rm CI}{\equals}{\rm }{{V_{{98{\rm \,\%\,}}} } \over {V_{T} }}$$
according to the Radiation Therapy Oncology Group described in the Report 62 of the International Commission on Radiation Units and Measurements. 29 In Eq. (7), V 98% is the volume with the reference dose of 98% and V T is the target volume. The optimal value of CI is equal to 1.Reference Feuvret, Noël, Mazeron and Bey 30 Moreover, the gradient index (GI) was calculated by the following equation:Reference Paddick and Lippitz 31
 $${\rm GI}{\equals}{{V_{{50{\rm \,\%\,}}} } \over {V_{{100{\rm \,\%\,}}} }}$$
In Eq. (8), V 50% and V 100% are volumes covered by at least 50 and 100% of the prescription dose. The closer the GI value to 1, the faster the dose fall-off in the normal tissue, which indicates a lower dose to the OAR.
DVH analysis using the GEF
The DVH data can be converted to parameters of the GEF using the following equation:Reference Chow, Markel and Jiang 15 , Reference Chow, Markel and Jiang 17
 $$\eqalignno {V_{{cDVH}} (D){\equals} &\,\mathop{\sum}\limits_1^n {a_{{2n{\minus}1}} \,erf\,[b_{{2n{\minus}1}} \, \cdot \,(D\,{\minus}\,c_{{2n{\minus}1}} \,)\,]\, }\cr &{{{\ \plus}\,a_{{2n}} \,erfc\,[\,b_{{2n}} \, \cdot \,(D\,{\minus}\,c_{{2n}} \,)\,]} \qqaud $$
where D and V are the dose and volume of the cumulated DVH. The a 2n−1, b 2n−1 and c 2n−1 are parameters of the error function and a n , b 2n and c 2n are parameters of the complementary error function. For DVH curve of the PTV or CTV having shape similar to a single step, parameters of a 1, a 2, b 1, b 2, c 1 and c 2 (i.e., n=1) are adequate in the curve fitting.Reference Chow, Jiang, Kiciak and Daniel 19 For more complex DVH curves of OARs, n=2 is required.Reference Chow, Jiang and Markel 16 In this study, different DVH curves of targets and OARs were modelled using Eq. (9) regarding the calculation grid size variation.
RESULTS
Figure 1a and 1b show DVHs of the PTV and CTV, respectively. In Figure 1, only dose range from 70 to 85 Gy was displayed because the relative volume was always equal to 100% in the dose range of 0–70 Gy. Figure 2a–2d show the DVHs of the rectum, rectal wall, bladder and bladder wall, respectively. The variations of GEF parameters c 1 and c 2 on the grid size for the PTV and CTV are shown in Figure 3, while variations of parameters a 1 to a 4, b 1 to b 4 and c 1 to c 4 for the rectum and rectal wall are shown in Figure 4a–4c, respectively. Figure 5a–5c show variations of GEF parameters a 1 to a 4, b 1 to b 4 and c 1 to c 4 for the bladder and bladder wall on the calculation grid size. The percentage variations of the GEF parameters (a, b and c) regarding the grid size variation (1–5 mm) for the targets and OARs are shown in Table 2. Furthermore, the percentage variations of doses (mean dose, median dose, minimum dose and maximum dose), dose-volume points (D 30%, D 50%, D 95% and D 5%), dose-volume parameters (CI, HI and GI) and radiobiological parameters (TCP, NTCP and EUD) for the targets and OARs regarding the grid size variation are shown in Table 3.

Figure 1 Average dose-volume histograms of the (a) planning target volume, and (b) clinical target volume (CTV) for different calculation grid sizes (1–5 mm) in the prostate volumetric modulated arc therapy plans. PTV=planning target volume.
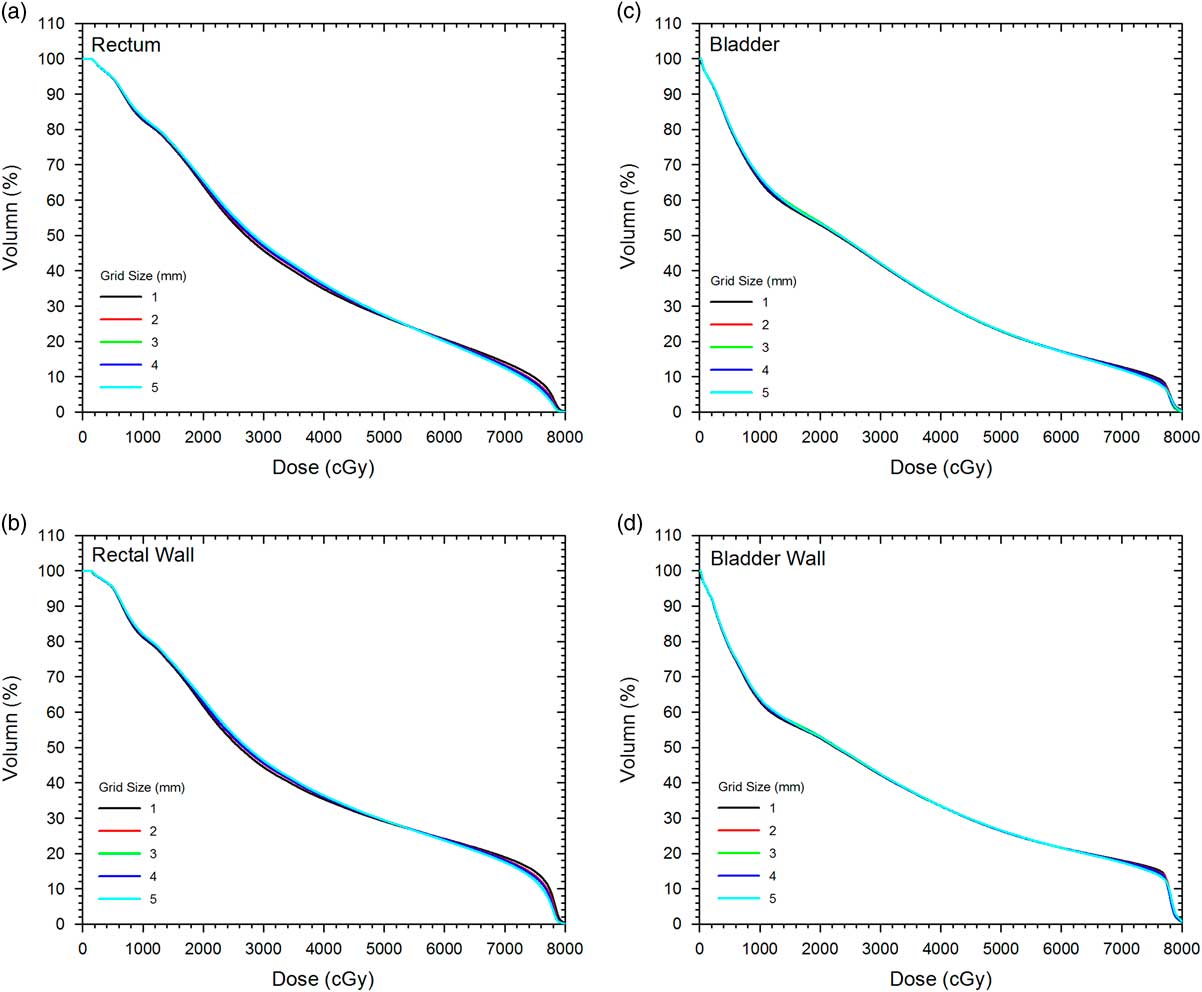
Figure 2 Average dose-volume histograms of the (a) rectum, (b) rectal wall, (c) bladder and (d) bladder wall for different calculation grid sizes (1–5 mm) in the prostate volumetric modulated arc therapy plans.

Figure 3 Parameters c 1 and c 2 versus calculation grid size for the planning and clinical target volume (PTV and CTV) in the prostate volumetric modulated arc therapy plans.

Figure 4 Parameters (a) a 1 to a 4, (b) b 1 to b 4 and (c) c 1 to c 4 for the rectum and rectal wall in the prostate volumetric modulated arc therapy plans.
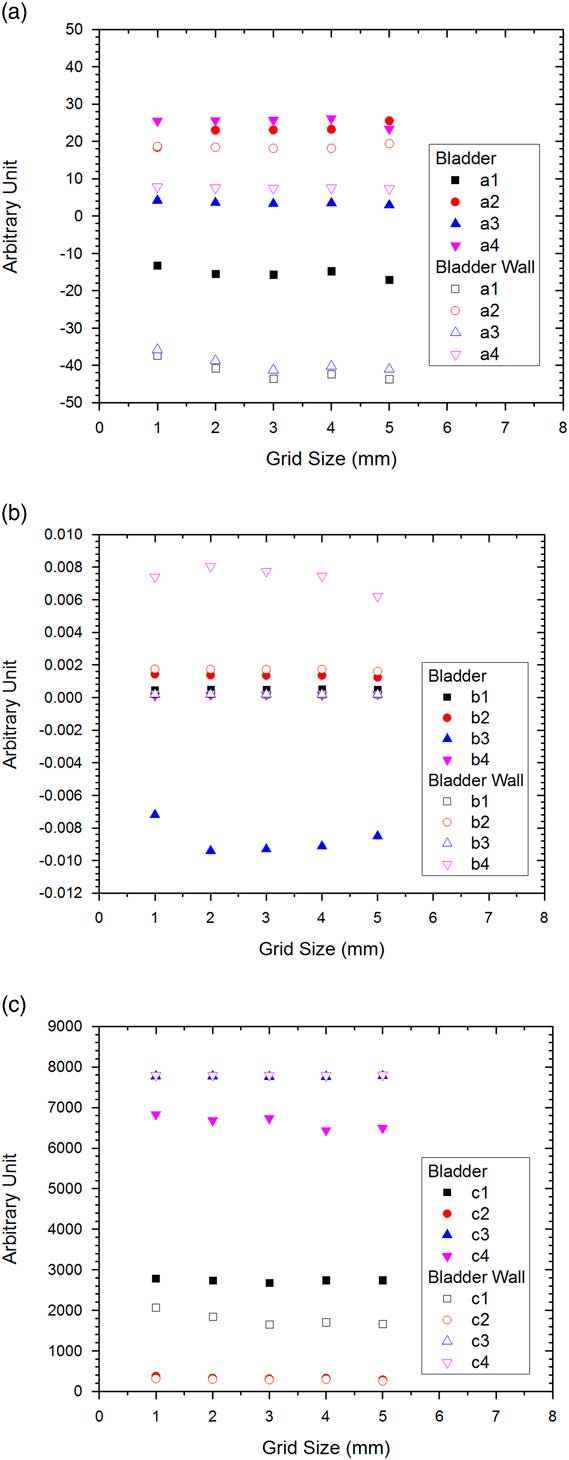
Figure 5 Parameters (a) a 1 to a 4, (b) b 1 to b 4 and (c) c 1 to c 4 for the bladder and bladder wall in the prostate volumetric modulated arc therapy plans.
Table 2 Percentage variations of the Gaussian error function parameters for the planning target volume (PTV), clinical target volume (CTV), rectum, rectal wall, bladder, bladder wall, left femur and right femur

Table 3 Percentage variations of the doses, dose-volume points, dose-volume parameters and radiobiological parameters for the planning target volume (PTV), clinical target volume (CTV), rectum, rectal wall, bladder, bladder wall, left femur and right femur

Abbreviations: CI=conformity index; HI=homogeneity index; GI=gradient index; TCP=tumour control probability; NTCP=normal tissue complication probability; EUD=equivalent uniform dose.
DISCUSSION
Variations of DVHs on the calculation grid size
In Figure 1, the DVH of the PTV (Figure 1a) is found varied more significantly than the CTV (Figure 1b) especially in the drop-off region (70–80 Gy), regarding the calculation grid size change. This agreed with the percentage variation of the D 95% of the PTV (%ΔD 95%=2·78%), which is about 10 times larger than that of the CTV (0·26%) as shown in Table 3. In addition, the D 95% of the PTV is found decreased with the grid size from 1 to 5 mm. Although variation of the DVH of the PTV was obvious with the grid size, similar variation was not observed in the DVH of the CTV as %ΔD 95%, %ΔD 50%, %ΔD 30% and %ΔD 5% of the CTV were lower than 0·3%. For DVHs of the rectum and rectal wall (Figure 2a and 2b), only DVH of the rectal wall revealed relatively larger %ΔD 30% (27·03%) and %ΔD 50% (18·49%) than those of the rectum (2·15 and 4·68%) in Table 3. This showed that dosimetric influence in the rectal wall was more significant than that of the rectum regarding the grid size variation. However, such change of DVH was not seen between the bladder and bladder wall as shown in Figure 2c and 2d. This was also true for DVHs of the left and right femur.
Variations of the GEF parameters on the calculation grid size
Figure 3 shows the relationship between the grid size and GEF parameters c 1 and c 2. In Eq. (9), parameter c is related to the variation of DVH drop-off position when the normalised volume is close to one.Reference Chow, Jiang, Kiciak and Daniel 19 It can be seen in the figure that both c 1 and c 2 decreased with rates of 7·75/mm and 6·75/mm when the grid size increased for the PTV, while there was no significant change of the parameters for the CTV. This agreed well with variations of the DVHs of the PTV and CTV as shown in Figure 1a and 1b. In Table 2, it is found that the %Δc 1 and %Δc 2 of the PTV was about two to three times larger than that of the CTV.
In Figure 4a–4c showing all variations of the GEF parameters on the calculation grid size for the rectum and rectal wall, it is seen that the parameters did not vary significantly. However, results from the percentage variation of parameters in Table 2 showed that all parameter variations for the rectal wall were larger than the rectum up to three times. This showed that the rectal wall, having larger surface-to-volume ratio than the rectum,Reference Grigor, Koster, Chow and Osei 32 was more sensitive to the calculation grid size change. However, the GEF parameters of the bladder and bladder wall as shown in Figure 5a–5c were different. It is found in Table 2 that most of the GEF parameters of the bladder were varied more significantly than the bladder wall. Unlike the case of the rectum and rectal wall, the increase of the surface-to-volume ratio of the bladder wall was not as large as the rectal wall, due to the larger volume of the bladder. It is therefore shown that when using rectal and bladder wall in the treatment planning, the dose-volume variation was more significant on the rectal wall regarding the calculation grid size variation. For the left and right femur, percentage variations of the GEF parameters were shown to be similar (Table 2). This is because both OARs were similar in shape and composition located on the left and right from the PTV symmetrically.
Percentage variation comparisons among the GEF, dose-volume and radiobiological parameters on the calculation grid size change
In Table 3, it is seen that variations of dose-volume parameters of CI, HI and GI for the PTV (40·02, 12·45 and 0·22%) were larger than those of the CTV (13·55, 2·93 and 0·06%) regarding the calculation grid size variation. Similarly, larger variations of the TCP and EUD for the PTV (0·61 and 2·11%) were found compared with the CTV (0·25 and 0·26%). These variations agreed with the results of DVHs and GEF parameters as shown in Figure 1 and Table 2, respectively. It showed that more significant changes on the dose-volume and radiobiological parameters of the PTV were found compared with the CTV, when the grid size was changed in the range of 1–5 mm. For the left and right femur, variations of the CI and HI were only in the range of 0·02–0·98%, and variations of the NTCP and EUD were 0·63–0·81%. This showed that femur had only insignificant change in the dose-volume and radiobiological parameters regarding grid size variation.
CONCLUSIONS
A variety of DVHs, dose-volume points, dose-volume parameters and radiobiological parameters for the targets and OARs were investigated regarding the calculation grid size variation in the prostate VMAT treatment planning. In the DVH analysis using the GEF, it is found that the DVH of the PTV varied more significantly than the CTV, resulting in a larger CI, HI, GI, TCP and EUD of the PTV compared with the CTV. For OARs, DVH of the rectal wall was found varied more significantly than the rectum. However, such variation did not occur in the bladder, bladder wall and femurs. The dose-volume and radiobiological information in this study is important to the radiotherapy staff, when considering increasing the dose computing speed by increasing the calculation grid size in the prostate VMAT plan. In future, however, smaller grid size (1–2 mm) would be popular because we do not need to worry about the long calculation time taking advantage of the rapid development of high performance and internet-based computing.Reference Chow 33
Acknowledgements
All patient data were from the Grand River Regional Cancer Centre, Canada. Authors would like to thank Michael Neilson at the Ryerson University, Canada for his assistance in the data analyses.


