


Introduction
Electronic portal imaging devices (EPIDs) are used for patient positioning verification, and could potentially be useful for patient dosimetry and linear accelerator-specific quality control.Reference Van Esch, Depuydt and Huyskens1–Reference Chatelain, Vetterli and Henzen6 Various EPID types have been used for patient set-up verification and in vivo dosimetry: Amorphous silicon (a-Si) flat panel detectors,Reference Van Esch, Depuydt and Huyskens1, Reference Greer and Popescu3, Reference Francois, Boissard and Berger7, Reference Sabet, Menk and Greer8 ionisation chamber matrices,Reference Mohammadi and Bezak9 and charged coupled device (CCD) camera-based EPIDs.Reference De Boer, Heijmen and Pasma4, Reference Franken, De Boer and Heijmen10–Reference Pasma, Dirkx and Kroonwijk14 One of the first commercially available EPIDs was the camera-based type; these EPIDs are particularly well suited for in vivo dosimetry.Reference van Elmpt, McDermott and Nijsten5 The camera-based or fluoroscopic EPIDs can be purchased separately to retrofit on linacs for radiation therapy departments. The CCD camera-based EPIDs have recently been equipped with peltier cooled CCD cameras. The CCD cooling reduced deteriorating effects of radiation damage on image quality.Reference Franken, De Boer and Heijmen10, Reference Franken, De Boer and Barnhoorn11 They can also handle very high signals per pixel, without compromising the low level imaging performance. They are designed to allow detection of small differences in light intensity. Consequently, details of very low contrast images can be seen against much brighter backgrounds, without saturating the higher intensity areas.Reference Odero and Shimm15 The cooling not only improves the camera signal to noise ratio at low exposures, yielding better image quality, but increases the lifetime of the camera.Reference de Boer, Barnhoorn and Heijmen12
The fluoroscopic EPIDs are categorised based on the distance between mirror and the phosphor screen. The mid and high elbow versions have separation between the mirror and phosphor screen of 23 and 41 cm, respectively. A new version of low elbow fluoroscopic EPID (Cablon Medical TheraView Technology, Leusden, the Netherlands) with minimum separation between the mirror and screen of 6·6 cm was investigated in this study.
EPIDs are used for patient set‐up verification and detection of organ motion but are also increasingly used for dosimetric verification. In our department, for in vivo dosimetry by the CCD camera-based EPID; a global calibration model has been developed. For that purpose, dosimetric properties of the EPID including warm up time, build-up thickness, dose history, linearity, stability and, short and long-term reproducibility of EPID response, as well as field size dependence were assessed.
Materials and Methods
Low elbow fluoroscopic EPID
The TheraView fluoroscopic EPID is equipped with a high quality digital, low noise cooled CCD camera, which detects the optical signal, originated from a phosphor screen and reflected by a 45° tilted mirror. The detector consists of a 2 mm thick copper plate bonded to a 400 mg/cm2 Terbium doped Gadolinium Oxy Sulphide (Gd2O2S:Tb) phosphor screen (Carestream Inc Lanex fast, Rochester, NY, USA). A 2·2 mm thick decorative cover with high impact polystyrene, density 1·04 g/cm3, is mounted over the detector such that the phosphor screen lies ~4 mm below the physical surface of the detector.
The CCD camera dead time per frame (T d) is 48 ms, and integration time (T int) is adjusted on 1 second per frame in our image acquisition mode. Images were obtained in fixed acquisition mode. In order to avoid saturation of the signal, total number of frames (n f) to be acquired to obtain an EPID image for a selected exposure X (MU) and fix dose rate 200 MU/minute is calculated from:
 $$n_{{\rm f}} ={\rm X}/[{\rm 2}00\:\;(T_{{{\rm int}}} {\plus}T_{{\rm d}} )] $$
In order to maintain a high quality EPID, recommended standard calibration procedure including brightness, contrast and exposure calibrations were performed according to the TheraView manual before the experiments and were not repeated during data collection. The source to detector distance (SDD), can be selected via manual control over a range of 40 cm, but for general clinical use it is kept fixed at 150 cm, so all measurements described below were performed at SDD of 150 cm. Maximum field of view of the system is 40×40 cm2 at the EPID level and ~26×26 cm2 at the isocentre level. The signal is integrated simultaneously in 1024×1024 pixels, each measuring 0·025×0·025 cm at the isocentre. Acquired electronic portal images (EPIs) were exported through DICOM export and all pixel value matrices were analysed using an in house code written in Matlab environment (MATLAB 7; Math Works Inc, Natick, MA, USA). Each EPI matrix was investigated in central point of EPID and 8 off axis points. In order to do this, nine 26×26 pixel matrixes were selected as regions of interest (ROI), the region represented by this pixel array is 1×1 and 0·65×0·65 cm2 at the EPID and isocentre level, respectively (Figure 1). This array size was chosen to minimise statistical fluctuation in pixel response with enough spatial resolution.Reference Mohammadi and Bezak16 Statistical analysis was performed with SPSS, version 14.0 (SPSS, Chicago, IL, USA), software. Level of statistical significance was adjusted for p-values <0·05.

Figure 1 The position of the nine regions of interest (ROI) selected for investigation of EPI physical characteristics, field size 10×10 cm2 at isocentre level.
All measurements were performed by 6 MV photon beam with fix dose rate of 200 MU/minute using a Siemens Primus linear accelerator (Siemens Medical Solutions, Erlangen, Germany). Linear accelerator (linac) output constancy is always an important part of a regular QA program. Linac output was calibrated following the IAEA TRS 398 protocolReference Andreo, Burns and Hohlfeld17 and checked daily, weekly and monthly using daily check device and ion chamber measurement in water tank, respectively.
System warm up time characteristics
The EPIDs require a warm up time before irradiation. In order to assess the warm up time, it was irradiated by 10×10 and 25×25 cm2 field size at isocentre level with 20 MU 60 minutes after power on for three times and the dose response of central ROI was analysed. This was repeated on several different occasions in a 2-month period.
Build-up
In order to determine the extra build-up thickness to obtain maximum pixel value for low and mid photon energies, variation of pixel values were investigated by placing 40×40 cm2 plates of poly-methylmethacrylate, and stainless steel thickness 0·5 and 1 mm directly on the EPID cover as build-up layer. Image acquisition was performed by 6 and 15 MV photon beams, and 10×10 cm2 field size.
Radiation dose history effects
The irradiation effect of the EPID was investigated by sequential acquisition of two images with an interval of <1 minute between acquisitions using the standard set-up previously described. Dose history effect of the EPID will manifest as an increase in the pixel value for the subsequent image. An image was acquired of the same geometry after several minutes had elapsed for comparison. Profiles across the images were compared to evaluate pixel values possible elevation due to dose history effect.
Linearity
To assess linearity of the EPID dose response, three integrated images of 2×2 and 10×10 cm2 field sizes were acquired. The monitor units used ranged from 2 to 200. EPID response was assessed in 2×2 and 10×10 cm2 area of central ROI.
Stability and reproducibility of electronic portal images
The stability and reproducibility of dose response must be well understood if EPIDs are to be used for dosimetry. Short-term and long-term reproducibility of EPID images were evaluated by repeating consecutive measurements every 10 minutes over a 1 hour period and every week over a 1 month period using the same geometry by delivering 20 MU for field size of 10×10 cm2 with additional 1 mm thick stainless steel slab placed on top of the EPID.
Field size dependence
Field size dependency of fluoroscopic EPID was investigated. This is important especially for small IMRT segments. Fields of various sizes 2×2, 4×4, 6×6, 8×8, 10×10, 14×14 and 18×18 cm2 were obtained three times at a constant dose rate of 200 MU/minute at a fixed dose of 20 MU without any extra build-up thickness.
Results
Warm up time
The variation in sensitivity of the TheraView EPID after power-on was assessed by making repeated 20 MU exposures at the described fixed geometry. Any variation in the EPID’s pixel value is significant for absolute dosimetry using an EPID system. The measurements indicate that the system should be left on for a period of at least 30 minutes otherwise, for a given dose, pixel value and brightness of image will be reduced, not conforming to the expected dose response of the system.
Build-up thickness evaluation
The new version of the TheraView EPID has an intrinsic 2·2 mm thick polystyrene plate covering the phosphor screen. This plate provides sufficient build-up for the photons and absorbs low energy scattered radiation that diminishes image quality. As a result, there is no need for extra build-up to increase the EPID dose response and pixel value. However, in order to achieve electronic equilibrium in the EPID’s sensitive layer, and also to reduce the detection of high energy electrons generated in the absorber, we used an additional 1 mm thick stainless steel slab on the fluorescent screen. As recent publications state, image quality is affected by the additional layer so acquired images can be suitable for patient set-up and portal dose verification.Reference Franken, De Boer and Heijmen10, Reference Pasma, Kroonwijk and De Boer13, Reference Pasma, Dirkx and Kroonwijk14, Reference Ali, Dirkx and Cools18
Dose history
The images of the 10×10 cm2 open fields acquired sequentially in 1 minute intervals showed that the degree of ghosting was at <0·1%. This result suggests that the dose history effect is not significant in this time interval between image acquisitions.
Linearity
The results of the linearity measurements for 2×2 and 10×10 cm2 central regions without any extra build-up layer are displayed in Figure 2. Statistical analysis of dose response linearity of the TheraView EPID provides pixel value to dose relationship. The best fit curves were determined by nonlinear regression of both set of data points. The dose response behaviour of the TheraView EPID is by far not ideal. We obtained the following logarithmic model for dose (D) and pixel value (P) as a function of pixel value:
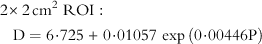 $$\eqalignno{{\rm 2}&{\times}{\rm 2\,cm}^{{\rm 2}} \ {\rm ROI}:\cr &\ {\rm D}={\rm 6} \!\cdot\! {\rm 725}{\,\plus\,}0 \!\cdot\! 0{\rm 1}0{\rm 57 \ exp}\,\left( {0 \!\cdot\! 00{\rm 446 P}} \right) $$
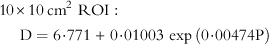 $$\eqalignno{{\rm 1}0&{\times}{\rm 1}0\,{\rm cm}^{{\rm 2}} \ {\rm ROI}: \cr &\ {\rm D}={\rm 6} \!\cdot\! {\rm 771}{\,\plus\,}0 \!\cdot\! 0{\rm 1}00{\rm 3 \ exp}\,\left( {0 \!\cdot\! 00{\rm 474 P}} \right)$$
Where, the coefficients of determination for the regression, R 2, were 0·985 for both set of data, indicating a fairly good relationship for the EPID dose response. This non-linear response of dose can be explained by trapped charge effects on pixel response, in agreement with Nijsten et al.Reference McDermott, Nijsten and Sonke19–Reference Nijsten, Van Elmpt and Jacobs21 observations, therefore an extra multiplied correction factor should be used to correct for a non‐linear response of the EPID to the absolute dose values.
Figure 2 The linearity test for the electronic portal imaging devices (EPID) in 2×2 and 10×10 cm2 areas of central region, the measurements are shown as symbols, and results of the nonlinear regression (solid line) are fitted to them. Monitor units used were: 2, 3, 5, 10, 20, 30, 40, 50, 60, 70, 80, 90, 100 and 200.
For linearity measurements, the EPID response was also compared with ion chamber response under similar measurement conditions. As a result, for >50 MU, response of the EPID did not has linearity as 2–50 MU (Figure 2), it can be concluded CCD camera of EPID saturated, and does not have linear relationship with dose, so linearity test should be investigated more accurately. Therefore, linearity test was repeated for field size of 10×10 cm2 for 2–50 MU irradiations. One mm stainless steel was used over the phosphor screen of EPID (Figure 3). The Linac output was linear down to 1 MU to within 0·1% as determined from ion chamber measurements.
Figure 3 The linearity test for the electronic portal imaging devices (EPID) in the center 2×2 cm2 area of central regions of interest (ROI) for field size of 10×10 cm2. The measurements are shown as symbols, and results of the polynomial 4 regression (solid line) are fitted to them. Monitor units used were: 2, 5, 10, 20, 30, 40 and 50.
A fourth order polynomial regression model generally predicts a response of the TheraView EPID to the absolute dose values at <50 cGy. Dose response of each 8 off axis ROIs are similar to the response of the central ROI. The regression coefficient (R 2) with quadratic expression fit was 0·9993.
 $${\rm D}={\rm A}_{0} {\plus}{\rm A}_{{\rm 1}} .{\rm P}{\plus}{\rm A}_{{\rm 2}} .{\rm P}^{{\rm 2}} {\plus}{\rm A}_{{\rm 3}} .{\rm P}^{{\rm 3}} {\plus}{\rm A}_{{\rm 4}} .{\rm P}^{{\rm 4}} $$
where A0=0·01954, A1=−0·00277, A2=3·6267E-5, A3=−3·80182E-8 and A4=1·47276E-11. Figure 4 shows the nonlinear response for all nine ROIs, central point and eight peripheral points at low MUs. The measurements of beam profiles at different MU are also plotted in Figure 5.
Figure 4 The variation of the electronic portal imaging devices (EPID) pixel values to the absolute dose values. The data for central point and eight peripheral points described in Figure 1 were acquired; each data point is the average of three consecutive measurements.
Figure 5 Dose profiles of charged coupled device (CCD) camera-based electronic portal imaging devices (EPID) for open field in a 10×10 cm2 field at different monitor units (MUs): 2, 5, 10, 20, 30, 40 and 50.
Reproducibility
The mean pixel values of short and long terms reproducibility tests for central point and eight peripheral points are plotted against number of use (Figure 6). Also, mean, max and minimum pixel values of central ROI are plotted in Figure 7. The reproducibility and stability of the measurements are excellent and maximum standard deviation is <0·3%.
Figure 6 The mean pixel values of short-term and long-term reproducibility test for central point and eight peripheral points against number of use.
Figure 7 The variation of minimum, mean and maximum pixel values of consecutive electronic portal imaging devices (EPID) images on the 2×2 cm2 area of central regions of interest (ROI) as a function of number of use.
Field size dependence
The EPID pixel values for various field sizes are shown in Figure 8. For each field size, response was measured at the centre of radiation field averaged over 52×52 pixels covering a 2×2 cm2 area. The measured dose values are normalised to the dose measured for 10×10 cm2 field. Relative pixel values varied from 0·876 to 1·13 for the 2×2 and 18×18 cm2 field sizes, respectively. The regression analysis was assessed by SPSS software, and the cubic equation is shown. The least squares fit shows that the cubic relationship between field size and EPID response is good down to the lowest delivered dose with a regression coefficient of 0·9996.
 $${\rm P}={\rm A}_{0} {\plus}{\rm A}_{{\rm 1}} .{\rm D}{\plus}{\rm A}_{{\rm 2}} .{\rm D}^{{\rm 2}} {\plus}{\rm A}_{{\rm 3}} .{\rm D}^{{\rm 3}} $$
where A0=0·82286, A1=0·02788, A2=−0·0009, A3=2E–5. Figure 9 shows a comparison between open field profiles of various field sizes for the same dose.
Figure 8 The field size response for square field sizes varies from 2×2 and 18×18 cm2. Central regions of interest (ROI) measurements are shown as symbols; results of the cubic regression (solid line) are also shown.
Figure 9 Relative open field profiles of electronic portal imaging devices (EPID) for various field sizes delivered by 20 MU.
Conclusion
Dosimetric properties of the TheraView fluoroscopic EPID for transit dosimetry were assessed. As a result, for stable operation of the detector, warm up period of 30 minutes is necessary, and there is no need for extra build-up layer to increase the dose response. The reproducibility and stability of the measurements are excellent and the detector showed similar signal with a maximum deviation of <0·3% in short and long term. This accurate response reproducibility is a prerequisite for precise portal dosimetry. Increasing the dose values causes saturation of the CCD camera of the EPID, which does not have linear relationship with dose. The nonlinearity of the camera response can be corrected for using a cubic expression with a R 2 of 0·9996. In the latest version of EPID software, this correction is applied directly after acquisition of each image frame to each individual pixel value, providing maximum accuracy for dosimetric purposes.
We have found that the CCD camera-based EPID is feasible to use for portal dosimetry applications. However, energy, dose value, integration time of image acquisition mode and field size correction should be taken into account.
Acknowledgements
The authors would like to thank Madjid Boostani for many kindly cooperation, and Pars RT centre for aid in data collection.

