


INTRODUCTION
In external beam radiotherapy of the prostate, magnetic resonance (MR) imaging (MRI) is considered to be the gold standard imaging modality for prostate delineation and disease staging.Reference Fütterer, Barentsz and Heijmink 1 , Reference Murphy 2 Compared with conventional CT, MR provides much better soft tissue contrast of the prostate, the surrounding normal tissues and organs at risk (OARs). In CT, identifying the prostate boundaries is challenging, whereas in MRI the boundaries of the prostate as well as the peripheral zone and central gland can be identified.Reference Schmidt and Payne 3 With the development of more advanced radiotherapy treatment planning, such as intensity-modulated radiation therapy (IMRT) and stereotactic body radiotherapy, the desire for more accurate localisation of tumours before and during the treatment delivery has increased, ensuring that the higher tumour dose is achieved while reducing the dose to OARs and normal tissues. This can be achieved by the use of the cone-beam CT (CBCT) imaging system which is integrated in the Linac, providing 3D volumetric images before or during the treatment delivery.Reference Jaffray and Siewerdsen 4
However, despite its major improvement in image-guided radiotherapy (IGRT), the image quality of CBCT images makes it hard to accurately identify the prostate, due to the increased amount of scatter.Reference Fotina, Hopfgartner, Stock, Steininger, Lütgendorf-Caucig and Georg 5 – Reference Almatani, Hugtenburg, Lewis, Barley and Edwards 7 More importantly, the CBCT imaging dose limits the frequency with which this technique can be used.Reference Kan, Leung, Wong and Lam 8 For these reasons, the MRI system has been recently integrated in the linac system for offline/online treatment guidance, such as the MRI-Linac, and in the Cobalt source unit as ViewRay, and installed in the treatment room as the MR-on-rails.Reference Lagendijk, Raaymakers and van Vulpen 9 – Reference Stanescu, Tadic and Jaffray 11 For a highly mobile and challenging target, such as a prostate, MRI allows more accurate localisation of the prostate and intraprostatic lesions, as well as real-time imaging during beam delivery and thus provides information for adaptive radiotherapy (ART).Reference Schmidt and Payne 3 Therefore, MRI can potentially manage inter- and intra-fraction motions. This would potentially decrease the clinical target volume (CTV)-to-planning target volume (PTV) margin and increase the confidence of boosting the target dose using fewer treatment fractions.Reference Eilertsen, Vestad, Geier and Skretting 12 , Reference Kerkmeijer, Fuller and Verkooijen 13
Despite its excellent soft tissue contrast, there are factors that can limit the implementation of some MRI platforms into the radiotherapy process. These factors include cost, system-related and patient-related geometric distortions.Reference Schmidt and Payne 3 , Reference Raaymakers, Raaijmakers, Kotte, Jette and Lagendijk 14 , Reference Lagendijk, van Vulpen and Raaymakers 15 One of the main factors that limits the use of MRI-only treatment planning and the MRI-only simulator is that MRI do not provide Hounsfield units (HU) and the intensity or voxel values are not directly related to electron densities (ED). Therefore, if there are significant on-treatment patient shape changes observed on the MRI, as an IGRT tool in an MRI-Linac, acquiring another CT is necessary for an accurate assessment of dose differences (DD). This procedure is time consuming across all staff groups involved in the radiotherapy pathway and additional dose is delivered to the patients.
There are different approaches to convert the voxel values of MRI into HUs to produce pseudo-CT images, also known as substitute CT or synthetic CT.Reference Korhonen, Kapanen, Keyriläinen, Seppälä, Tuomikoski and Tenhunen 16 – Reference Hsu, Cao, Huang, Feng and Balter 18 One of these approaches uses a CT-based ED atlas with non-rigid registration to transfer CT ED to MRI.Reference Dowling, Lambert and Parker 19 , Reference Andreasen, Van Leemput and Edmund 20 For prostate cancer patients using this approach, the DD between the pseudo-CT and planning CT (pCT) is within 2%.Reference Dowling, Lambert and Parker 19 A limitation of this approach is that it can be time consuming for multiple atlas and lead to greater uncertainty if the patient is dissimilar to the database used for the atlas.Reference Andreasen, Van Leemput and Edmund 20 , Reference Keereman, Fierens, Broux, De Deene, Lonneux and Vandenberghe 21
Another approach for converting voxel values in MRI into HUs is by segmenting MRI into a number of materials and subsequently applying bulk density assignment. In this approach, the whole body can be considered as water-only or water and air materials.Reference Schmidt and Payne 3 Lambert et al.Reference Lambert, Greer and Menk 22 showed that the bone region should be included for a more accurate dose calculation in the pelvic region. However, bone regions and boundaries are hard to visualise in conventional or standard MRI (T1 or T2 weighted), which is the standard sequence for diagnosis, due to the low proton densities in these regions and short T2.Reference Keereman, Vanhove and Vandenberghe 23 , Reference Korhonen, Kapanen, Keyriläinen, Seppälä and Tenhunen 24 Therefore, it is hard to differentiate between air, lung and bone regions. To separate bone voxels, additional MR sequences are used, such as ultra-short echo times or T1/T2* weighted.Reference Johansson, Karlsson and Nyholm 17 , Reference Kapanen and Tenhunen 25 However, these MR sequences may increase signal-to-noise ratio at tissue interfaces, and consequently lead to greater uncertainty in the conversion to HUs. In addition, these extra MR sequences are time consuming and are not used in clinical radiotherapy.Reference Andreasen, Van Leemput and Edmund 20 , Reference Keereman, Fierens, Broux, De Deene, Lonneux and Vandenberghe 21 The bone regions can be manually or automatically contoured and then assigned with different HUs, while soft tissues are converted to HUs using dual model conversion techniques.Reference Korhonen, Kapanen, Keyriläinen, Seppälä and Tenhunen 24 , Reference Koivula, Wee and Korhonen 26 This approach, excluding the water-only method, resulted in a dose accuracy of 1–3%.
The aim of this study is to convert voxel values in MRI into HUs by segmenting MRI into a number of materials using the multilevel threshold (MLT) algorithm. The MLT algorithm has been used to enable dose calculation to be performed on CBCT images by the authors previously, even for more challenging circumstances as for a prostate patient with hip prostheses.Reference Almatani, Hugtenburg, Lewis, Barley and Edwards 6 , Reference Almatani, Hugtenburg, Lewis, Barley and Edwards 7 This method does not require database, as for the atlas approach, nor extra non-clinical MR sequence. Furthermore, the effect of the segmentation process on the dose calculation algorithm accuracy is investigated using the treatment planning system pencil beam (PB) and collapsed cone (CC) algorithms and Monte Carlo (MC) modelling. With the simplicity of this approach, it can be used as a fast decision-making, dosimetric, tool regarding on-treatment patient shape changes and whether a new CT is required. It is envisaged that the method can be applicable for the automation of dose calculation on segmented MR (sMR) images and could be of interest to MR-based ART.Reference Almatani, Hugtenburg, Lewis, Barley and Edwards 7 , Reference Dunlop, McQuaid and Nill 27
MATERIALS AND METHODS
Patient study
This study was performed on a patient with prostate cancer (high risk) treated at the Department of Clinical Oncology and Radiotherapy, South West Wales Cancer Centre, ABM University Health Board, Swansea, Wales. An IMRT treatment with five 6-MV photon fields, at gantry angles of 180, 100, 35, 260 and 325° was performed. Dose distribution was calculated using the Oncentra MasterPlan (OMP) treatment planning system (version 4.3; Elekta, Best, Netherlands), PB and CC algorithms, to allow the comparison with MC algorithm and to identify the effects of HU on dose calculation.
CT and MRI acquisition
The pCT images of a patient with prostate cancer was acquired using a Philips Brilliance Big Bore CT scanner (version 2.3; Philips Medical Systems, Cleveland, OH, USA). The pCT images were acquired with 120 kVp and the tube current was modulated during the scan based on patient anatomy. The matrix size of the reconstructed images was 512×512 and voxel sizes were 1·19×1·19×3 mm3. The acquisition of the MRI of the patient was performed with the T2-weighted sequence using the Toshiba scanner (1·5 T, Toshiba Atlas, Tokyo, Japan), with a flat table as in the CT simulator. This acquisition sequence is the standard sequence used in the local department for prostate localisation and delineation. The matrix size of the reconstructed MRI was 512×512 and the voxel sizes were 0·74×0·74×5 mm3.
Modification of MRI
As mentioned before, acquiring MRI with the conventional or standard sequence produces images with no contrast between bone and air (Figure 1b). In addition, the femoral heads are mostly composed of bone marrow tissue, which has a wide intensity range due to the proportions of adipose and water.Reference Korhonen, Kapanen, Keyriläinen, Seppälä and Tenhunen 24 Therefore, it is challenging to accurately contour bone regions. However, MATLAB (version 2013a; Mathworks, Natick, MA, USA) scripts were developed so that contours could be drawn on the MRI. There were five contours drawn (defined by the user and associated with its uncertainties in defining bone region boundaries) on the MRI to enable accurate bone representation, and to isolate bone tissue from the surrounding adipose and water tissues, as shown in Figure 1b. This was done for each MR slice (total of 24 slices), and the operator time was about 2 hours. In each region of interest, the MLT algorithm (using a MATLAB script) was applied to convert voxel values into CT numbers that are comparable with the pCT to generate sMR images (Figure 1c). These assigned CT numbers are based on the local fixed HU–ED calibration. Thus, for a wider patient group, the same assigned CT numbers would be used for the same materials. Furthermore, an additional contour was drawn as a body contour around the patient. To reduce manual delineation or contouring time, regional coordinates were written in the MLT algorithm that were expected to encompass the whole rectum, through all the slices (Figure 1c). Any voxel inside this region only with a range voxel value between 0 and 110 was considered as air with –976 HU otherwise they were considered as water with 0 HU. Any voxel inside the bone contours, and outside the rectum region, with a range value between 0 and 1,150 was considered as bone with 528 HU, otherwise they were considered as water. Any voxel inside the body contour and outside both the bone contours and the rectum region was considered as water. Moreover, as shown in Figure 1, there is a missing volume laterally in the MRI, so the external contour of the MRI was copied onto the pCT and any voxel outside this contour was considered as air, thus matching the field of view between the two scans. Even though the cropped pCT and sMR images are not clinically acceptable, this is a feasibility study and the general concept of segmenting MRI still holds. This method does not require additional MR sequences that are not used in clinical radiotherapy, which is time consuming. Finally, to enable dose calculation to be performed within sMR images using OMP, the Digital Imaging and Communications in Medicine (DICOM) tags were modified to match pCT DICOM tags, otherwise OMP calculates the dose with overriding the density.
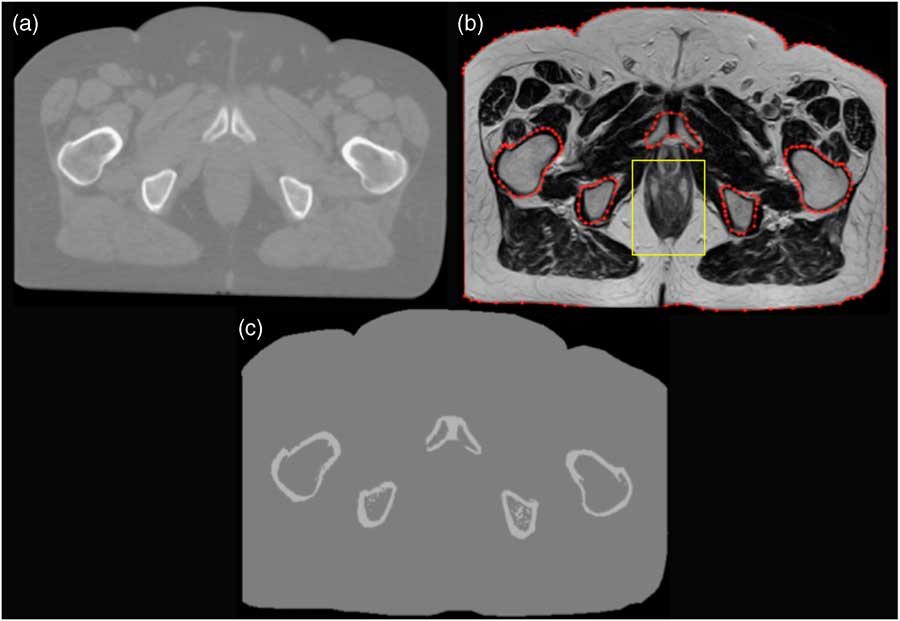
Figure 1 A prostate patient scan using (a) planning CT, (b) magnetic resonance (MR) and (c) the resultant image after segmenting MR (sMR).
MC calculation
The Elekta Synergy linear accelerator was modelled using Electron Gamma Shower (EGSnrc), which is one of the most popular MC codes for medical physics.Reference Kawrakow and Rogers 28 BEAMnrc and DOSXYZnrc are two applications in EGSnrc code that are used to simulate the beam generated from the treatment head and to score dose deposition in voxel grids, respectively. An automated procedure was developed and applied to the DICOM-Radiation Therapy file to extract the treatment plan parameters, using a MATLAB script, and then convert and write them in a MC-format input file (egsinp file) for BEAMnrc and DOSXYZnrc, separately. In this study, 80 million particles were used for each beam to provide an accurate simulation with a low (<2%) statistical uncertainty. High-performance computing (HPC-Wales 29 ) was used to speed up MC calculations. The MC normalisation was performed by calculating the dose in a water phantom under the standard reference conditions (10×10 field size, 100-cm source-to-surface distance, 5-cm depth). There is a 95% chance of the MC model being within the error bars.
Treatment planning evaluation and comparison
The fusion of the sMR and pCT images was accomplished with manual rigid registration using ProSoma software (v3.3; MedCom, Darmstadt,Germany). The pCT images were resampled to the sMR images to enable direct comparison of dose calculations. The resultant pCT dataset contained 24 slices with a voxel size of 0·74×0·74×5 mm3. The structure sets were then transferred to the sMR images without any modification except the external contour. The plans were then copied to sMR using the same geometry and monitor unit values and the doses were recalculated using PB, CC and MC algorithms. The MC dose calculation was then performed on pCT and sMR images using the same HU–ED calibration as in OMP. The MC dose file (3ddose) and the DICOM-RT file were then imported into the computational environment for radiotherapy research (CERR) software to compare the resultant dose distribution. The CTV comprises the prostate, and involved seminal vesicles, and was increased by a 1 cm anterior, left, right, superior and inferior margin and 0·5 cm posterior margin to give the PTV. For the rectum, the circumference of the rectum was outlined in its entirety and included the faecal contents. The entire bladder was outlined and the outside of the bladder wall was included. The femoral heads, both left and right, were outlined to the bottom of the curvature of their heads. The dose–volume histograms (DVHs) were generated for PTV, rectum, bladder and left and right femoral head structures, and compared between pCT and sMR plans. The coverage of the PTV, the dose to 95% of the PTV (D95%) and the mean dose (D mean) were compared. The relative volume doses to the rectum and bladder (V60) and to the left and right femoral heads (V35) as well as the mean dose (D mean) were compared. The DDs are quoted as percentages of local values. In addition, the Student’s t-test (using MATLAB) was performed in the mean value of dose in the PTV, rectum, bladder and left and right femoral heads. To quantitatively appraise the differences between pCT and sMR plans, especially for the structures mentioned above, a gamma index analysis was performed using the pCT plan as a reference. The criteria were set as 3 mm distance to agreement and 3% DD and 5% low dose threshold. Finally, dose at the isocentre (at the geometric centre of the prostate PTV) was compared between the pCT and sMR plans.
RESULTS AND DISCUSSION
Figure 2 shows the DVH of the prostate IMRT plan with a prescription dose of 60 Gy in 20 fractions. It shows the dose of the pCT and sMR plans to the PTV, rectum, bladder, right and left femoral heads using the CC algorithm.
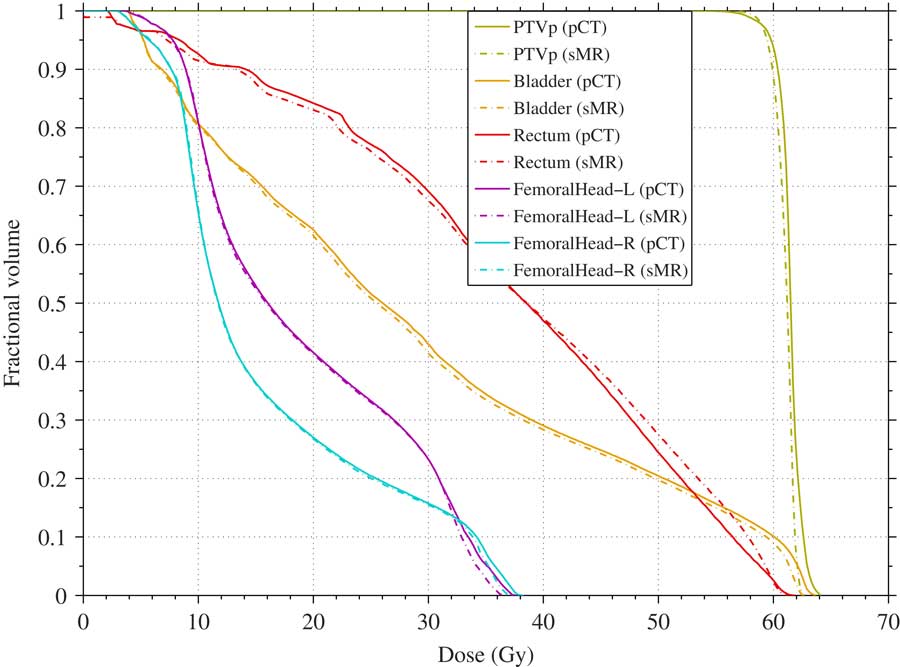
Figure 2 Dose–volume histogram comparison between planning CT (pCT; solid) and segmented magnetic resonance (sMR; broken) plans for planning target volume (PTV), rectum, bladder, and left and right femoral heads using collapsed cone algorithm (prescription dose 60 Gy).
It can be seen that the sMR plan is in a good agreement with the pCT plan. In general, the sMR plan slightly underestimated the dose to all the structures when using all algorithms. There are some differences and outlines but the general trend holds. The largest differences were found in the rectal volume receiving 60 Gy where it was underestimated by –56, –17 and –66% when using PB, CC and MC algorithms, respectively, as shown in Table 1. This may be due to the fact that the air/gas pocket volume in the rectum in the sMR was less than in the pCT. This rectal volume difference between sMR and pCT scans may be due to a real difference in the rectum volume between the two scans. Another reason for the rectal volume difference may be due to the threshold method, where the partial volume in the rectum was considered either air or water based on the threshold values. For the left and right femoral heads, the largest difference was found for the left femoral head volume receiving 35 Gy where it was underestimated by –31 and –49% when using PB and CC algorithms, respectively. However, these findings show that the MLT algorithm used in this study to segment MRI resulted in a dose calculation that is comparable with the pCT.
Table 1 Dose and coverage differences between planning CT (pCT) and segmented magnetic resonance (sMR) plans for the planning target volume (PTV), rectum, bladder and left and right femoral heads

Notes: The dose to 95% of PTV and mean dose and the percentage of rectal and bladder volumes receiving 60 Gy and the percentage of left and right femoral head volumes receiving 35 Gy.
Abbreviations: PB, pencil beam; CC, collapsed cone; MC, Monte Carlo algorithm; PVAL, p-value; D95, dose to 95% of the PTV; D mean, mean dose; V35 and V60, volumes receiving 35 and 60 Gy.
Table 1 shows the Student’s t-test (last column) results against the hypothesis that the mean value of dose in the PTV, rectum, bladder and left and right femoral heads for sMR plans differ. For the PTV, the results show that there is no support for a difference in the mean dose, but with poor confidence (p=0·08). Only in the case of the bladder is support (p=0·008) for a small difference in the mean.
Table 2 shows the γ index evaluation for the calculation points falling inside the PTV, rectum, bladder and right and left femoral heads for the sMR plan using PB, CC and MC algorithms. The results are shown as the percentage of calculation points resulting in γ≤1. As mentioned before, there was a difference in the rectal volume between the pCT and sMR. This difference resulted in 84, 82 and 81% of the calculation points passed the test, for the rectum region, when using PB, CC and MC algorithms, respectively. For the left and right femoral head regions, almost all calculation points passed the 3%/3 mm criteria when using PB, CC and MC algorithms. This shows that the MLT algorithm correctly replaced the voxel values with bone HU value, with an acceptable level of accuracy.
Table 2 Summary of the γ index with fixed distance to agreement=3 mm and dose difference=3% for the calculation points falling inside the planning target volume (PTV), rectum, bladder and right and left femoral heads
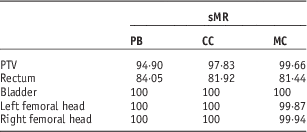
Notes: It shows the percentage of points resulting with γ≤1.
Abbreviations: sMR, segmented magnetic resonance; PB, pencil beam; CC, collapsed cone; MC, Monte Carlo algorithm.
Table 3 shows the dose, in Gy, of the pCT and sMR plans at the isocentre (the geometric centre of the prostate PTV) using PB, CC and MC algorithms. The segmentation of MRI using the MLT algorithm used in this study resulted in a DD of –0·3, 0·8 and –1·3% when using PB, CC and MC algorithms, respectively. This is expected as the PB algorithm in OMP calculates dose to water, whereas the CC algorithm calculates dose to medium as does the MC algorithm.30 Therefore, the PB algorithm would be less sensitive than CC and MC algorithms. However, this showed that sMR plan resulted in differences of less than –2% compared with the pCT plan when using all algorithms, which is considered to be clinically acceptable. As a result, this segmentation technique is applicable for MRI and can be used as a quick-decision-making tool for re-planning regarding on-treatment patient shape changes and whether a new CT is required. The operator time associated with this technique would be greatly reduced (~10–15 minutes) with automation, which is currently being investigated. Reduction of ~95% was achieved with an automated MLT algorithm that developed for segmenting CBCT images.Reference Almatani, Hugtenburg, Lewis, Barley and Edwards 7 However, compared with the proposed technique in this paper, acquiring a new CT is more time consuming, increase work load on physicists, physicians and radiographers, which can take up to a day in a busy radiotherapy department, and more importantly additional dose is delivered to the patient.
Table 3 Dose comparison between planning CT (pCT) and segmented magnetic resonance (sMR) plans at the isocentre using pencil beam (PB), collapsed cone (CC) and Monte Carlo (MC) algorithms

CONCLUSION
The segmentation and conversion of MRI into HU/ED data using the MLT algorithm used in this study can be used for dose calculation. The MRI were segmented into three materials mainly air, water and bone. The bone regions were contoured to isolate bone tissue from the surrounding tissues before the segmentation process. The sMR images provide accurate dose calculations with differences of <2%. The simplicity of this method makes it easier to be implemented into the clinic. Therefore, this method can be used as a dosimetric assessment tool and can be of interest to MRI-only-based radiotherapy treatment planning and MR-based ART.
Acknowledgements
The authors gratefully acknowledge the staff of the Department of Medical Physics and Clinical Engineering, ABMU for their assistance in this study. The Ministry of Higher Education of Saudi Arabia and Umm Al-Qura University provided sponsorship for T. A.


