


Introduction
Nearly 12,900 new cases of uterine cervix cancer are diagnosed annually in the United States with 4,100 estimated deaths. 1 The combination of external beam radiation and intracavitary brachytherapy (ICBT) is the standard of care for the definitive treatment of locally advanced cervix carcinoma. The additional radiation dose delivered by ICBT after external beam radiotherapy to the whole pelvis is critical in achieving cure.Reference Klopp and Eifel 2 High-dose-rate (HDR) and low-dose-rate (LDR) brachytherapy seem to be clinically equivalent treatments according to survival outcomes from existing retrospective and prospective studies.Reference Stewart and Viswanathan 3 , Reference Patel, Sharma and Negi 4 HDR brachytherapy brings a practical advantage as it provides opportunities for outpatient treatment, dose optimisation and better radiation safety control, and has significantly replaced LDR brachytherapy in many radiation centres.
Several dosimetry systems were designed to guide implant procedures and report dose specification for brachytherapy treatment of cervical cancer. The Manchester dosimetry system is one of the most extensively used in clinics worldwide due to its simplicity and reproducibility. In the Manchester system, orthogonal X-ray views of the pelvis are used to define reference points, such as ‘Point A’ and radiation dose is prescribed to this reference point. Point A was originally defined as a point located 2 cm superior to the lateral vaginal fornix and 2 cm lateral to the cervical canal. This definition was later modified as a point located 2 cm superior to the external cervical os and 2 cm lateral to the cervical canal.Reference Tod and Meredith 5 , Reference Tod and Meredith 6 International Commission in Radiation Units and Measurements Report Number 38 (ICRU-38) published in 1985 7 discussed dose and volume specifications for reporting ICBT and was widely accepted clinically. The Manchester system and ICRU-38 report involved 2D treatment planning utilising orthogonal radiographs to define Point A and other critical organ at risk (OAR) reference points.
With recent advances in imaging technology and 3D treatment planning systems, clinical dose prescription is transitioning away from 2D/Manchester approaches towards 3D/volumetric approaches where adequate dosimetric coverage of a clinical target volume (CTV) is evaluated.Reference Viswanathan and Erickson 8 For example, a proposed goal for 3D image-guided conformal brachytherapy treatment is for 90% of the high-risk CTV (HR-CTV D90) to receive the prescribed dose.Reference Kirisits, Potter and Lang 9 In 2000, Gynecological European Group of Curietherapie European Society for Therapeutic Radiology and Oncology (GEC-ESTRO) created a working group and decided to support 3D imaging-based 3D treatment planning approach in cervix cancer brachytherapy.Reference Potter, Haie-Meder and Van Limbergen 10 The second part of the GEC-ESTRO working group presented the formulated recommendations transiting from traditional 2D approach to 3D image-based therapy for cervix cancer.Reference Potter, Haie-Meder and Van Limbergen 11 American Brachytherapy Society (ABS) presented its recommendation in 2011, published in 2012, and supported GEC-ESTRO guidelines.Reference Nag, Erickson and Thomadsen 12 , Reference Viswanathan and Thomadsen 13 However, ABS and GEC-ESTRO continue to recommend the recording of conventional Point A doses during 3D image-based treatment planning, at least during this ongoing transition period.Reference Viswanathan, Beriwal and Santos 14 , Reference Anderson, Huang and Kim 15
The purpose of this study is to investigate a large series of patients treated with HDR-ICBT, comparing dosimetric characteristics of both 2D/Manchester and 3D/volumetric treatment planning approaches.
Material and Methods
Treatment plans of 25 patients, 5 fractions/patient; total of 125 plans, with carcinoma of the uterine cervix treated between January 2009 and January 2013 were evaluated in this study. All the patients received initial whole pelvis external beam radiation therapy to a dose of 45 Gy in 25 fractions, 5 fractions/week over a period of 5 weeks with concurrent cisplatin-based chemotherapy, followed by 5 fractions of HDR-ICBT using a computed tomography (CT)-magnetic resonance imaging compatible Fletcher applicator set (tandem/ovoid or tandem/ring) from Varian Medical Systems. The radiation dose was prescribed to Point A, in the range of 4·0–6·0 Gy/fraction. The Varian Brachyvision treatment planning system (Varian Medical Systems, Palo Alto, CA, USA) was used to perform treatment plans using volumetric CT images with slice thickness of 3·0 mm, obtained for each application. Treatment was administered using an Ir-192 remote afterloader (VariSource; Varian Medical Systems). Figure 1 and 2 shows Point A and Point abs representation on a tandem and ovoid and tandem and ring applicator set respectively.
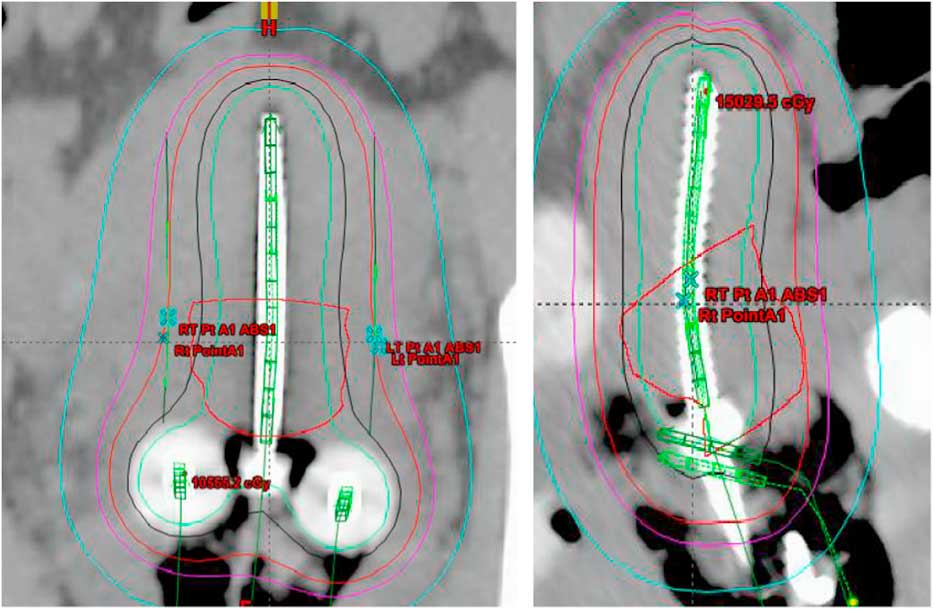
Figure 1 Point A and Point A abs representation on a tandem and ovoid applicator.
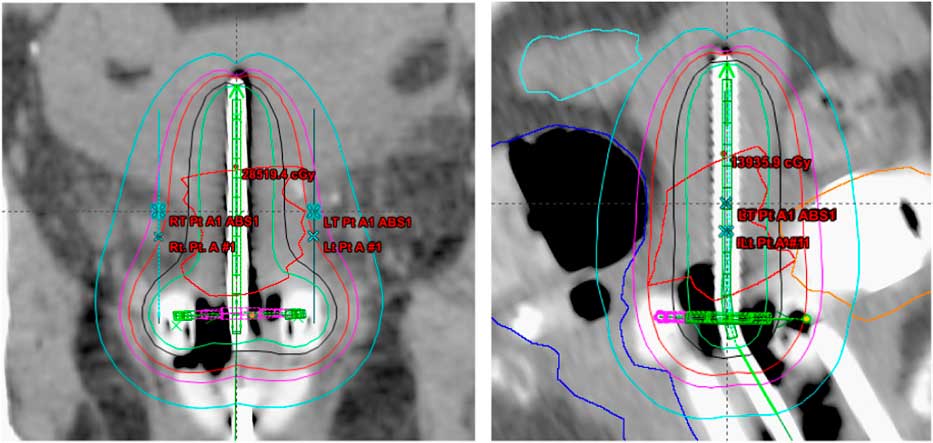
Figure 2 Point A and Point A abs representation on a tandem and ring applicator set.

Figure 3 Plot between normalized Point A and normalized Point AABS doses.
The first HDR-ICBT implant was performed using general anaesthesia in a hospital’s operating room by the radiation oncologist. A Smitt sleeve was implanted during first HDR-ICBT procedure to facilitate subsequent outpatient treatment. Anterior and posterior vaginal packing was used during each implant to displace bladder anteriorly and rectum posteriorly, respectively, to minimise their doses. A Foley catheter with the balloon insufflated with 7 cc of radio-opaque contrast material was used for determination of an ICRU bladder reference point. CT datasets were acquired such that the scan would include at least 3–4 cm margin superior to the proximal tandem position and would include the entire implant inferiorly.
All plans were created using a Manchester/Point A approach and ICRU-38 guidelines, and HR-CTVs were contoured by the attending physician. Preset pelvis window/levelling CT parameters were used to maintain consistent contouring conditions for all treatment plans. The entire bladder wall and rectum were manually contoured, with the bladder wall including the balloon with contrast and the rectum contoured from anorectum to rectosigmoid junction. The sigmoid colon was contoured from the rectosigmoid junction to about 2 cm above the tip of the central tandem. Care was taken to insure that the sigmoid was contoured adjacent to or above the uterus near the implanted brachytherapy applicator, when applicable. OARs were contoured by a single person to avoid interobserver variation.
We performed dosimetric and dose volume histogram (DVH) analysis for HR-CTV and OARs. Radiation dose distribution using Manchester/Point A approach (‘Point A plan’) was compared with radiation dose distribution using ABS 2011/Point A approach (‘Point AABS’) and 3D/volumetric approach. The HR-CTV D90 dose, coverage index and OAR for rectum and bladder were also evaluated. ICRU reference OAR doses were compared with D2cc and D0.1cc.
In addition, we determined the dosimetric impact when translating from a 2D/Manchester planning approach to a 3D/volumetric planning approach. Statistical analysis was performed using Student unpaired t-test analysis. t-Test results were calculated using online software.
Results
Point A, Point A abs and D90
Doses to the original Manchester/Point A plan and ABS/Point A plan were compared and recorded bilaterally. A mean Point A dose was calculated for left and right points, and is normalized to the prescription dose. Figure 3 represents the best-fit linear regression line between Manchester/Point A and Point A abs doses, normalized to the prescription dose, with a slope of 1·644, an intercept on y-axis of –0·689 and correlation coefficient of 0·141. The mean prescription dose is 5·51 Gy with SD 0·71 Gy. The mean dose and SD for Point A plan and Point A abs are 5·503±0·68, 5·24±1·06Gy, respectively.
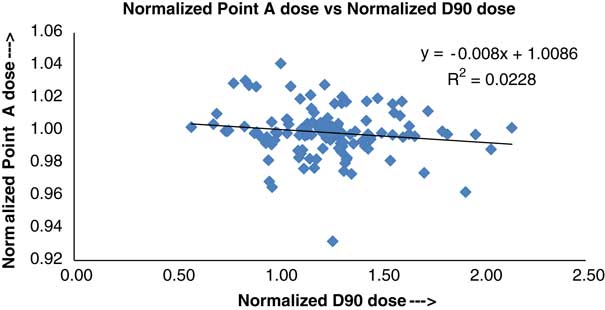
Figure 4 Plot between normalized Point A and normalized D90 doses.
Figure 4 shows a plot between Manchester/Point A and D90 doses, to the prescription dose, plotted using the method of best-fit linear regression. The slope, intercept on vertical axis and correlation coefficient, of the best-fit linear regression line, are found to be −0·008, 1·0086 and 0·0228, respectively. In Figure 4, the Manchester/Point A plan was the original plan used for the treatment, whereas D90 is based on HR-CTV contour and represents the volume dose rather than a point dose. The mean dose and SD for D90 are 6·78±0·54 Gy.

Figure 5 V100 (coverage index) versus high-risk clinical target volume (HR-CTV).
Coverage index versus HR-CTV analysis
For this study, coverage index was defined as the ratio between V100 and HR-CTV. HR-CTV mean volume and SD are 24·61±13·93 cc. V100 mean volume and SD are 22·23±9·33 cc. Figure 5 represents a plot between V100 and HR-CTV, representing the best-fit regression line with a slope of −0·0047, intercept on vertical axis of 1·0686 and correlation coefficient of 0·8339.

Figure 6 Plot between normalized D90 versus high-risk clinical target volume (HR-CTV).
D90 dose versus HR-CTV analysis
Figure 6 shows a power curve between normalised D90 and HR-CTV, with a coefficient of 4·56, power index of −0·423 and correlation coefficient of 0·756. The plotted curve compare normalized D90 and HR-CTV, and demonstrate a better power fit and shows as HR-CTV increases the tumour coverage decreases.

Figure 7 Plot between bladder International Commission in Radiation Units and Measurements (ICRU) reference point dose and D2cc dose.
OAR analysis
Bladder: ICRU point dose versus D2cc and D0.1cc dose
Figures 7 and 8 are the plots, plotted using the least-square fit method, between the bladder ICRU reference point dose versus bladder D2cc, and the bladder ICRU reference point dose versus bladder D0.1cc, respectively. The mean bladder ICRU reference point dose, D2cc and D0.1cc were found to be 3·47±1·04 Gy (95% confidence interval 3·284−3·659 Gy), 3·81±1·09 Gy (95% confidence interval 3·623−3·998 Gy) and 5·17±1·58 Gy (95% confidence interval 4·935−5·406 Gy), respectively.

Figure 8 Plot between bladder International Commission in Radiation Units and Measurements (ICRU) reference point dose and D0.1cc dose.

Figure 9 Plot between rectum International Commission in Radiation Units and Measurements (ICRU) reference point dose and D2cc rectum dose.
Rectum: ICRU point dose versus D2cc and D0.1cc dose
Figures 9 and 10 represent the best-fit plots, plotted using least-square fit method, between the rectum ICRU reference point dose versus rectum D2cc, and the rectum ICRU reference point dose versus rectum D0.1cc, respectively. Mean rectum ICRU reference point, D2cc and D0.1cc doses were 3·19±0·702 Gy (95% confidence interval 3·064−3·314 Gy), 2·87±0·72 Gy (95% confidence interval 2·748−2·998 Gy) and 3·78±0·98 Gy (95% confidence interval 3·627−3·928 Gy), respectively.

Figure 10 Plot between rectum International Commission in Radiation Units and Measurements (ICRU) reference point dose and D0.1cc dose.
Discussion
We are in a time of transition from Manchester/2D to 3D/volumetric and image-guided treatment approaches for conformal HDR cervical brachytherapy. ABS 2011 recommendations clearly define the target dose (HR-CTV) and OAR specifications for volumetric and point-based prescriptions and provide a practical and reproducible definition for Point A using imaging-based treatment.Reference Anderson, Huang and Kim 15 However, these recommendations do not describe the varying results seen with Manchester/2D and 3D/volumetric treatment planning approaches.
In this study, we found that the mean dose difference between the 2D/Manchester planning approach and the ABS/Point A planning approach was <5% with a maximum dose variation up to 15%. These findings are comparable with the study of Anderson et al.Reference Anderson, Huang and Kim 15 in which it was reported that the mean variation between Manchester/Point A plans and 3D/volumetric plans was <2%, with maximum variation up to 11–12%. The D90 and Point A doses had significant difference with an average dose difference up to 25%. This may be because D90 provides volumetric coverage of target anatomy independent of individual patient geometry, whereas Point A doses are directly and arbitrarily correlated with individual patient geometry and not necessarily target anatomy. For large tumours Point A can fall inside the HR-CTV and receive very high dose, whereas for smaller tumours it can be positioned outside the HR-CTV and receive correspondingly lower dose. Similar findings were observed by Lindegaard et al.,Reference Lindegaard, Potter and Limbergen 16 who studied 3D/conformal treatment plans from 72 patients with locally advanced cervical cancer and also evaluated D90 as a function of HR-CTV. They also identified that D90 decreases with increasing HR-CTV. Furthermore, their study found that image-based DVH analysis of standard Point A prescription approaches resulted in highly variable target doses (HR-CTV D90) ranging from 52 to 160% of the prescription dose.Reference Lindegaard, Tanderup, Nielsen, Haack and Gelineck 17 This was felt to be primarily influenced by inverse square law. Our findings are in agreement with their findings.
Mean rectal D2cc dose was significantly different from the mean dose calculated at ICRU reference point. Mean ratio of D2cc rectum to D ICRU point was calculated as 0·90. Hashim et al.Reference Hashim, Jamalludin and Ung 18 reported mean ratio of D2cc rectum to Dmax rectum as 0·98.
Mean bladder D2cc dose was significantly different from the mean dose calculated at ICRU reference point. Mean ratio of D2cc bladder to D ICRU point was calculated as 1·10. Hashim et al.Reference Hashim, Jamalludin and Ung 18 reported mean ratio of D2cc rectum to D ICRU as 1·24.
Conclusion
For cervical HDR brachytherapy, dose prescription to an arbitrarily defined point (e.g., Manchester/Point A) does not provide consistent coverage of HR-CTV. The difference in coverage between the two commonly used dose prescription approaches (2D/Manchester versus 3D/volumetric) increases with increasing CTV. Our ongoing work evaluates the dosimetric consequences of different volumetric dose prescription approaches for these patients.


