


INTRODUCTION
Early stage breast cancer has traditionally been managed using breast conservative therapy. The primary treatment includes lumpectomy, followed by adjuvant whole breast irradiation. The chance of local recurrence can be further reduced by delivering a boost radiation dose to the tumour bed to eliminate residual cancerous cells and achieve increased local control.Reference Bartelink, Horiot and Poortmans 1
The premise of simultaneous integrated boost (SIB) entails the concurrent delivery of different dose levels to different target volumes within a single treatment fraction. The most significant aspect of SIB intensity-modulated radiation therapy is related to the fractionation strategy, concerning two time-dose parameters: (1) the shortening of the overall treatment time, since there will be no need for extra fractions dedicated to boosting; (2) the increase of fraction size (FS) to the boost volume, as both the boost volume and full breast volume would be treated concurrently.
The practicality and adverse effects of SIB, when compared with traditional sequential boost, were the main concerns of many studies over the years.Reference McDonald, Godette, Whitaker, Davis and Johnstone 2 – Reference Alford, Prassas, Vogelesang, Leggett and Hamilton 8 In a recent study, Fiorentino et al.Reference Fiorentino, Mazzola and Ricchetti 3 suggest that the acute and late adverse effect from SIB treatments were tolerable. There were also several longitudinal studies that reported the effects of SIB over several years. Two studies showed that the long-term survival after using SIB was not inferior to sequential boost, with a tolerable degree of adverse effects due to lower organ at risk (OAR) dose.
Dosimetric comparisons can provide the most reliable and quantitative comparison between two radiotherapy techniques. ReportsReference Hijal, Fournier-Bidoz and Castro-Pena 9 , Reference Michalski, Atyeo, Cox, Rinks, Morgia and Lamoury 10 suggest that tomotherapy with SIB can offer a better dose homogeneity and lower doses to OARs around the target, but the coverage and conformity results were not as optimal, as the results have shown that SIB with three-dimensional conformal radiotherapy can deliver a more uniform dose coverage and better dose conformity to the target.
Overall, these studies all suggest that SIB can offer a better dose conformity and less dose spilling to the breast volume, when compared with sequential boosts, as well as offering the benefits of reducing the total number of fractions. However, SIB tends to deliver higher dose to the contralateral breast when compared with sequential boosts.
To the best of our knowledge, the field still lacks studies which directly compared the use of SIB and sequential boosts entirely in a tomotherapy setting. As tomotherapy is becoming more common, it is important to explore how it can be best used for cancer treatment, and to understand if the benefit of shortening the overall treatment time will outweigh the risks. Comparing the dosimetric outcomes when combined with tomotherapy will allow improving breast cancer treatment.
The objectives in this project were:
-
1. Primary endpoints: To compare the effectiveness of tomotherapy with sequential electron boost (Tomo-SEB) and tomotherapy with SIB (Tomo-SIB) in breast cancer treatment.
-
2. Secondary endpoints: To compare differences between two techniques in terms of:
Ipsilateral breast dose outside the gross tumour volume (GTV).
Dose to the GTV [using the coverage index (CI)].
Conformity of GTV [using the conformation number (CN)].
Dose to OARs (heart and ipsilateral lung) and skin dose.
METHODOLOGY
Patient selection
A retrospective study was performed. Treatment plans and computed tomographic (CT) images of 15 breast cancer cases between years 2012 and 2015 with tomotherapy SIB planning were collected from Hong Kong Sanitorium and Hospital (HKSH) via convenience sampling. The inclusion criteria were female patients aged 18 years or above with breast cancer, who were treated with breast-conserving surgery and received radiotherapy to whole breast using tomotherapy. The boost area should be within the treated primary breast volume. Exclusion criteria included history of breast or thoracic radiotherapy, supraclavicular fossa (SCF) or internal mammary chain involvement, and metastases. In one case the target volume was found to have extended to the SCF region, and eventually the study was performed with 14 patients. The retrospective selection of patients, together with convenience sampling from a pool of HKSH patients, may have introduced bias in the patient selection process.
Definition of target volumes and OARs
As the collected CT images were from treated patients in HKSH, gross target volume (GTV), clinical target volume (CTV) and planning target volume (PTV) were defined by oncologists. Normal organs including both lungs and the heart were delineated by radiation therapists. For patients with bolus in their tomotherapy SIB plan, the bolus was excluded for the electron plans. Skin dose of PTV region would also be studied. The skin was defined as 0–3 mm depth from body surface, the breast volume outside GTV was defined as breast-PTV minus GTV in order to study the dose spillage of GTV.
Dose prescription and OAR dose constraints for planning
For tomotherapy with SEB group, a fractionation schedule of 50 Gy in 2 Gy/fraction to the CTV was used and then followed by an additional electron boost of 10 Gy in five fractions of 2 Gy/fraction at 90% isodose line (IL) to GTV, resulting a total dose of 60 Gy in 30 fractions. For the tomotherapy SIB group, the GTV, CTV and PTV received 60, 50 and 47·5 Gy in 25 fractions, respectively. All the tomotherapy plans were optimised using 6 MV beams so that 95% of target volumes received their corresponding prescribed doses. The dose distributions in all the plans were required to fulfil the International Commission on Radiation Units and Measurements specifications that 100% coverage of the CTV should receive 95% or above of the prescribed dose. Areas with dose higher than 107% of prescribed dose would be acceptable only if they were inside the GTV or CTV.Reference Schubert, Gondi and Sengbusch 11
Dose constraint to various OARs followed that specification in Radiation Therapy Oncology Group 1005 protocolReference Arbor, Freedman and Arthur 12 (Figure A1).
Helical tomotherapy planning
All plans were created by treatment planning software provided by Accuray Inc. (Sunnyvale, CA, USA). Tomotherapy treatment planning software is based on the convolution/superposition algorithm to compute dose.Reference Lu, Olivera and Chen 13 In the optimisation tab, prescription was set that 95% of CTV would receive 50 Gy in 25 fractions. No directional or complete blocks were applied. In order to account for our relative inexperience in tomotherapy planning, the DVH of our computed plans were cross-checked between ourselves and by a qualified radiation therapist in HKSH.
Electron boost planning
All patients were planned for SIB using a tomotherapy planning station, and electron boost planned using Eclipse. An electron beam was used to cover GTV. Customised insert was made to fit to GTV with 0·8 cm margin. Electron energies ranging from 6 to 15 MeV were chosen in order for at least 70% of GTV to be covered by 90% IL. The beam angle was arranged so that the surface of customised insert was approximately perpendicular to the central axis of the beam in order to achieve skin apposition.
Dose accumulation by MIM
Tomotherapy plans and electron plans were exported to MIM to summarise the dose. The CT data and dose of the tomotherapy and electron plans were fused and dose-volume histograms (DVHs) of the composite dose were generated for each patient.
Statistical analysis
DVH was generated and used for analysis to calculate CN, dose to the GTV, and doses to OARs. The undesired excess volume receiving 95% or above of the prescribed breast and boost doses was also determined. CN was calculated using the following equation:
 $${\rm CN}{\equals}{\rm TVRI}/{\rm TV}\,{\times}\,{\rm TVRI}/{\rm VRI}$$
where TVRI is the target volume covered by 95% of isodose, TV the target volume; VRI the total volume covered by 95% of isodose.Reference Michalski, Atyeo, Cox, Rinks, Morgia and Lamoury 10 CI is the fraction of the GTV receiving a dose equal to or greater than the 95% IL (GTVref/VGTV). Volume receiving specific doses was calculated for the OARs.
The Wilcoxon signed rank test was used to compare the dosimetric parameters by using Statistical Package for the Social Sciences (SPSS) version 24·0. An α level of 0·05 was set to analyse dosimetric parameters. When p<0·05, differences were considered statistically significant.
RESULTS
Dose to the GTV and conformity
Table A1 shows the mean values for the CI, CN and the maximum, minimum and mean dose for the GTV. For both left and right breast cases, the mean CN was lower for cases with sequential boost than for SIB cases, with statistical significance (left side SEB 0·34±0·05 SD versus SIB 0·58±0·03SD, p=0·012; right side SEB 0·35±0·65SD versus SIB 0·64±0·07SD, p=0·028). All the mean CI values were close to 1, and dosage received (Dmax, Dmean, Dmin) by the GTV were similar for both treatment techniques (left side: p=0·327, 0·889, 0·575; right side: p=0·917, 0·753, 0·116, for Dmax, Dmean and Dmin, respectively)
Ipsilateral breast dose outside of GTV
The data shown in Table A2 demonstrated that the breast volume outside of the GTV received statistically significant higher Dmean (left SEB 51·42±0·77 SD Gy versus SIB 50·79±0·54 SD Gy, p=0·012; right SEB 51·34±0·87 SD Gy versus SIB 50·44±0·91 SD Gy, p=0·028) and V57 (left SEB 9·22±3·95 SD% versus SIB 3·56±1·04 SD%, p=0·012; right SEB 11·14±3·45 SD% versus SIB 3·12±1·13 SD%, p=0·028) for sequential boost, for both left and right breast cases, with V57 being notably higher by about 6% on the left side and 8% on the right. There were noticeable differences in the dose received between left and right side cases, but significance cannot be determined directly. There were no 107% dose (64·2 Gy) detected across all cases, and only three cases had 105% of dose in the non-GTV breast volume, with volumes of <0·05% each.
Dose to OAR
Data on the OAR dose can be found in Table A3. Most of the significant differences were found in the right breast cases, specifically for the heart dose, ipsilateral lung dose and skin dose. The Dmean (SIB 6·80±1·99 SD Gy versus SEB 6·28±1·89 SD Gy, p=0·046) and V5 (SIB 62·20±18·92 SD Gy versus SEB 56·98±22·44 SD Gy, p=0·028) of the heart were statistically significant higher for SIB than SEB on the right side. Only the V20 of the ipsilateral lung showed statistically significant differences on the right side, with a higher dose for SEB than SIB (SEB 18·05±5·96 SD% versus SIB 14·69±5·93 SD%, p=0·046). The Dmax, Dmean and D5 of the 3 mm skin all showed a statistically significantly increase (p<0·05) in sequential boost cases on the right breast, and the left breast as well for D5. Other OAR dose parameters showed no significant differences between two techniques.
DISCUSSION
Conformity and dose spillage
In this study the CI and CN were used to measure the coverage and conformity of the target dose to the target volume. CN values that are closer to 1 indicate optimal conformity while CI values over 0·7 can be considered excellent.Reference van’t Riet, Mak, Moerland, Elders and van der Zee 14 , Reference Van Parijs, Reynders and Heuninckx 15 Our results demonstrated that both techniques were able to deliver adequate coverage to the GTV, with all mean CI values being close to 1 which means that almost 100% of the GTV received 95% of target dose. Although the CN values are not as close to 1, the results showed that CN was significantly better for SIB in both left and right breasts (p<0·05). The dose received by the GTV, as indicated by the Dmax, Dmean and Dmin, also showed a non-inferiority between SIB and sequential electron boost. These results imply that SIB coverage was not inferior to sequential boost, while also delivering a better conformity to the target volume. A study by Van Parijs et al.Reference Van Parijs, Reynders, Heuninckx, Verellen, Storme and De Ridder 16 showed a marked improvement in conformity in SIB over sequential boost, which corroborates with our results. This can perhaps be explained by the need to provide margins to account for penumbra when trying to shape the electron aperture. In each of our electron customised inserts, we had to leave 0·8 cm margin around the target in order to account for the penumbra. This could have potentially increasing the dose to surrounding tissues in the SEB, leading to worse conformity when compared with SIB. Compared with SEB, the dose delivery method of SIB could also have affected the CN. As SIB involves the use of inverse planning, this could have reduced excess dose to volumes outside of the target. As for the dose calculation algorithm, our electron treatments used the Monte Carlo dose calculation algorithm, which has potential for greater accuracy in dose modelling than more traditional algorithms. We do not believe that the dose modelling inaccuracies affected our results greatly because we chose the maximum number of simulations during electron planning.
In conjunction with conformity, the studies by Van Parijs et al. and Hijal et al.Reference Hijal, Fournier-Bidoz and Castro-Pena 9 , Reference Van Parijs, Reynders, Heuninckx, Verellen, Storme and De Ridder 16 also reported less dose spilling to the breast tissue surrounding the target. This finding supports our results, which showed a significantly higher Dmean and V57 in sequential boost. The differences between left and right side boost can possibly be attributed to the different dose parameters that was set during planning, such as different dose constraints for the heart. As previously explained, the use of margins in the customised insert could also have been a major factor. The lack of V64·2 in all cases and the rarity of V63 can be attributed to a correct choice of electron energy during Eclipse planning, and supports the earlier assumption that SIB is not inferior to sequential electron boost at delivering sufficient dose, in the context of tomotherapy. Unfortunately, the lack of V64·2 meant that our secondary endpoints could only be partially fulfilled.
OAR dose
Heart
The heart dose was generally higher for left side cases than the right side, and this can be explained by the different dose constraints we used for planning (Figure A1), in which a tighter dose constraint for the right side (Dmean<10 Gy) was utilised. This is necessary because the position of the heart leans to the left in most humans and higher heart dose for left side cases is anticipated (because it is closer to the path of radiation), leading to a higher chance of cardiac morbidity and mortality.Reference Melchor, Soler, Candela, Cámara and Martínez 17 Our results, however, implied that the heart would receive greater dose from SIB even when discounting the positional factor. This may be justified by the nature of inverse planning and tomotherapy itself, which involves radiation entering at many different angles to optimise the dose. This mode of delivery results in higher integral dose to the rest of the body, because the beam angles are no longer limited like in tangential breast irradiation. When SIB is also required, then the dose would very likely to be higher because of the need to boost the dose to the GTV area. The similar heart dose results in our study is supported by the study from Melchor et al.,Reference Melchor, Soler, Candela, Cámara and Martínez 17 which also reported no significant differences in the dose received from SIB and SEB.
Another reason for the statistically significant increase in SIB heart dose for the right side could be attributed to the lack of directional or complete blocks. The lack of these blocks meant that the computer was free to pick certain beam entry angles that passed through the heart, inevitably leading to higher heart dose when compared with SEB, which utilised forward planning (in which beam angles were decided by the planner).
Lungs
In our study the Dmax, Dmean, V20 and V5 of the ipsilateral lung were studied, however only V20 of the right breast cases demonstrated a statistically significant lower dose from SIB. It may have been possible due to the better dose conformity offered by SIB, but it is more plausible that this result was due to a smaller sample size for our right breast cases, and further study may be required, as this result did not meet our expectation of statistically significant lower dose in lungs for both left and right breast cases, from SIB.
Skin
The significantly higher dose received by 3 mm skin for right breast sequential boost cases was not surprising, because electron beams have a faster dose buildup, and therefore less skin sparing effect compared to photon beams, resulting in a higher superficial dose. A high radiation dose to the skin may result in erythema, desquamation and even dermatitis,Reference Lee, Hou and Chuang 18 therefore this is another possible indication of the superiority of SIB due to reduced OAR dose.
CONCLUSION
Overall, the results have shown that both SIB and sequential electron boost can both provide adequate dose coverage, but SIB was able to offer less dose to the most important OARs in breast cancer (ipsilateral lung in right sided cases and skin), except for the heart. This infers that tomotherapy with SIB is possibly the superior choice in providing dose boost for breast cancer cases especially the right sided. However the study can be expanded further by including a larger sample and more OAR comparisons (such as dose to the thyroid gland) to confirm this. Also, our study takes Asian women as the study target, in which the general size of breast might be relatively smaller than women of other nationalities. With thicker breast tissue, it may result in an increase of high dose area.
Acknowledgements
The authors would like to acknowledge and give thanks to Professor Maria Yuen Yee Law, Mr Jacky Tsz Lung Wong, Mr Alan Wing Lun Mui and all staff of the Radiation Therapy Department in Hong Kong Sanatorium & Hospital, for their generous support and guidance in all aspects of this study. We are very grateful to the Hospital for supporting this study and providing the facilities and equipment necessary for its completion.
Financial support
This research received no specific grant from any funding agency, commercial or not-for-profit sectors.
Conflicts of Interest
None.
Appendix 1
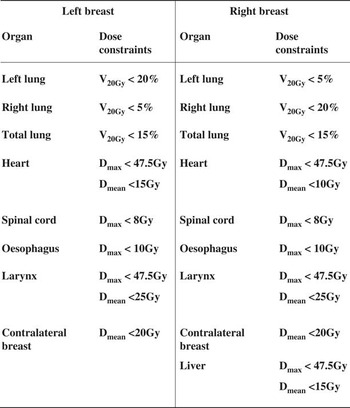
Figure A1 Tomotherapy planning constraints.
Appendix 2: Results tables
Table A1 Comparisons of conformation number (CN), coverage index (CI) and dose to gross tumour volume (GTV) between sequential electron boost after tomotherapy (Tomo-SEB) versus tomotherapy with simultaneous integrated boost (Tomo-SIB)
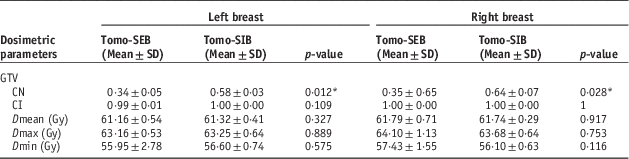
Table A2 Comparisons of dose to ipsilateral breast outside of gross tumour volume (GTV) between sequential electron boost after tomotherapy (Tomo-SEB) versus tomotherapy with simultaneous integrated boost (Tomo-SIB)
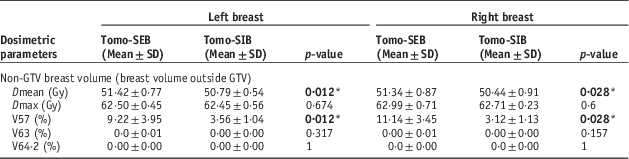
Table A3 Comparisons of dose to organ at risk between sequential boost after tomotherapy (Tomo-SEB) versus tomotherapy with simultaneous integrated boost (Tomo-SIB)


