Introduction
The concept of the biological effective dose (BED) was introduced in 1982 by Barendsen.Reference Barendsen 1 In this context, the BED is the conversion of the physical dose into a dose that describes the biological effect of the radiation given to tumours and also to normal tissues. It illustrates the point that for different fractionation of radiotherapy treatment schemes with the same physical dose the biological effect will be different.Reference Juan 2 The clinical applications of BED analysis are adaptive therapyReference Jacobs, Nelson and Liu 3 and comparison of different clinical trials using altered fractionation schemes.Reference Lee, Leu, Smathers, Mcbride, Parker and Withers 4 The original BED equation is shown in the following equation:Reference Joiner and Kogel 5
 $${\rm BED}{\equals}(nd)\left( {1{\plus}d{\beta \over \alpha }} \right)$$
The α and β in the BED equation are the biological parameters which are specific for each organ describing the radiation damage. The physical dose distribution is commonly used in the radiotherapy treatment plan evaluation and as a consequence the effects of radiation in different organs are disregarded. Whereas, using the BED distribution can closely simulate the effects of radiation treatment in clinical situations. Therefore, an in-house software program has been developed to import the radiotherapy treatment plan from the computer treatment planning system (TPS) and convert the physical dose to BED distribution. This enables users to input specific parameters for the BED calculation then display the BED distribution to evaluate the radiotherapy treatment plan both in clinical and research situations.
Methods and Materials
Theory
The BED equation is based on the linear-quadratic model (LQ model), following the original Equation (2)Reference Hall and Giacca 6 , Reference Bruzzaniti, Abate, Pedrini, Benassi and Strigari 7 as
 $$S{\equals}\exp {\minus}\left( {\alpha D{\plus}\beta D^{2} } \right)$$
S is the surviving fraction, α and β the radiobiological parameters and D the radiation dose (Gy). Equation (3) is the conversion of Equation (2) into a natural logarithm:
 $$\ln (s){\equals}{\minus}\!\left( {\alpha D{\plus}\beta D^{2} } \right)$$
 $$E{\equals}{\minus}\!\ln (s){\equals}\alpha D{\plus}\beta D^{2} $$
E in Equation (4) is the effect of a single fraction of radiation treatment. For fractionation treatment of n fractions and dose per fraction d, the E can be expressed as
 $$E{\equals}{\minus}\!\ln (s)^{n} {\equals}{\minus}\!n\ln (s)$$
 $$E{\equals}{\minus}\!n(\!{\minus}\alpha d{\minus}\beta d^{2} ){\equals}(nd\alpha )\left( {\!1{\plus}d{\beta \over \alpha }} \right)$$
Thus, as shown in Equation (1),
 ${\rm BED}{\equals}{E \over \alpha }{\equals}(nd)\left( {1{\plus}d{\beta \over \alpha }} \right)$
If the two treatment plans have equal BED or IsoBED, the equation can be expressed as
 $$n_{1} d_{1} \left[ {1{\plus}{{d_{1} } \over {\alpha /\beta }}} \right]{\equals}n_{2} d_{2} \left[ {1{\plus}{{d_{2} } \over {\alpha /\beta }}} \right]$$
Where n 1 is number of fractions of the radiation dose d 1 in the original schedule and n 2 is the number of fractions of radiation dose d 2 for the new schedule.
However, the LQ model has some limitations, as it does not take overall treatment time into account, and for the bi-fractionated treatments and at high dose per fraction the predicted effect of radiation is not accurate.Reference Voyant, Julian, Roustit, Biffi and Lantieri 8 Therefore, this new software program was based on the linear-quadratic-linear (LQ-L) model so the limitations of the LQ model could be elucidated. The BED equation based on LQ-L model, following the software by Cyril Vovant et.al.Reference Voyant, Julian, Roustit, Biffi and Lantieri 8 can be expressed as
-
1. BED for target volume
-
1.1. case d>d t
(8)where d is dose per fraction, dt is LQ-L threshold $$\eqalignno{BED&{\equals}n\left[ {d_{t} \left( {1{\plus}{{d_{t} } \over {\alpha \,/\,\beta }}} \right){\plus}{\gamma \over a}\left( {d{\minus}d_{t} } \right)} \right]\cr \quad{\minus}\left[ {\theta \left( {T{\minus}T_{k} } \right)\left( {{{\ln (2)} \over {\alpha T_{{pot}} }}} \right)\left( {T{\minus}T_{k} } \right)} \right]$$
$\left( {d_{t} \,\sim\,2{\alpha \over \beta }} \right)$
, n is number of fractions, θ(x)is the Heaviside function,
$${\gamma \over a}$$
is the parameter of the LQ-L model, T is overall treatment time, T
k
is the time at which repopulation begins after the start of treatment (day) and T
pot is potential doubling time (day).
$$\eqalignno{BED&{\equals}n\left[ {d_{t} \left( {1{\plus}{{d_{t} } \over {\alpha \,/\,\beta }}} \right){\plus}{\gamma \over a}\left( {d{\minus}d_{t} } \right)} \right]\cr \quad{\minus}\left[ {\theta \left( {T{\minus}T_{k} } \right)\left( {{{\ln (2)} \over {\alpha T_{{pot}} }}} \right)\left( {T{\minus}T_{k} } \right)} \right]$$
$\left( {d_{t} \,\sim\,2{\alpha \over \beta }} \right)$
, n is number of fractions, θ(x)is the Heaviside function,
$${\gamma \over a}$$
is the parameter of the LQ-L model, T is overall treatment time, T
k
is the time at which repopulation begins after the start of treatment (day) and T
pot is potential doubling time (day).
-
1.2. case d≤d t
(9)
$$\eqalignno{{\rm BED}&{\equals}nd\left[ {1{\plus}\left( {1{\plus}H_{m} } \right){d \over {\alpha \,/\,\beta }}} \right]\cr\quad{\minus}\theta \left( {T{\minus}T_{k} } \right)\left( {{{\ln (2)} \over {\alpha T_{{{\rm pot}}} }}} \right)\left( {T{\minus}T_{k} } \right)$$
(10)
$$H_{m} {\equals}\left( {{2 \over m}} \right)\left( {{\phi \over {1{\minus}\phi }}} \right)\left( {m{\minus}{{1{\minus}\phi ^{m} } \over {1{\minus}\phi }}} \right)$$
(11)
$$\phi {\equals}e^{{{\minus}(\mu & \,\Delta T)}} $$
(12)Where H m is the LQ model correction taking the poly-fractionation into consideration, m the number of fractions per day, ϕ the incomplete repair, ∆T the duration between two irradiations and
$$\mu {\equals}{{\log _{e} 2} \over {T_{{1\,/\,2}} }}$$
$T_{{{1 \over 2}}} $
the time taken to repair the damage to half of the original level.
-
-
2. BED for organs at risk
-
2.1. case d>d t
(13)
$$\scale95%{{\rm BED}{\equals}n\left[ {d_{t} \left( {1{\plus}{{d_{t} } \over {\alpha /\beta }}} \right){\plus}{\gamma \over a}\left( {d{\minus}d_{t} } \right)} \right]{\minus}D_{{{\rm rec}}} T}$$
(14)Where D rec is the recovered dose
$$D_{{{\rm rec}}} {\equals}{{\ln (2)} \over {\alpha T_{{{\rm pot}}} }}$$
-
2.2. case d≤d t
-


 $$\scale96%{{\rm BED}{\equals}nd\left[ {1{\plus}\left( {1{\plus}H_{m} } \right){d \over {\alpha /\beta }}} \right]{\minus}D_{{{\rm rec}}} T$$}
Tumour Control Probability (TCP) and Normal Tissue Complication Probability (NTCP) can be presented as a function of BED as shown in Equations (16)Reference Hedman, Bjork-Eriksson, Brodin and Dasu 9 and (17):Reference Kehwar 10
 $${\rm TCP}_{{{\rm BED}}} {\equals}\exp [{\!\minus\!}M.\exp (\!{\minus}\!\alpha {\rm BED})]$$
Where M is all clonogenic cells
 $${\rm NTCP}(D,v){\equals}\exp \left[ \!{{\minus}\!N_{0} v^{{{\minus}k}} \exp (\!{\minus}\!\alpha {\rm BED})} \right]$$
Where N 0 is density of specific tissue
k is tissue-specific parameter
v is uniformly irradiated partial volume of the normal tissue/organ
Methods
An in-house software was developed on MATLAB R2014b. This software was linked to the Computational Environment for Radiotherapy Research (CERR) software program.Reference Deasy, Blanco and Clark 11 The CERR was employed to import the radiotherapy treatment plans, and pull out pixel-wise physical dose which was an input for the in-house software for BED calculation and display as a 3D BED distribution (display isoBED on CT image). The radiobiological parameters used in the BED calculation which specified for individual organs were obtained either from the program’s database or by manually inputting data according to the user’s clinical experience. Other parameters required to calculate BED such as overall treatment time, number of fractions and dose per fraction could be fed via the panel of the software program. The accuracy of the software program was validated by comparing the BED calculation from the program with that of manual calculation at 100 randomly selected points. The BED from both clinical and phantom cases were calculated. For the phantom cases, the Intensity Modulated Radiation Therapy (IMRT) dose verification phantom, ret 91,230 was used. The prostate and lung cancer from the demo cases in Oncentra TPS were used as clinical demonstration cases. For prostate cancer, the Volumetric Modulated Arc Therapy (VMAT) technique was planned with a prescribed dose of 2 Gy/fraction in 35 fractions, whereas, the IMRT step and shoot technique was planned in lung cancer case with prescribed dose of 2 Gy/fraction in 30 fractions. The example of radiobiological parameters used in BED calculation for lung cancer and prostate cancer are shown in Table 1. In addition, TCP and NTCP values could be calculated using TCP and NTCP equation based on BED.
Table 1 Example of radiobiological parameters used in biological effective dose calculation for lung cancer and prostate cancer case

Notes: α and β, radiobiological parameters;
 $${\gamma \over a}$$
, parameter of the linear-quadratic-linear model model; T
k
, time at which repopulation begins after start of treatment (day); D
prol, proliferation dose; D
rec, recovered dose; OAR, organs at risk; PTV, planning target volume.
$${\gamma \over a}$$
, parameter of the linear-quadratic-linear model model; T
k
, time at which repopulation begins after start of treatment (day); D
prol, proliferation dose; D
rec, recovered dose; OAR, organs at risk; PTV, planning target volume.
Results
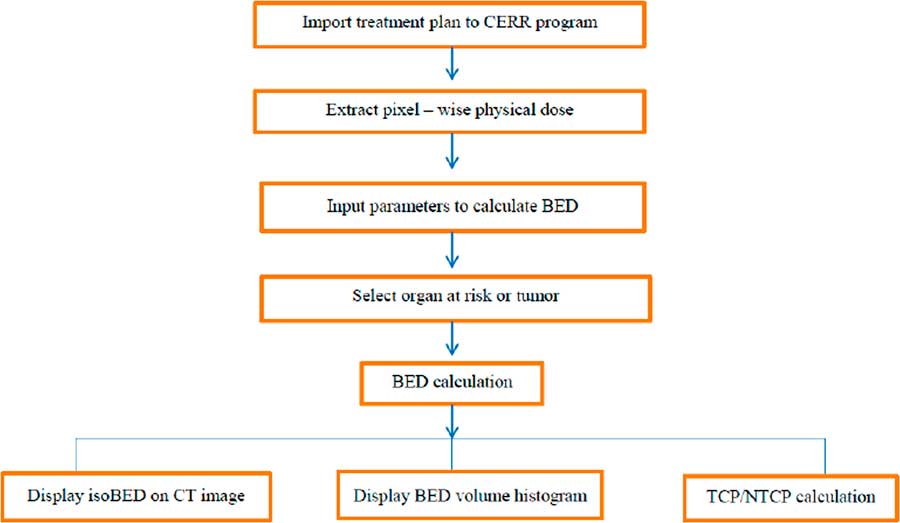
The in-house software incorporated import radiotherapy treatment plans from TPS, conversion pixel-wise physical dose for BED calculation, display the isoBED line on a CT image, display a BED volume histogram and TCP/NTCP calculation. Figure 1 shows the flow chart of the program. The results of the program were verified by comparing the BED distribution calculated by the program and manual calculation for randomly selected 100 points in phantom, prostate cancer and lung cancer cases and shown in Table 2. The results showed that BED distribution calculated by the program and by manual calculation were identical for all cases.

Figure 1 The flow chart algorithm of the software program. Abbreviations: CERR, Computational Environment for Radiotherapy Research; BED, biological effective dose; CT, computed tomography; TCP, Tumour Control Probability; NTCP, Normal Tissue Complication Probability.
Table 2 The results of program verification in phantom and clinical cases

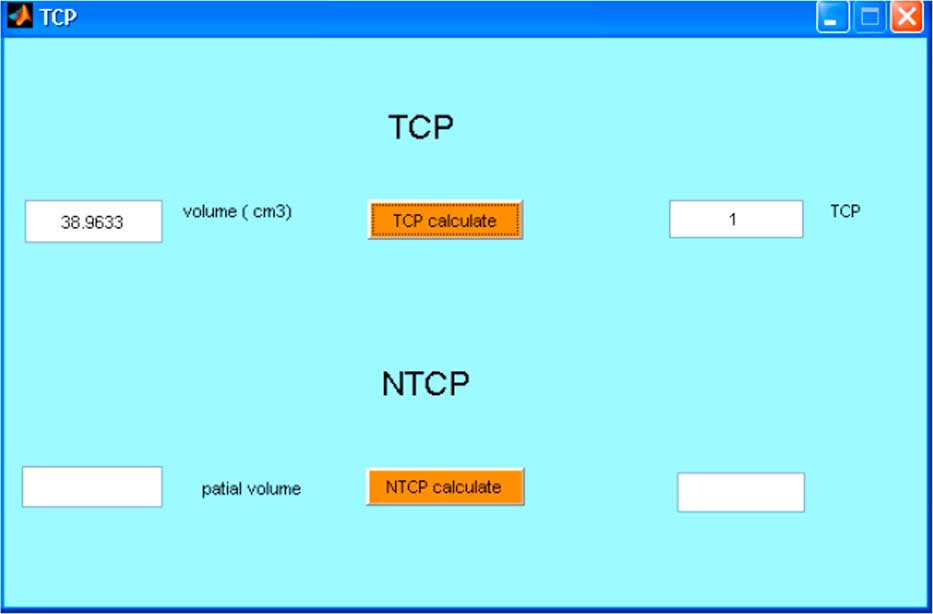
The displays of software program are shown in Figures 2–4. In the case of lung cancer, the IMRT step and shoot technique was planned with prescribed dose of 2 Gy/fraction in 30 fractions. The dose volume histogram and BED volume histogram of planning target volume (PTV), oesophagus and left lung are shown in Figure 2a. The isodose line and isoBED line of the organs at risk and target are shown in Figure 2b and 2c, respectively. In case of prostate cancer treated by VMAT, the prescribed dose was 2 Gy/fraction in 35 fractions. The dose volume histogram and BED volume histogram of prostate, bladder and rectum are shown in Figure 3a, isodose line and isoBED line of the organs at risk and the target are shown in Figure 3b and 3c, respectively. Both of the clinical cases showed a difference between physical dose distribution and BED distribution. Figure 4 shows TCP/NTCP calculation window in the software program. For the prostate cancer case with BED value of 115·16 Gy, assuming the density of clonogen of 109 cells/cm3 Reference Joiner and Kogel 5 the calculated TCP was 1.
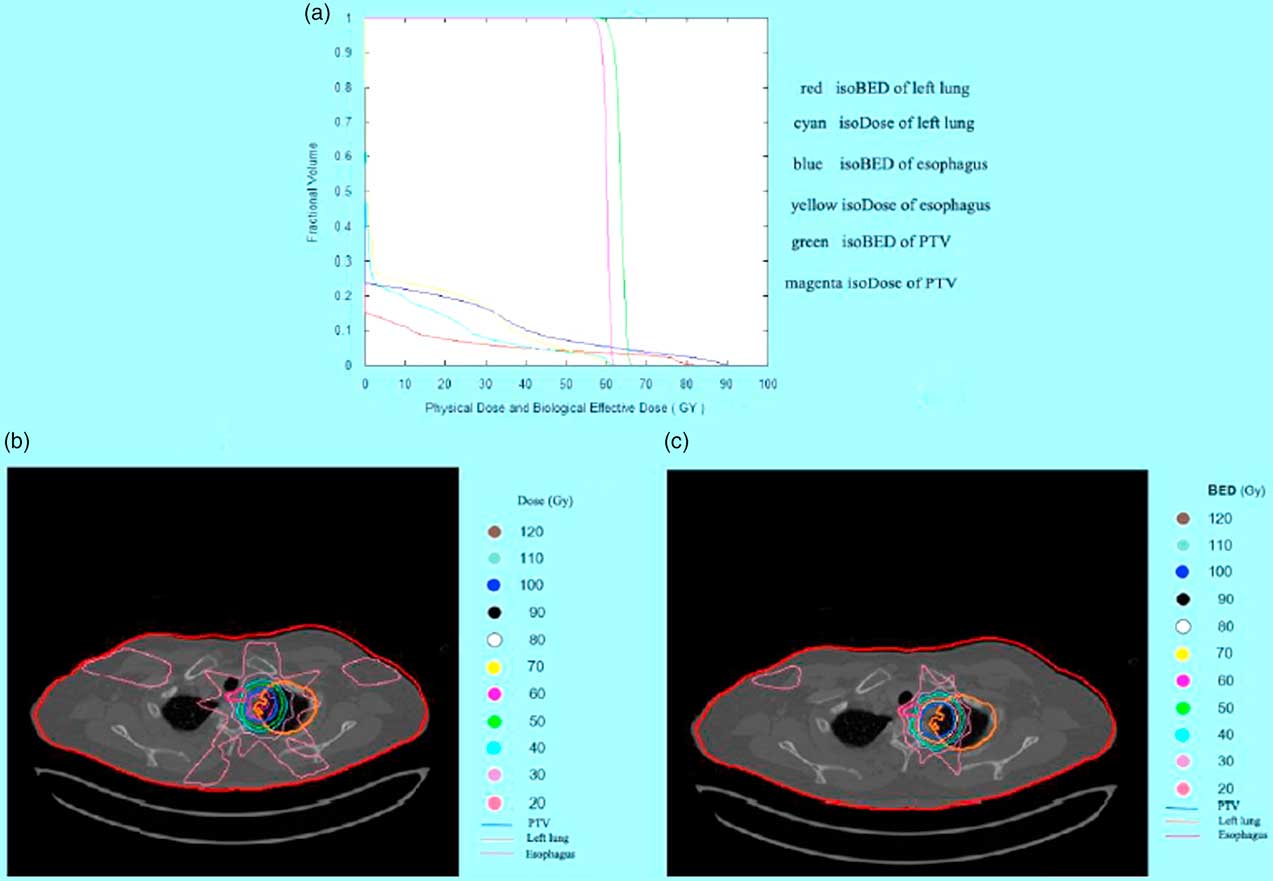
Figure 2 The results of the software program in lung cancer case. (a) Physical dose and biological effective dose (BED) volume histogram of planning target volume (PTV) left lung and oesophagus (b) Isodose line on computed tomographic (CT) image of PTV and the organ at risk (c) IsoBED line on CT image of PTV and the organ at risk.
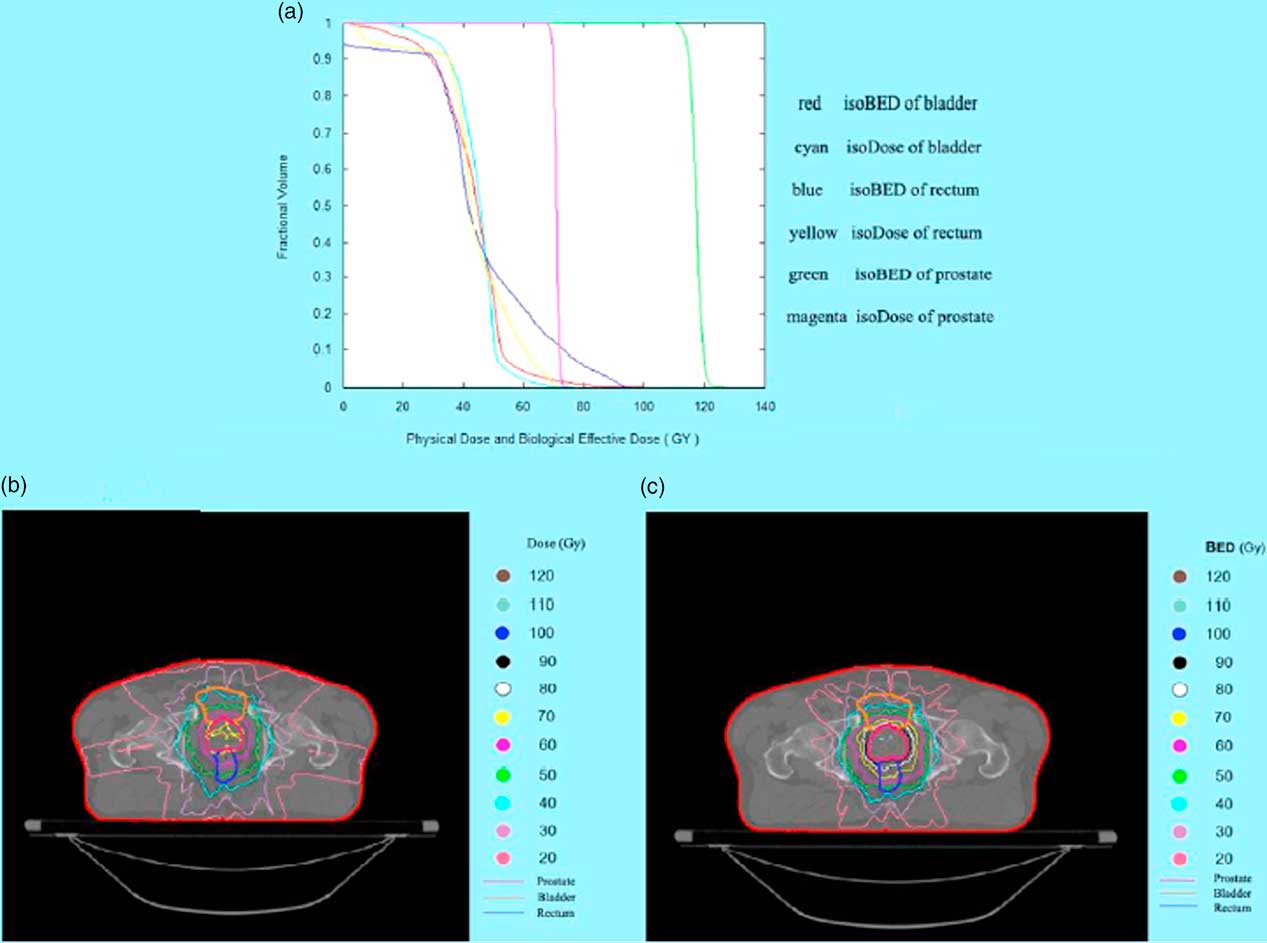
Figure 3 The results of software program in prostate cancer case. (a) Physical dose and biological effective dose (BED) volume histogram of prostate, bladder and rectum (b) Isodose line on CT image of prostate and the organ at risk (c) IsoBED line on CT image of prostate and the organ at risk.

Figure 4 Tumour Control Probability (TCP)/Normal Tissue Complication Probability (NTCP) calculation window in the software program.
Discussion
In 1995, Lee et al.Reference Lee, Leu, Smathers, Mcbride, Parker and Withers 4 developed a software program to convert physical dose distribution to BED distribution to exhibit the biological effects of radiation. BED or normalized isoeffective dose (NID) could be calculated at each grid point and then displayed in two dimensions with anatomical structures. Their software program was based on the LQ model and was very useful in clinical and research work. However, the LQ model still has some limitations and these can be resolved by the use of the LQ-L model. However, the BED program presented in this study is based on the LQ-L model and displays the 3D BED distribution as the isoBED lines in the CT image for each organ of interest slice by slice. This program also includes a feature for displaying a BED volume histogram, the graphical relationship between BED and volume receiving biological dose from multi-treatment planning and multi organs of interest. This feature is useful for a treatment plan evaluation following the concept of the volume effect that is dependence of radiation damage on the irradiated volume of tissue.Reference Joiner and Kogel 5 The BED calculated in this software addresses target volume and normal tissue separately. In addition, the parameters d and d t , dose per fraction and LQ-L threshold dose, were taken into account for both types of tissues in order to solve the limitations of high dose per fraction in the LQ model. For the target volume, Equations (8) and (9) have been used for the BED calculation thus any tumour repopulation which may occur during treatment have been compensated for in both equations. In the case of normal tissue, BED is calculated with given recovered dose parameter as shown in Equations (13) and (15). Therefore, quantifying treatment expectation by using BED would reflect the real clinical situations. This in-house software allows users to input overall treatment time resulting in a more accurate BED compared to the LQ-L equitv software that this duration in their program is automatically computed from the number of fractions. Comparing BED with a physical dose line in an organ at risk at the same volume, in the low-dose range the BED values are lower than the physical doses because of the inclusive effect of the time factor (following Equations 13 and 15) and will be higher than the physical dose in the high-dose range as shown in Figures 2a and 3a.
Treatment plans can be evaluated by using the BED volume histogram and BED distribution on the CT image with this new program. The BED volume histogram is found to be superior than the Dose volume histogram in evaluating the treatment plan as different organs may respond differently to the same physical radiation dose especially in cold and hot spot areas.
The accuracy of physical dose distribution extracted by the CERR program was verified by comparing the obtained dose volume histogram with that of the original treatment plan from the TPS. Both datasets were consistent. In CERR, the DVH is generated by using a modified grid-based technique.Reference Davenport 12 The dose grid resolution had an effect on DVH in CERR, therefore, where different, DVH in CERR would be slightly deviated from TPS. The dose grid resolution in CERR can be changed to the concordance TPS by modifying the source code in CERR under the file name getDT.m
When the biological parameters of various organs within the radiation field were taken into account, the physical dose distribution was differentiated from biological distribution. As the irradiated region was not only confined within the target organ but also included normal tissue and because of the differential response of tissue/organ to radiation, biological parameters played a significant role in determining the biological effects of radiation in radiotherapy. Plan evaluation helps to increase tumour control while decreasing the probability of complications and will also improve the quality of life after treatment.
This software program aims only for treatment plans evaluation. The algorithm for generating DVH and BED volume histogram is followed the CERR program. Although the BED calculation based on the LQ-L model has taken dose per fraction and overall treatment time into consideration, it does not include an allowance for reoxygenation and redistribution of cells. Although TCP/NTCP value can be theoretically used to predict the clinical outcome, the use of absolute TCP/NTCP as main indicator of plan quality is not currently recommended.Reference Allen, Alber and O. Deasy 13 The accuracy of NTCP value depends on the accuracy of the complied tolerance doses and their end points.Reference Kehwar 10 As indicated by Hedman et al.,Reference Hedman, Bjork-Eriksson, Brodin and Dasu 9 TCP based on individual radiobiological parameters is more precise than population-based averages in predicting local control. Therefore, the radiation oncologists should pay close attention to these and ensure their understanding of the concept of the model for BED implementation in their clinical and research work.
Conclusion
This software is feasible to apply in both clinical practice and research work. However, the validity of the program depends on the accuracy of the published biological parameters. The radiation oncologists and medical physicist should interpret the results with caution.
Acknowledgements
None.
Financial support
This research received no specific grant from any funding agency, commercial or not-for-profit sectors.
Conflicts of Interest
None.