


Introduction
Traditionally, radiation therapy for cancer treatment was commonly performed using photon and electron beams, and photon beams continue to remain the most common beam in radiation therapy, to the extent that the two terms ‘radiation therapy’ and ‘photon therapy’ are intertwined.Reference Haberer1, 2 Despite all the developments in photon therapy, this modality still poses a few dosimetric challenges. At present, proton beam is a promising modality, which was first recognised to have a potential for cancer therapy by Robert Wilson in 1946.Reference Wilson3
When proton beams penetrate the body tissue, these are subjected to various interactions, including Coulomb scattering and electromagnetic and nuclear interactions, which result in the production of secondary particles, through which they deposit their energies. This energy deposition inside and outside the target volume depends on tissue composition and beam properties.Reference Paganetti4
Heavy-charged particles such as protons and heavy ions, due to their depth–dose characteristics, have a substantial potential to deposit a high dose at the target, sparing the normal tissues around it. The key advantage of a therapeutic proton beam lies in its fixed penetration depth inside a human body (the so-called Bragg peak, BP) with minimum exit dose beyond its penetration depth.Reference Newhauser and Zhang5 Therefore, having knowledge of depth–dose characteristics of therapeutic proton beams is essential to employ these beams in cancer treatment. For this, the present study intended to provide precise information about the characteristics of these beams and their dose deposition.
The National Institute of Standards and Technology (NIST) published stopping power and range tables for proton energies from 1 keV to 10,000 MeV as an excellent reference in predicting energy loss per unit path length and range (penetrating power) of protons in commonly used materials.Reference Berger, Coursey, Zucker and Chang6 These tables are provided assuming continuous slowing down approximation (CSDA) and, therefore, give certain beam ranges for specific energies.
In proton radiation therapy, minute characterisation of the dosimetric properties of an incident beam is a crucial aspect for treatment planning and quality assurance. An important point in the calculation of dose distribution with ion beams is BP range uncertainty. Knowing the exact range of a proton beam is crucial and one of the main challenges in proton therapy. Much effort has been made to improve the accuracy of calculations for proton therapy, and in this regard, the Monte Carlo methods achieve the highest degree of accuracy.Reference Peterson, Polf, Bues, Ciangaru, Archambault and Beddar7
Monte Carlo is a statistical method for calculating numerical solutions to physical or mathematical issues that are analytically impractical, if not impossible, to solve. For charged particle transport probabilities, it presents several benefits over deterministic techniques since such problems require a realistic description of problem geometry, as well as a detailed tracking of every source particle. Thus, the Monte Carlo technique can be considered a robust alternative to the famous Bethe–Bloch equation where an equation with numerous corrections is employed to calculate stopping power and ranges of charged particles such as protons, electrons, positrons, alphas, etc.Reference Andreo8
The aim of this study was to examine accurate depth–dose characteristics of ideal proton pencil beams using the GATE Monte Carlo simulation. This study presents how a stochastic technique such as Monte Carlo can be utilised to obtain certain quantities of practical importance related to charged particle transport. Furthermore, another objective of this study is to conceptualise a Monte Carlo approach for calculating stopping power of proton beams.
The GATE Monte Carlo simulation code has been developed by the OpenGate collaboration (Marseille, France) based on Geant4 toolkit.Reference Agostinelli, Allison, Amako, Apostolakis, Araujo and Arce9 This platform allows for the transportation and interaction of different particles in a broad energy range and different 3D geometries. It also allows for defining a wide range of source distribution, detector conditions and a rich series of variance reduction techniques.Reference Jan, Benoit, Becheva, Carlier, Cassol and Descourt10 This simulation code was initially used broadly for positron emission tomography and single-photon emission computed tomography studies.Reference Gonias, Bertsekas, Karakatsanis, Saatsakis, Gaitanis and Nikolopoulos11–Reference Bruyndonckx, Lemaître, Schaart, Maas, Krieguer and Devroede14 Nevertheless, this code has been developed in recent years, and new versions of it are published by OpenGate collaboration. Since the development of the GATE6 Monte Carlo platform, the capability of radiotherapy experiment modelling has been added to it. As a new characteristic of the GATE code, it has been used in scant studies into this subject. This study intended to characterise the depth–dose profile of proton beams in the therapeutic energy range in a water phantom, using the GATE code.
Materials and Methods
In this study, the Geant4-based GATE8 Monte Carlo codeReference Jan, Santin, Strul, Staelens, Assie and Autret15 was used to simulate the proton pencil beam in a water cubic phantom. A computer (Intel Xeon 12 Core 24 GB RAM) was used to simulate the proton pencil beam in a water phantom. In our previous study, we validated the GATE Monte Carlo code for the simulation of proton therapy.Reference Zarifi, Ahangari, Jia and Tajik-Mansoury16
In the present study, a water cubic phantom (40 × 40 × 40 cm3) was modelled in a vacuum world volume (Figure 1). The DoseActor tool provided in GATE was attached to the given volume to score dose distribution and its corresponding statistical uncertainty. Here, beginning from the water phantom surface, a dose and fluence detector was attached to the whole phantom. In this way, the voxel size was set at 0·01 × 0·01 cm2 in the beam direction (z-axis) and one lateral direction (y-axis) and 40 cm across the other lateral direction (x-axis). The deposited energy and absorbed dose are scored in these voxels. Obviously, due to geometrical symmetry, it is not necessary to examine both lateral axes.

Figure 1. Schematic image of phantom geometry and incident beams.
In Geant4, the location of the scored energy along a step (e.g., at the beginning, end point or elsewhere of the step) should be determined by the user. With respect to the charged particles that lose their energies mainly through a continuous energy loss process, the GATE code is enabled to score the deposited energy in a random location along the step line. This capability allows for ensuring that the deposited energy is scored properly almost in the middle of the step line. Since a step is always interrupted when it crosses a volume boundary, other dose-scoring methods may introduce biases. Therefore, in this study, the place of the scored energy was selected as ‘random’, somewhere between the beginning and the end of the step.
Monoenergetic proton beams were emitted in the therapeutic energy range (5–250 MeV) along the z-axis from a point source at one end of the water phantom (see Figure 1). In this study, ‘spot size’ or the standard deviation in x and y directions in the isocentre, determined as σx and σy, was taken as 3 mm. Inherent divergence of the beam was also considered to have a negligible value, σ = 3 mrad.
In Geant4, and consequently in the GATE code, the corresponding cross-section models and tables were used to describe all physical processes. Moreover, new models have been recently introduced to describe hadronic interactions and transportation of optical photons. Currently, there are several physics list packages in Geant4, out of which a suitable one can be selected. In this study, the selected physics list for proton interactions in the matter is QGSP_BIC_EMY. This physics list is recommended for hadron therapy applications,17 and also in our previous study, we examined different physics lists and showed that the results obtained with QGSP_BIC_EMY are in best agreement with NIST data.Reference Zarifi, Ahangari, Jia and Tajik-Mansoury16
All secondary particles, which are probably produced by proton interactions, were tracked in the simulation. The secondary production threshold, known as ‘set cut’, was set at 0·01 mm for electrons, positrons and photons. This value is a minimum secondary production range, below which the incident particle only undergoes continuous processes rather than discrete ones. It means that the secondary particles are generated only if their ranges are >0·01 mm. All particles produced are then tracked until their energies fall to 0. According to the Jia et al. study (2016), the value of 0·005 mm is appropriate for ‘step max’Reference Jia, Romano, Cirrone, Cuttone, Hadizadeh and Mowlavi18 that limits step length, that is, if a particle does not experience a discrete process in a distance shorter than the defined step max value, the step is interrupted; however the particle energy may decrease by continuous processes. Simulations were done for 1 million proton histories, and this yielded a statistical error <1%. In general, despite the fact that Monte Carlo calculations are time-consuming, precision (statistical uncertainty) of the results was quite satisfactory.
In this study, different parameters, including RX, full width at half maximum (FWHM), lateral penumbra (W (80–20)), and peak-to-entrance dose ratio (PER), were used to show BP characteristics, where R x stands for the depth at which the dose falls to x% of its maximum and R peak stands for BP depth.
In this study, to evaluate the accuracy of the results, we first compared the difference obtained for the proton range with simulation and NIST data and statistical uncertainty. Then, for a closer look, the least squares method was used.
In this study, FWHM was extracted for pristine BP. In fact, here, FWHM as a criterion for BP width was defined as twice the distance between the peak position and the point that dose falls to 50% in the distal region. A penumbra W (80–20) is also the distance between the points that dose falls to 80% and 20% of its maximum in the distal region and is the criterion for depth dose distal fall-off. Also, PER is defined as maximum over entrance dose.
It is worth noting that we set the ionisation potential of water to 75 eV in accordance with PSTAR (NIST) data, recommended by ICRU reports 37 and 4919, Reference Berger, Inokuti, Andersen, Bichsel, Powers and Seltzer20 and the Grevillot et al. study.Reference Grevillot, Frisson, Zahra, Bertrand, Stichelbaut and Freud21
The present study also used the GATE8 Monte Carlo code to calculate the stopping power of proton pencil beams in a water cubic phantom and compared results with the NIST standard reference database.
Results
Figure 2 presents the pristine depth–dose profiles for all of the beam energies that were considered. The absolute dose is given in nGy per incident proton. According to the diagram, when the beam penetrates deeper at a higher energy, some changes are observed in the depth–dose profile, due to the accumulative effects of interactions between incident protons and phantom materials. These effects included reduction of peak height, PER and widening of the peak, which resulted in an increase in penumbra W (80–20). With increasing entrance energy, peaks became wider and shorter as a result of range straggling.
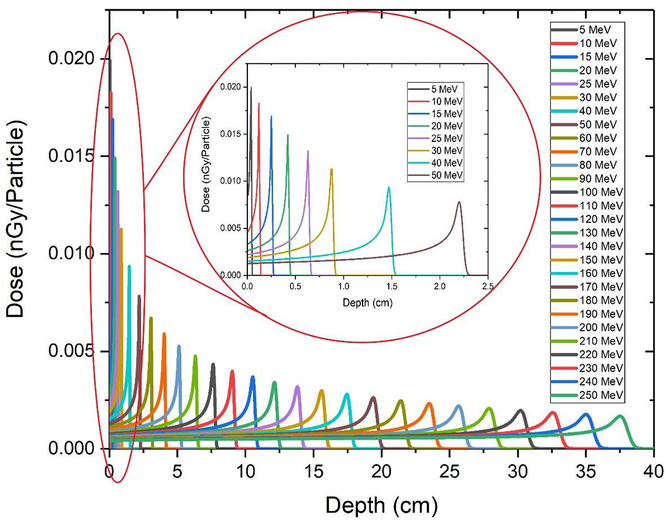
Figure 2. Pristine depth–dose profiles for proton beams with an energy range of 5–250 MeV. A zoom of the depth–dose curve for 0–50 MeV is shown for better understanding.
Figure 3 shows the 2D dose distribution for a monoenergetic proton beam in a water phantom. As shown in diagrams (a–e), the energy values varied between 50 and 200 MeV. In all of these diagrams, the horizontal axis shows the penetration depth of the beam (in cm), the vertical axis shows the lateral dispersion of the beam (in cm), and the colours show the absorbed dose per voxel in Gy. The dose corresponding to each colour is shown in the graph guide. The changes observed in all of these diagrams were caused by changes in the energy of the incident beam. The penetration range of the beam in the material, that is, the proton range in the environment, also increased with increasing energy of the incident beam.

Figure 3. Diagrams of 2D dose distribution for a monoenergetic proton pencil beam in water.
Measurement of proton range
In Figure 4(a) proton ranges are shown as a function of energy for different R x. In Figure 4(b), difference between these ranges obtained from simulations and NIST R CSDAs (PSTAR database) is shown.Reference Berger, Coursey, Zucker and Chang6 Range deviations are illustrated for beam energies previously mentioned. According to Figure 3(b), the depth in which dose fall to 73% of peak value has the highest compatibility with semi-empirical data.

Figure 4. (a) Range of proton beams as a function of energy defined at different distal dose levels, that is, R x. (b) Deviations of characteristic beam range parameters from the NIST data.
These differences are due to (i) the effects of different physics involved in calculations (e.g., CSDA, which ignores the multiple Coulomb scattering process), and (ii) the uncertainty in stopping power formula used in Geant4 and NIST calculations. Therefore, these differences should be analysed very accurately.
The least squares method was also used to analyse range deviation from the semi-empirical NIST values for a more accurate investigation. According to this method, the depth in which dose came to 73% of its maximum level in the distal region (R 73) had the highest agreement with the NIST data (Figure 5). For this, we set R 73 as the reference.

Figure 5. Least squares value as a function of R x. (NIST values used as reference to calculate least squares).
We found that the ranges in Figure 4(a) (R x) were well fitted by a third-order polynomial function of energy.
 $$R = a{E^3} + b{E^2} + cE + d$ $$
(1)
$$R = a{E^3} + b{E^2} + cE + d$ $$
(1)where R is range in terms of mm and E is energy in terms of MeV. The fitting constant parameters are given in Table 1.
Table 1. Third-order formulae for fitting GATE-simulated data of the characteristic range parameters to incident beam energy

a Constant parameters in relation 1.
FWHM and distal fall-off
Figure 6 shows FWHM/2 and W (80–20) curves versus incident energy. A more accurate study into the curves showed that the gradient of the FWHM/2 curve exceeded W (80–20) with an increase in beam energy. As a result, FWHM changes were more sensitive than distal fall-off changes.

Figure 6. FWHM and W (80–20) values of depth–dose profiles as a function of beam energies.
Peak-to-entrance ratio
Figure 7 displays PER in terms of beam energy. Accordingly, PER decreased with an increase in beam energy as was expected.

Figure 7. PER in terms of incident energy.
Stopping power differences between GATE and NIST
The GATE code was used to calculate the absorption dose and fluence of protons in the energy range of 5–250 MeV in water. Using the simulation results of dose and fluence, we used Equation 2 to calculate stopping power in different energies. The density of water is 1,000 kg/m3.
 $$S = {{\rho D} \over \varphi }$$
(2)
$$S = {{\rho D} \over \varphi }$$
(2)The stopping powers of water obtained are given in Table 2. As expected, the stopping power of water exhibited a decreasing relationship with increasing incident particle energy. The stopping power correlation can be approximated as follows by fitting the results in various energies (according to Figure 8):
 $${S_P}\left( {{{{\rm{MeV}}{\rm{c}}{{\rm{m}}^2}} \over g}} \right) = 325\,\cdot\,7{\left[ {E\left( {{\rm{MeV}}} \right)} \right]^{ - 0\cdot83}}$$
(3)
$${S_P}\left( {{{{\rm{MeV}}{\rm{c}}{{\rm{m}}^2}} \over g}} \right) = 325\,\cdot\,7{\left[ {E\left( {{\rm{MeV}}} \right)} \right]^{ - 0\cdot83}}$$
(3)Table 2. Stopping power of protons in water and comparison with NIST, along with relative percentage differences


Figure 8. Proton stopping power as a function of proton energy.
Uncertainty
Figure 9 shows the results of the depth–dose diagram and the statistical uncertainty of the simulation in a typical energy of 150 MeV.

Figure 9. Absorbed depth–dose profile for a 150 MeV proton pencil beam in water phantom (green curve, left-hand axis) and its associated relative statistical uncertainty (purple curve, right-hand axis).
The relative statistical uncertainty for all voxels prior to BPs at all energies was <0·01%. Table 3 also shows the results of the errors in calculating the depth of 73% of the maximum dose and differences between proton ranges and NIST data. The purpose of this comparison was to examine whether the difference was greater than the uncertainty; in other words, whether the difference was significant. The error in calculating R 73 was obtained from the corresponding statistical uncertainty in the dose calculation. To this end, we calculated the uncertainty in measuring the depth of 73% of the maximum dose by adding and subtracting the uncertainty amount in measuring the dose in the voxel corresponding to a depth of 73% of the maximum dose to the absolute value of the dose in the voxel.
Table 3. Comparison between the difference obtained for the proton range with simulation and NIST data and statistical uncertainty

a Continuous slowing down approximation (CSDA) range data in NIST database.
b Disagreement between proton range and NIST data.
It can be seen that in all energies, the difference between proton range and NIST data was smaller than statistical uncertainty.
Discussion
The purpose of this study was to examine the depth–dose profile of ideal proton beams using the GATE Monte Carlo simulation code.
Based on references, a depth of 80% of the maximum dose in the distal fall-off region was regarded as the proton range.Reference Jia, Romano, Cirrone, Cuttone, Hadizadeh and Mowlavi18, Reference Paganetti22, Reference Gottschalk23 This study precisely investigated the proton beam range and revealed that R 73 had the highest compliance with the NIST data. This difference may be due to the accuracy of the employed physics models, as well as the ionisation potential of the medium, which strongly affects the proton range. Since various studies reported the water ionisation potential at 75 eV, we exerted this value in our study.
Moreover, the difference between R 73 and the NIST data was <0·07 mm for all energy ranges. In fact, there was a small difference between R 73 and NIST data, indicating a simulation uncertainty (which was within the statistical simulation uncertainty). At this depth, the relative percentage difference with the NIST data was minimised as much as possible to reach <0·05% in energies below 40 MeV. The overall energy range was below 5%.
To perform more accurate investigations, the least squares method was employed (Figure 5). According to this figure, the observed difference was minimum at a depth of 73% and greater at other depths.
Based on Figure 4, at other depths, such as at a depth of 80% of the peak, this difference increased with increasing energy. This was because only the nuclear part changed with changing the physics, and the nuclear interactions had greater cross-sections at higher energies. The range–energy equations for the range parameters (R peak, R 90, R 80, R 73 and R 50) and their fit equation into a third-order polynomial are presented in Table 1. This formula can be used as a handy reference for future studies.
A more accurate study into the curve (Figure 6) showed that the gradient of the FWHM/2 curve exceeded W (80–20) with increasing initial beam energy. As a result, FWHM changes were more sensitive than changes in the distal fall-off. As a result, FWHM may be a better index in investigating the magnitude of fall-off when performing Monte Carlo simulations for beam transport through a therapeutic beam nozzle.
Nichiporov et al. (2012) showed that the distal fall-off data in the range of 16 cm was similar in both systems and produced sharper dose fall-off at the end of beam range. The analysis of FWHM results showed that BP widths in Indiana University (IU) and Ion Beam Applications (IBA) systems were very similar; however, it was slightly lower in IU. In general, pristine beam properties (PER, FWHM, distal fall-off) were very similar in both systems.Reference Nichiporov, Hsi and Farr24 These similarities are explained though similarities of the gantry beam line.
PER determines treatment efficiency. An increase in this ratio means that a greater dose is received per particle, thereby increasing treatment efficiency. Clearly, higher PER values result in lower doses to patient’s skin both in pristine peak and spread-out Bragg peak (SOBP) field irradiations.
From Figure 7, it can be seen that PER suddenly increased at first and then gradually decreased with increasing energy. The downward trend of the PER curve was due to reduced stopping power at the phantom surface and reduced peak height because of BP broadening at higher energy.
It was expected that the performance of PER was hindered with increasing energy and reducing diameter. Nevertheless, PER can be improved by a proper selection of set-up parameters.Reference McAuley, Slater and Wroe25 For a certain beam energy and field size, PER may be a function of the beam transport system and the nozzle design.
In addition to energy, beam broadening caused by multiple Coulomb scattering in small fields relative to the large fields had resulted in reduced treatment efficiency and PER. This phenomenon reduced the effectiveness of protons, as reported by McAuley et al. (2015). They showed that focused beams can potentially reduce out-scatter particles, which may reduce the efficiency of PER. As a result, they improved the therapeutic dose rate and its effectiveness for a small field by 100%.Reference McAuley, Slater and Wroe25
McAuley et al. (2018) showed that focused proton beams, immediately after penetrating the tissue, can continuously produce beams with higher PER and higher delivery efficiency through magnetic assemblies. Such beams can potentially be used in clinic to irradiate small-field radiosurgical targets with fewer beams, lower entrance dose and shorter treatment times.Reference McAuley, Heczko, Nguyen, Slater, Slater and Wroe26
In general, distal fall-off, along with PER and FWHM values, can be considered as a scale of initial beam uniformity or its ‘pollution’ with low-energy particles.
Furthermore, the difference between the obtained stopping power from simulation and NIST data in all energies (except <15 MeV) was lower than 1%. Also, this difference was 1–9% in energies <15 MeV.
In this study, the stopping power relation (Equation (3)) was obtained by fitting the results in various energies. A similar study was conducted by Bozkurt, using the MCNPX code.Reference Bozkurt27 However, we investigated the overall therapeutic energy range and obtained the fit model using a greater bunch of data.
Figure 9 shows that the relative statistical uncertainty for all voxels before the BP distal tail was lower than 0·01% (oscillations after BP were because of the near-zero values of deposited energy at these depths). The proton range, which was equal to a depth of 73% of the maximum dose in the distal fall-off region, was 157·5 mm. This is in agreement with <0·2 mm in the range of 157·7 mm given by the NIST PSTAR database.
A careful investigation into the statistical simulation uncertainty within all studied energy ranges showed that the difference between 73% of the maximum dose and NIST data was within the statistical simulation uncertainty.
A detailed knowledge of BP characteristics can provide important insights to their clinical use and can serve as handy references to clinical practitioners in their daily practice.
Conclusion
In this study, the GATE Monte Carlo simulation code was used to investigate the ideal depth–dose profile of proton beams within therapeutic energy ranges. Assuming charged particle equilibrium, a high efficiency of the pencil beam geometry method in the depth–dose simulation was reported. The obtained range–energy equations in this study can be used as a handy reference for future studies. This study also showed that 73% of the maximum dose had the greatest consistency with the NIST data. In addition, we showed that FWHM is a more sensitive index than the distal fall-off in the dose distribution curve of proton beams when using Monte Carlo simulation. The results obtained from GATE Monte Carlo simulations of 5–250 MeV protons in a water medium suggested that the stopping power of monoenergetic proton pencil beams can be calculated from the absorbed dose and cell flux. A good agreement was found between this approach and the values provided in NIST standard reference database that was based on computer codes utilising Bethe’s equation. Since the present study only focused on a water phantom, further studies will include heterogeneous phantoms or patient CT data.
Acknowledgements
This work was supported by Semnan University of Medical Sciences.


