


INTRODUCTION
Dose–volume histogram (DVH) is a graphical illustration of the dose received by a volume of tissue during radiation therapy. It can be expressed in absolute value of volume and Gray or in terms of percentages. It is an essential tool for radiation oncologists as it effectively comprises the various dosimetric parameters of a complex radiotherapy plan. 1 It is also an effective screening tool that can help to select from competing plans. A radiotherapy plan once selected by the oncologist will be delivered to the patient in multiple sittings over several weeks. The accuracy of dose delivery in this repetitive process is affected by the errors in daily setup of the patient. These errors are either systematic or random in nature.Reference Murthy, Al-Rahbi, Sivakumar, Davis, Ravichandran and El Ghamrawy 2 The systematic errors are usually corrected within a few days of starting radiation by repetitive imaging. Correction of random errors may require a daily verification process, which is essentially limited by machine time.Reference Booth and Zavgorodni 3 Hence many radiotherapy centres have established online correction strategies and less intense weekly offline checks. The dose distribution of the best possible plan selected by the radiation oncologist can vary in space with the introduction of these random errors.Reference Hurkmans, Remeijer, Lebesque and Mijnheer 4 There arises a question whether robustness of the dose distribution in the setting of setup errors should also be looked into while selecting between competing plans.Reference Cheng and Das 5 Setup error information has been introduced in the DVH for visualising the dosimetric outcomes in proton therapy. The DVHs generated by introducing the range shift values to the histogram has been called DVH band.Reference Trofimov, Unkelbach, Delaney and Bortfeld 6 However, the methodology of generating a DVH band in photon therapy and its utility has not been explored in the past. Hence in this paper, we introduce a method to generate a DVH band for plan evaluation of photon therapy and explore its various potentials.
MATERIALS AND METHODS
To generate a DVH band, we selected inverse planned intensity-modulated radiotherapy (IMRT) plans created in Eclipse™ treatment planning system v.10.0.42 (Varian; Palo Alto, CA, USA) and used for treatment of 20 such patients with head and neck cancers. We reviewed retrospectively the setup errors documented from the treatment of these 20 patients. According to the Institute protocol, the mean of the shifts in each axes for the first 3 days were measured and isocentre shifted to correct for systematic errors. The setup errors noted thereafter were considered as random in nature. These random errors were corrected before treatment on a daily basis for these patients. The maximum observed random error from the documented set of errors through the course of treatment for a patient was identified. We assumed that this maximum observed random error would be the maximum shift in a three dimensional space that can happen to the isocentre during the treatment with respect to the planned treatment centre, considering the random nature of the error.
We converted the x, y, z values of the random error from the isocentre with respect to the three dimensional space, into absolute displacement (S) using the Euclidean matrix formula as follows:
 $$\sqrt {\left( {x_{2} {\minus}x_{1} } \right)^{2} {\plus}\left( {y_{2} {\minus}y_{1} } \right)^{2} {\plus}\left( {z_{2} {\minus}z_{1} } \right)^{2} } $$
where x 2, y 2 and z 2 are the shifts noted in treatment position and x 1,y 1 and z 1 are the planning isocentre which are 0,0 and 0, respectively.Reference Deza and Deza 7
This distance (S) was considered to be the radius of an imaginary sphere around the planned treatment centre within which the actual treatment centre with random errors may lie on a daily basis (Figure 1).

Figure 1 Diagram showing distance (S) or the absolute displacement from the isocentre.
Next we considered that these random errors of the treatment isocentre can happen in all possible direction within this sphere (the radius of this sphere being the absolute displacement ‘S’ calculated using the maximum observed random error and the formula). To generate a new DVH that would happen with random errors of the isocentre, the treatment plan was recalculated with shift in isocentre equal to the displacement (S) in each axis and in each direction (refer Table 1). The beam parameters and the leaf sequences were kept the same as the original plan. Six such plans were generated for each treatment plan. The DVH obtained from six plans for each patient were superimposed to get a composite DVH, which is henceforth referred to as the DVH band (Figure 2). Thus DVH bands were created for all 20 patients. The treating oncologists were asked to review their plans with additional information from the DVH bands created. The DVH bands for the organs at risk (OAR) spine and brainstem for all 20 patients were provided. The maximum spine dose of 45 Gy and brainstem dose of 54 Gy were considered as the tolerance limit for these plans. Plans were rejected if any of the DVH band for spine or brainstem for each patient crossed the tolerance limit as stated above (Figures 3 and 4).
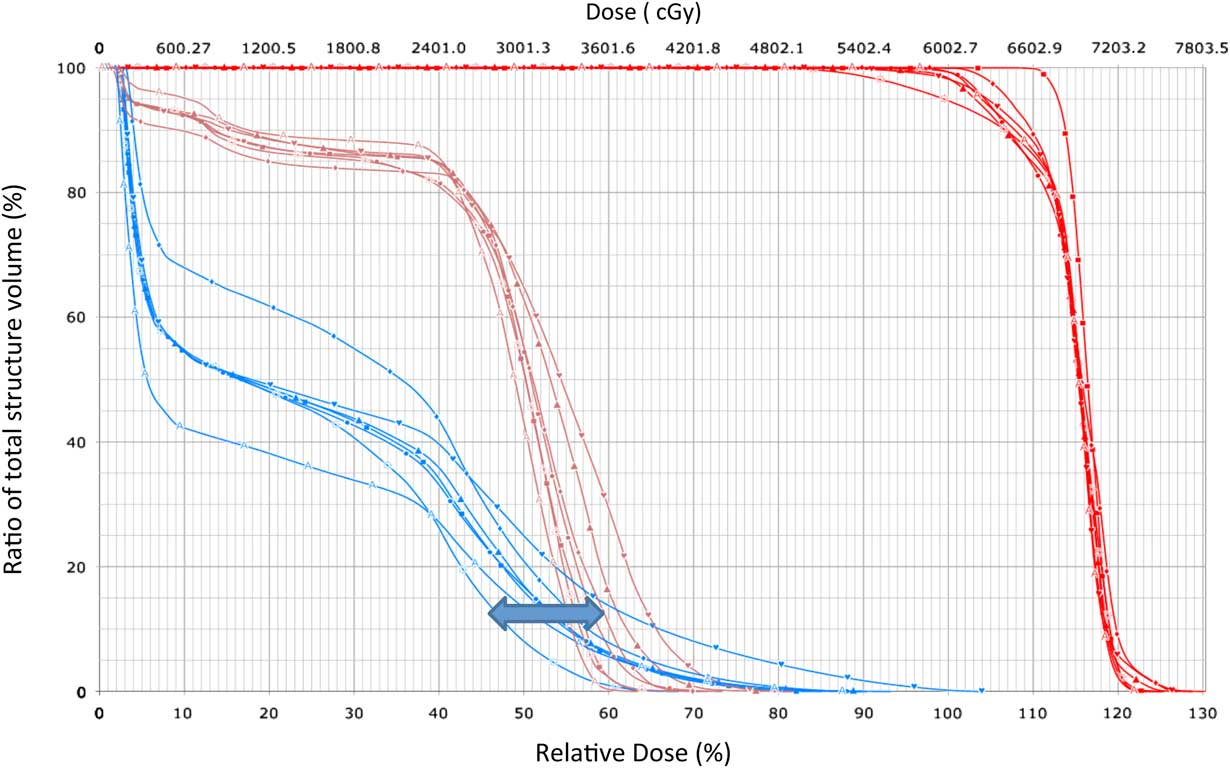
Figure 2 Dose–volume histogram (DVH) band generated from DVH curve.
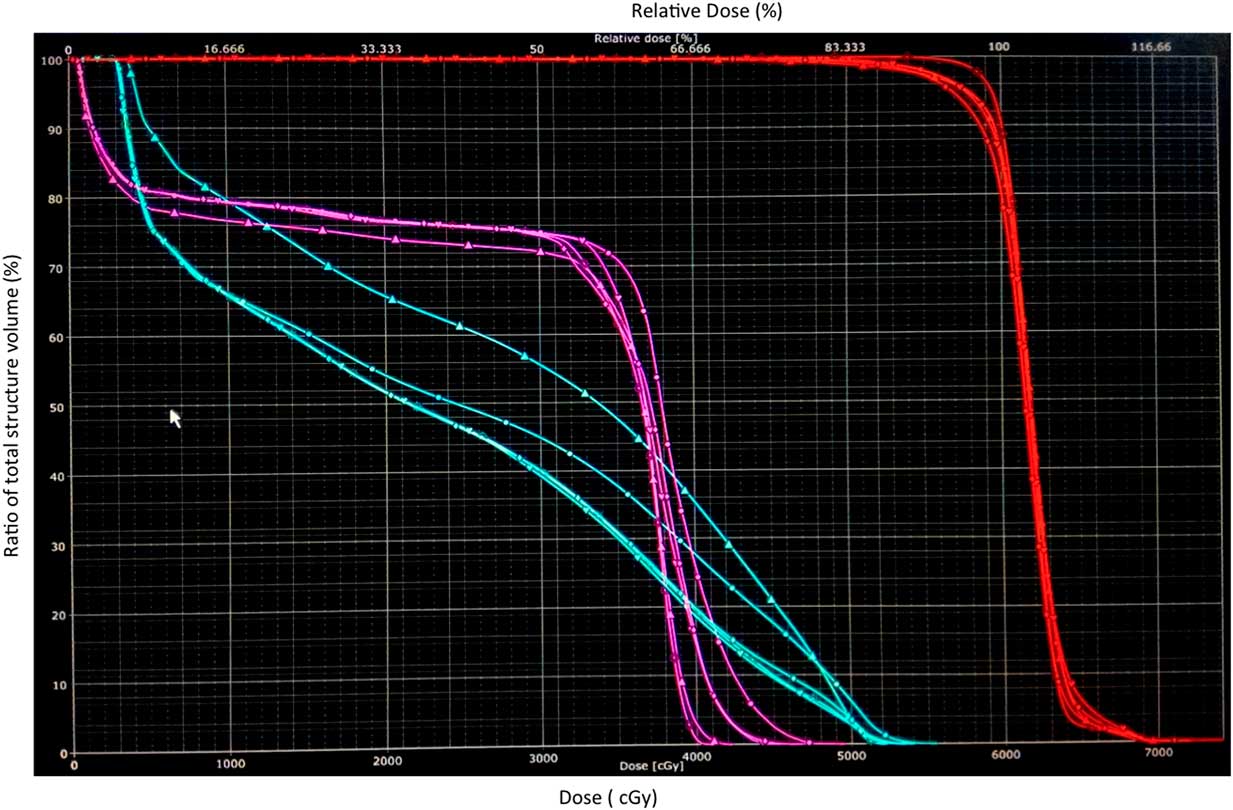
Figure 3 Dose–volume histogram (DVH) band of spine (pink), brainstem (blue) and target (red) in a patient where both DVH band for spine and brainstem crossed tolerance limit.
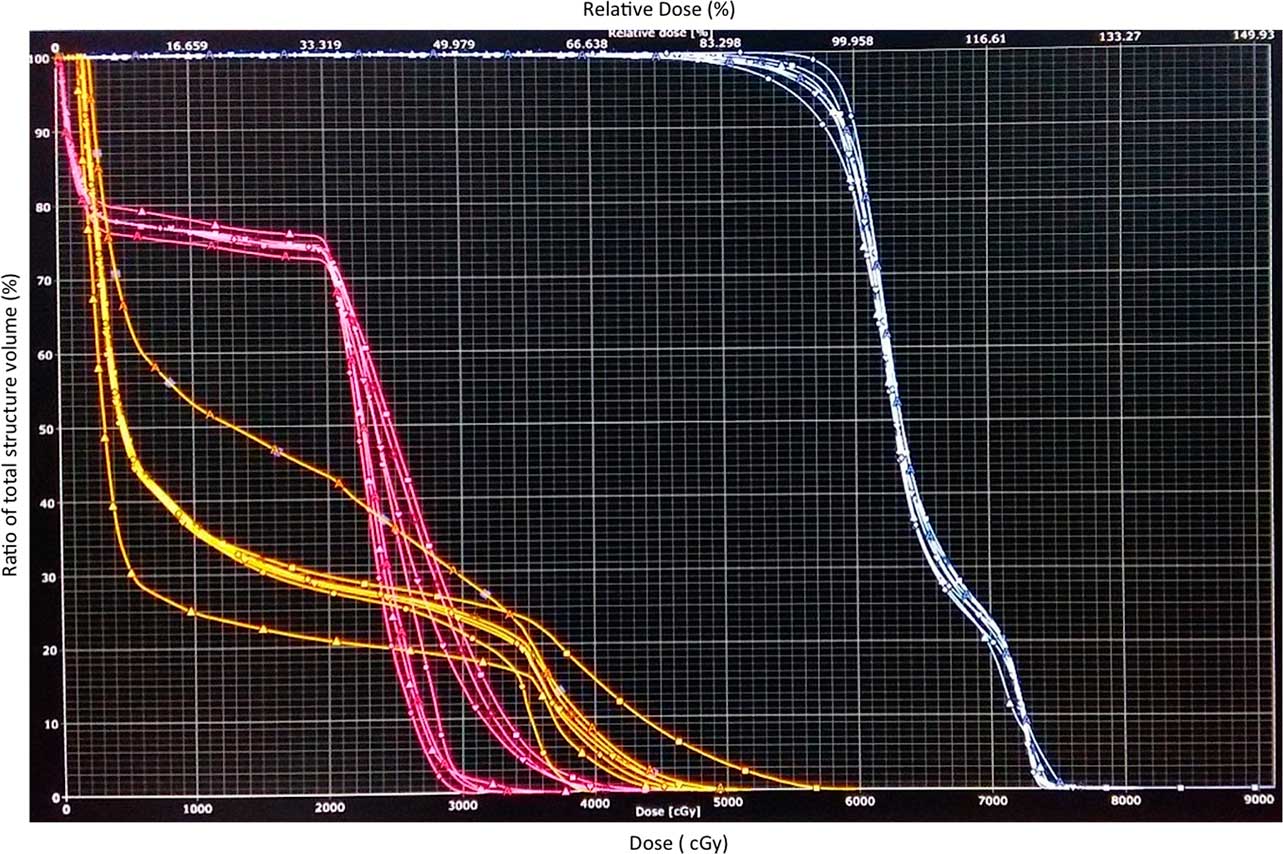
Figure 4 Dose–volume histogram (DVH) band of spine (pink), brainstem (yellow) and target (white) in a patient where plan was not accepted as the DVH band for brainstem (yellow) exceeded the tolerance limit.
Table 1 Method of generating dose–volume histogram band

Abbreviation: S, maximum shift noted from random error and applying Euclidian distance formula.
RESULTS
For the 20 patients the random errors observed ranged from 0 to 5 mm in any axes, the maximum observed random error ranged from 0 to 5·7 mm with respect to the absolute shift from the isocentre. Applying these maximum errors on the individualised plans DVH bands were created for the 20 patients based on the method detailed above. All patients had maximum dose to spinal cord and brainstem within the tolerance limit, in the initial plan used for treatment. The plans were then analysed retrospectively by the treating oncologist. It was found that seven out these 20 plans were rejected as they crossed the set tolerance criteria. There were three patients who had DVH band with spine dose >45 Gy. Three patients had DVH band with brainstem dose >54. Only one patient had a DVH band with both spine dose (49·2 Gy) and brainstem dose (55·6 Gy) exceeding the tolerance limit.
DISCUSSION
Plan evaluation for IMRT in head and neck cancer is important in view of the close proximity of the target dose to spine and brainstem. DVH helps as a plan evaluation tool to select the best plan. However, random shifts that occur during treatment is not accounted into the original DVH.
High-dose regions may lie close to the OAR and this may move into the organ with randomness of the daily setup process. This information is not provided when the oncologist uses the DVH for plan evaluation. According to ICRU 83, with DVH alone, the location of low and high doses can not be located. High doses in the planning target volume (PTV) is less concerning than that in the normal tissue. Moreover, unexpected regions of high-absorbed doses may lie outside the PTV in normal tissue not been specified as an OAR or avoidance regions. 8
Hence lay the importance of the DVH band that can give a good illustration of probable dose received with random errors during radiation therapy. We have generated a methodology to visualise the DVH bands which incorporate setup changes at the time of plan evaluation. We retrospectively reviewed treatment plans for 20 patients. Seven out of the 20 plans were rejected by the treating oncologist in the wake of set tolerance criteria. The use of planning risk volume margins for the OAR deals with the setup errors in treatment and hence avoids over dosage. The utility of DVH band is envisaged in the setting of hypofractionated treatment settings like stereotactic body radiation therapy where in a hotspot near an OAR may be crucial. It may be expected that a robust plan made by the physicist with feedback from DVH band be delivered to the patient less intense offline corrections strategies. This would be useful in resource limited settings where in weekly offline strategies are used for delivering fractionated conformal radiotherapy. The DVH band will also be a good learning tool for training radiographers, physicists and oncologists in visualising the impact of setup on the intended plan. DVH band could be incorporated into the plan evaluation software and thus be useful in clinics.
CONCLUSION
DVH band in photon therapy adds another dimension at plan evaluation. It helps the clinician visualise the impact of setup errors at planning and may help select the plan with lesser influence of setup errors over another. This tool may be built into planning software if its utility is proven in further studies.
Acknowledgement
None


