INTRODUCTION
Political analysts and commentators have struggled to explain the outcome of the 2016 election and the ascension of Donald Trump to the presidency (Roberts Reference Roberts2016). Some have viewed Trump's victory as “the last dying gasp of a dying white male supremacy” and pointed to the political attitudes of millennials—defined as young adults between the ages of 18 and 30Footnote 1—as a source of comfort and hope for American Democratic politics in 2020 and beyond (Davis Reference Davis2017; Kohn Reference Kohn2016; Masciotra Reference Masciotra2016). Electoral maps showcasing millennials’ support for Hillary Clinton over Donald Trump went viral in the days leading up to and following the election for their portrayal of a politically liberal America that largely comprised blue states (Katz Reference Katz2016). Young people, already proven to be an important voting bloc in 2008, represent the future of American politics (Winograd and Hais Reference Winograd and Hais2008; Reference Winograd and Hais2011; Zukin et al. Reference Zukin, Keeter, Andolina, Jenkins and Delli Carpini2006). Examining the political attitudes and preferences of adults ages 18–30 is pivotal to understanding the political direction of the country.
In addition to the amount of attention the 2016 election has received in both academic and public discourse, it also marked a particularly important milestone for young adults. For the first time, the voting-eligible population of millennials equaled that of the large post-WWII generation known as baby boomers (Pew Research Center 2016a; 2016b). While this is significant for a number of reasons, two stand out above the rest for their potential political implications: (1) millennials are the largest and most racially and ethnically diverse generation in U.S. history (Brookings Institution 2016; Pew Research Center 2016a; 2016b), and (2) millennials are, on average, more likely to express liberal political attitudes and preferences than older Americans (Nteta and Greenlee Reference Nteta and Greenlee2013; Pew Research Center 2011; 2017; Ross and Rouse Reference Ross and Rouse2015; Thompson Reference Thompson2016). Scholarship on the relationship between racial diversity and political preferences among young people, however, remains scant. This paper examines how the racial and ethnic diversity of young people impacts their political preferences as reflected by their vote choice in the 2016 election.
Extant literature in political science suggests that race is an important and consequential component of American politics, influencing everything from partisanship and voting behavior to representation and media coverage (Abrajano and Hajanal Reference Abrajano and Hajnal2015; Hutchings and Valentino Reference Hutchings and Valentino2004). Despite the “centrality of race in American politics,” as Hutchings and Valentino put it, however, there exists little work on the role of race in the political lives of America's most racially diverse generation. This is somewhat surprising; it is reasonable to expect that the unique racial composition of the millennial generation bears on their political opinions.
On one hand, this uniquely diverse context may contribute to a “liberalization” of attitudes. Previous scholarship suggests that contact with racially heterogeneous groups can lead to decreases in discriminatory and prejudicial attitudes (Allport Reference Allport1954; Ellison et al. Reference Ellison, Shin and Leal2011; Green and Wong Reference Green, Wong, Borgida, Federico and Sullivan2009; Pettigrew and Tropp Reference Pettigrew and Tropp2006). Moreover, adults born in different eras typically have different beliefs and attitudes that are informed by their historical conditions and harden over time (Glenn Reference Glenn, Brim and Kagan1980). The effects of historical conditions, or “social transformations” like the prevalence of racial diversity and racially diverse perspectives, are often amplified because young people entering and in the early years of adult society are already considered more amenable to changes in viewpoints than older adults (Firebaugh Reference Firebaugh1997; Mannheim Reference Mannheim1927/1952; Ryder Reference Ryder1965). It is not inconceivable, then, that generational replacement and millennials’ racial diversity may have a liberalizing effect on their political attitudes and behavior similar to what scholars and political commentators in 2016 have described.
On the other hand, the literature on political socialization offers evidence that suggests individuals typically inherit their initial political beliefs and partisan attachments from their parents (Niemi and Jennings Reference Niemi and Jennings1991; Jennings, Stoker, and Bowers Reference Jennings, Laura and Jake2009). These findings are bolstered by recent work that finds white millennials are relatively similar to older whites in both partisanship and conservatism (Schildkraut and Marotta Reference Schildkraut and Marotta2017). Indeed, while there is evidence that some attitudes among young whites have liberalized over time, some scholars posit that a more accurate description of young peoples’ contemporary racial attitudes is an “indifference toward societal racial and ethnic inequality and lack of engagement with race-related social issues” (Forman Reference Forman, Krysan and Lewis2004, 179; Forman and Lewis Reference Forman and Lewis2015). In the little work that does exist on race and youth attitudes, often, much like in the general population, there are stark differences in opinion across racial groups (Cohen Reference Cohen2011).
This paper builds on this body of research. Using several distinct datasets, this study explores three primary topics: (1) how race influenced the vote choice of millennials in the 2016 presidential election; (2) comparing partisanship and vote choice among white millennials to older whites; and (3) identifying differences between voting and non-voting white millennials.
In examining the role of race in shaping vote choice in the 2016 presidential election among young adults between the ages of 18 and 30, I pay particular attention to how young whites compare with their peers of color. While each dataset provides slightly different estimates of overall turnout and the effects of race on vote choice, they all suggest a similar pattern—young whites are significantly more likely to have voted for Donald Trump than Hillary Clinton. The findings suggest that being white has an enduring and positive effect on voting for Donald Trump, even when controlling for racial resentment, partisanship, ideology, and other important demographic variables. Race matters to the political preferences of young adults; the diversity of the millennial generation has created conditions such that whites are the outlier racial group among their age group with respect to their electoral preferences.
Compared with older whites, however, young whites do exhibit more liberal preferences as measured by vote choice and partisanship. This offers some support for the liberalizing effect of youth that some studies have claimed occurs through cohort replacement (Desmond and Emirbayer Reference Desmond and Emirbayer2010; Firebaugh and Davis Reference Firebaugh and Davis1988; Welch and Sigelman Reference Welch and Sigelman2011). It is important to note, however, that the present study focuses its analysis on cross-sectional data and thus, can only speak to a particular snapshot in the lifecycle of millennials and not larger generational trends or changes over time.
Indeed, whether the patterns outlined in this paper persist over time may depend on how the composition of millennials who vote changes over time. Comparing white millennial voters and non-voters suggests that a large portion of millennials who did not vote in 2016 were registered voters and do not hold strong partisan or ideological attachments. Whether the turnout and preferences of this group change over time due to future mobilization efforts by candidates and parties or for other reasons may have important implications for future elections.
The paper proceeds by first describing the data and measures used in more detail. I then describe the candidate preferences of millennials in the election of 2016 across datasets before presenting the findings of my analysis, which suggest that race—particularly being white—is an important predictor of vote choice among millennials. I continue by first comparing young whites to older whites on dimensions of partisanship, turnout, and vote choice, and then turn my attention to white millennials as a group. By comparing white millennials who voted in 2016 to those who did not cast a ballot, I offer a preliminary insight into the differences between voters and non-voters. I end with a discussion that connects the findings of the paper to one another and their broader implications.
DATA AND MEASURES
This study compares data from a number of different sources to examine how race structures the electoral preferences of millennials, and in particular, the 2016 vote choice of young whites relative to their peers of color. The datasets used in this analysis are the 2016 American National Election Study (ANES), the 2016 Cooperative Congressional Election Study (CCES), and the September 2017 GenForward Survey. These datasets, while diverse in their samples, methodologies, and estimates, allow for a comprehensive and multi-faceted look at the electoral preferences of young people in 2016. Using a variety of datasets offers an opportunity to uncover patterns that extend beyond any one dataset. As this paper shows, similar patterns often emerge across datasets even if specific point estimates differ between them to reveal larger trends in the electorate.
American National Election Study (ANES)
Released in May 2017, the 2016 ANES is a continuation of a series of election studies conducted since 1948 to analyze public opinion and voting behavior in the United States. Utilizing a dual-mode internet and face-to-face design, the total sample size of the survey is 4,271 respondents. Of those, approximately 842 respondents fall between the ages of 18 and 30, 427 of whom voted for Hillary Clinton, Donald Trump, or somebody else and are included in the analyses.
Cooperative Congressional Election Study (CCES)
Similar to the ANES, the CCES is a nationally representative survey that uses YouGov's matched random sample methodologyFootnote 2 to gather data on the political attitudes and electoral behavior of Americans. Fielded as a web survey every year since 2006, the CCES is unique among national surveys in that it boasts a large sample size and also matches individual responses to the Catalist database of registered voters in the United States, which offers researchers the opportunity to focus their data analysis on respondents that are in fact verified voters. In 2016, the total sample size of the survey was 64,600 individuals. This paper focuses on the 5,471 adults between the ages of 18 and 30 who voted for Clinton, Trump, or somebody else in the 2016 election, 3,392 of which are validated voters.
GenForward Survey
The GenForward Survey is a bimonthly, nationally representative phone- and web-based survey of over 1,750 young adults ages 18–34 recruited and administered by the National Opinion Research Center (NORC) at the University of Chicago that pays special attention to how race and ethnicity influence how young adults experience and think about the world. The GenForward Survey oversamples respondents from communities of color and then weights the data using population benchmark estimates. Fielded in September 2017, the most recent GenForward survey offers data on millennial turnout and attitudes on race and politics for approximately 1,816 adults between the ages of 18 and 34. Limiting the sample to only include respondents 30 years of age or younger that voted for Clinton, Trump, or a third candidate results in a final sample size of 1,130.
Dependent Variable
The main dependent variable of this study is vote choice in 2016. Since the primary interest is in support for Donald Trump, vote choice is coded as a binary variable with 1 = Vote for Trump and 0 = Vote for Clinton. Non-voters and voters who cast their ballot for another candidate are dropped from the regression analyses.
Independent Variables
The primary predictor of interest in this study is race. Respondents who self-identify as white are coded as 1 while Black, Latinx, and Asian American respondents are collapsed into a single “Not white” category that is coded as 0. Flattening the diversity of histories and experiences of Black, Latinx, and Asian American individuals is a troublesome strategy in most cases. However, given that this study focuses on explaining how white millennials are different from their peers in their electoral choices, treating young people of color as an aggregate group that is distinct from whites is an appropriate analytical approach in this case.
Several additional variables that are consequential for political attitudes and electoral preferences are included in the analyses as control variables. Among these are partisanship (Democrat = 0, Independent = 1, Republican = 2), income (larger values = higher income), education (larger values = more education), marital status (not married = 0, married = 1), employment (unemployed = 0, employed = 1), ideology (liberal = 0, moderate = 1, conservative = 2), gender (female = 0, male = 1), and racial resentment (larger values = more resentful).
FINDINGS: WHITE MILLENNIALS AS THE EXCEPTION IN 2016
To assess whether the vote choice of white millennials is distinct from their peers of color, I first compare the raw vote choice numbers across racial groups and datasets.
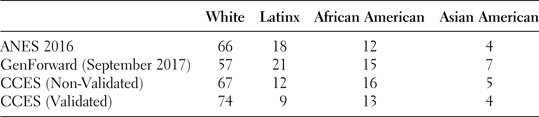
As Table 1 demonstrates, the estimated vote choice percentages for millennials vary by dataset. Despite these differences, however, a clear pattern emerges from the data. Overall, millennials are more likely to have voted for Hillary Clinton over Donald Trump or another candidate. Indeed, there is remarkable consistency in the overall percentages across the CNN Exit Poll, the ANES, GenForward, and the CCES—millennials were roughly 20 percentage points more likely to vote for Clinton than Trump. That millennials were more likely to support Clinton over Trump in the 2016 election is a trend present across datasets validates commentary by pundits and others on the Democratic inclinations of millennials as a cohort.
Table 1. Comparing Millennial (ages 18–30) Vote Choice in the 2016 Election

While millennials may appear Democratic in the aggregate, however, there is substantial variation within the cohort as a bloc. Taking a closer look at vote choice across racial groups, for example, suggests that the Democratic preferences of millennials are not evenly distributed or represented across different demographic groups.
To get a clearer sense of how support for Trump varies by group, I subtract the percentage of Trump vote from the percentage of Clinton vote for each racial group in each dataset and present the differences in Table 2.
Table 2. Trump Vote Share 2016
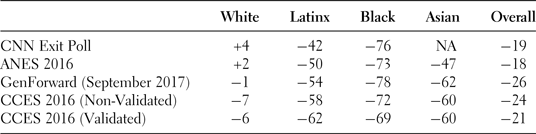
As is evident in the table, young whites stand out as the racial group most likely to have voted for Donald Trump. There is, however, variation on whether white millennials as an aggregate group voted for Trump or Clinton, indicated by a positive or negative sign on the integer, respectively.Footnote 3 According to the CNN Exit Poll and the ANES, white millennials voted for Trump over Clinton. The CCES and the GenForward Survey, however, indicate that white millennials, as a whole, were more likely to vote for Clinton than Trump.
While these differences across datasets are interesting and may warrant further investigation, the precise estimates are less important than the overall trend—white millennials are much more likely to have voted for Trump relative to their millennial peers of color. Black, Latinx, and Asian American millennials across datasets voted for Clinton over Trump by at least 42 percentage points. In the aggregate, millennial support for Clinton is largely driven by millennials of color. White millennials, on the other hand, emerge as an outlier group among their generation with respect to their support for Trump.
To examine whether being white predicts support for Trump, I analyze the data using logistic regression. Table 3 presents the results with each dataset as its own column and clearly demonstrates that the main independent variable of this study—whether the millennial respondent is white or not—is significantly associated with voting for Trump across every dataset. The coefficient on being white is significant at p ⩽ 0.05 for the ANES data, at p ⩽ 0.01 for the GenForward data, and at p ⩽ 0.001 for the CCES data. The other significant variables across all datasets are partisanship, as expected, and marital status. Education, ideology, and gender are significant in a majority of the models.Footnote 4
Table 3. The Effect of Being White on Vote Choice (Logit Coefficients)a
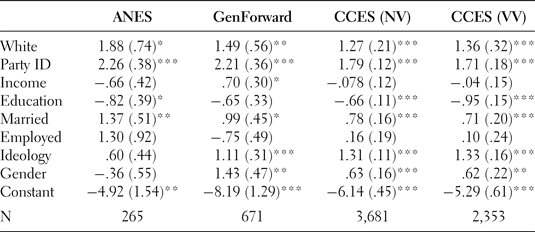
a Running alternative models that include variables for the region and whether respondents reside in a metropolitan area do not change the results presented here.
* = .05, ** = .01, *** = .001.
While logistic regression is appropriate for analyzing binary dependent variables, it is difficult to interpret the magnitude of effects from the coefficients. For that, I calculate the predicted probability of voting for Trump for white millennials and millennials of color (Figure 1).
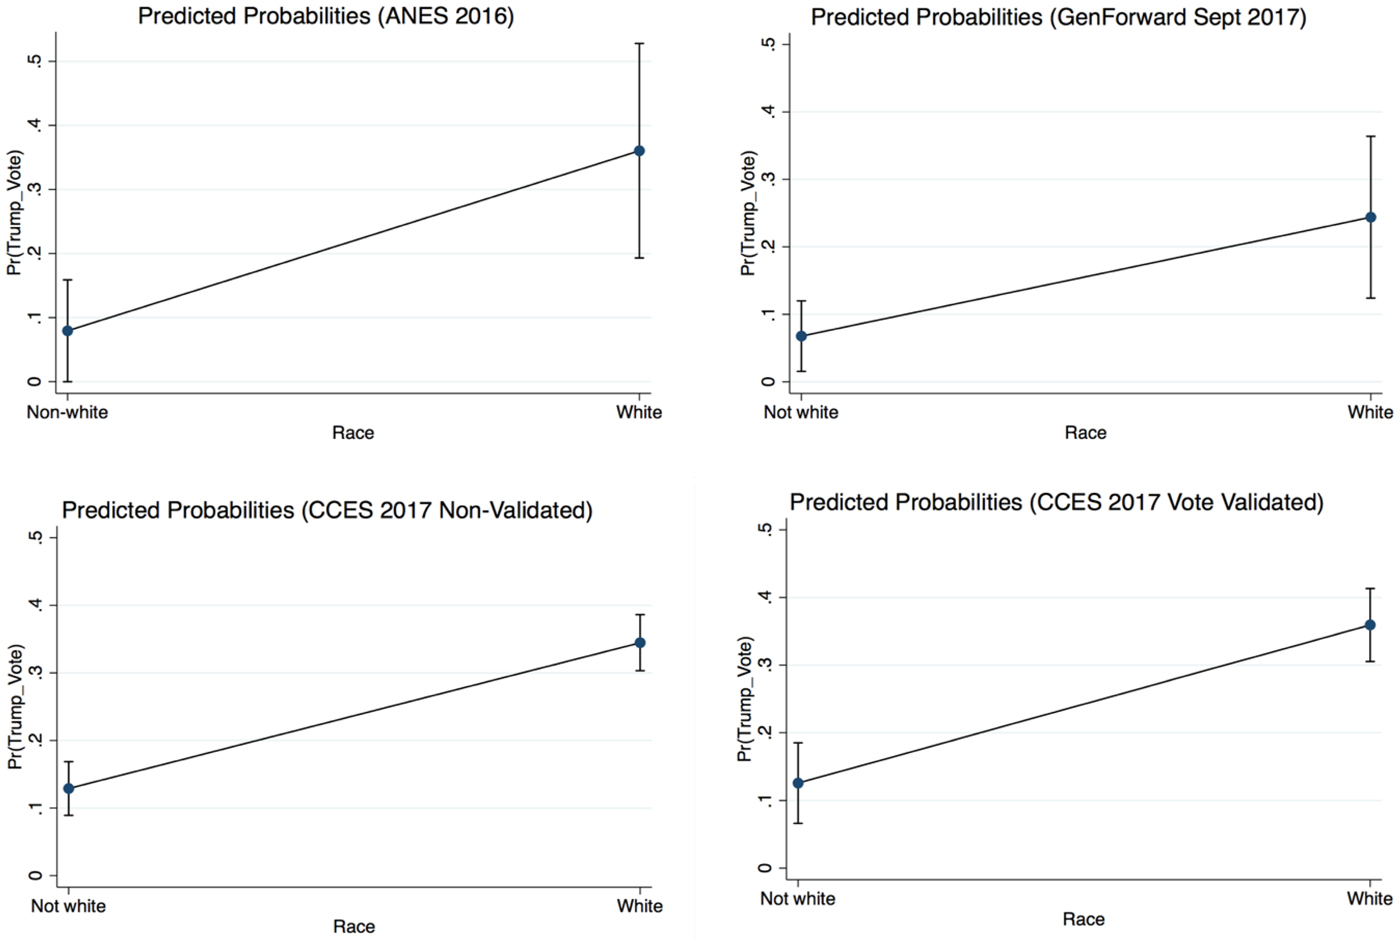
Figure 1. Predicted Probabilities of Voting for Trump, Non-Whites versus Whites
Again, being white is positively associated with support for Trump in the 2016 election across datasets. The predicted probability of voting for Trump as a millennial of color is roughly 10 percentage points. For white millennials, the predicted probability of voting for Trump is approximately 30 percentage points, depending on the dataset. On average, the difference in probability of voting for Trump between white and minority millennials is approximately 20 percentage points.
One potential explanation for the outlier preferences of white millennials is that racial attitudes drive support for Trump. Racial attitudes are predictive of a number of political attitudes and policy preferences (Tesler Reference Tesler2016; Tuch and Hughes Reference Tuch and Hughes2011). Thus, perhaps the effect of being white on vote choice may not necessarily be due to whiteness itself but rather due to white millennials holding more racially conservative attitudes. To test this possibility, I leverage the availability of the racial resentment scale in two of the three datasets, the ANES and the GenForward Survey.Footnote 5
Racial resentment, also known as symbolic racism, is an attitude that emphasizes a lack of commitment to traditional American values by African Americans (Kinder and Sears Reference Kinder and Sears1981; Tesler Reference Tesler2016). Unlike explicit or old-fashioned racism, racial resentment is not about biological racial inferiority (Kinder Reference Kinder, Huddy, Sears and Levy2013). Rather, racial resentment focuses on cultural inferiority and is characterized “by a moral feeling that blacks violate such traditional American values as individualism and self-reliance, work ethic, obedience, and discipline” (Kinder and Sears Reference Kinder and Sears1981, 416). To racially resentful folks, the primary cause of racial disparities and inequality is one's own choices and not prejudice or discrimination.
To measure racial resentment, I use the standard scale developed by Kinder and Sanders (Reference Kinder and Sanders1996) and used by most other scholars that study racial attitudes (Tesler Reference Tesler2016; Tesler and Sears Reference Tesler and Sears2010; Wilson and Davis Reference Wilson and Davis2011). The scale comprises four measures that are designed to tap into the aforementioned attitudes. Each measure is presented as its own assertion and respondents are asked to indicate their level of agreement with each statement.Footnote 6
The scale is constructed from these measures by coding the respondents’ level of agreement from 0 to 1 in intervals of 0.25, with 0 as the least racially resentful and 1 as the most racially resentful response. The scores are then summed across measures and divided by four to reach an easily interpretable score that ranges between 0 and 1.
While the ANES has asked the racial resentment scale in some form since 1986, other surveys do not always include all of the scale's measures. The GenForward Survey, for example, offers a truncated version of the scale. Instead of asking the respondents all four items, the GenForward Survey only asks the first two statements. The truncated scale is a reliable indicator of racial resentment (Cronbach's α = 0.59), despite omitting two items from the standard scale.
As expected, racial resentment has a large and significant effect on vote choice in 2016, as is evident from Table 4. However, including racial resentment in the logit models does not eliminate the effect of being white in either the ANES or the GenForward sample. In other words, even when accounting for the effect of racial resentment, partisanship, and a host of other sociodemographic variables, being white has a positive and significant effect on voting for Donald Trump among young adults ages 18 to 30.
Table 4. The Effect of Being White (with Racial Resentment)
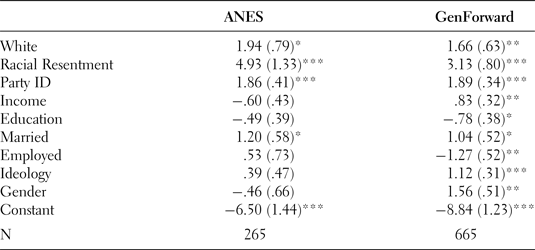
* = .05, ** = .01, *** = .001.
This is also evident from the plotted predicted probabilities in Figure 2. Even when accounting for racial resentment, the probability of voting for Donald Trump in 2016 is significantly higher among white millennials than millennials of color.
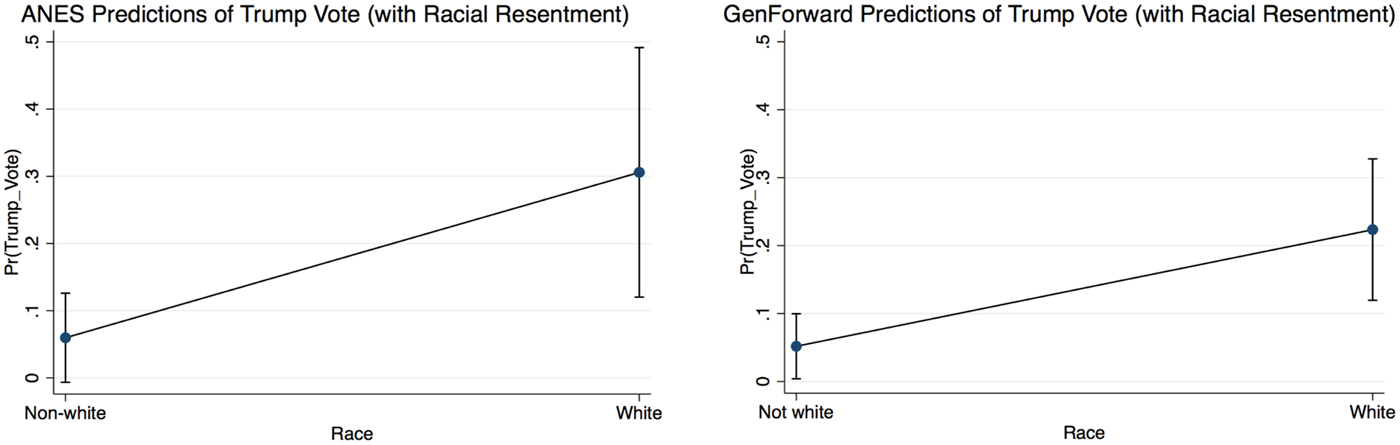
Figure 2. Predicted Probabilities of Voting for Trump (with Racial Resentment)
Perhaps the difference between white and minority millennials’ vote choice in 2016 is simply a reflection of distinct partisan allegiances. Whites, after all, are more likely to identify and vote Republican than other folks, even across demographics like gender and age (Carmines and Stimson Reference Carmines and Stimson1989; Junn Reference Junn2017). I examine this possibility by calculating the predicted probabilities of voting for Trump by both race and party. The results are presented in Table 5.
Table 5. Predicted Probabilities of Voting for Trump by Party ID
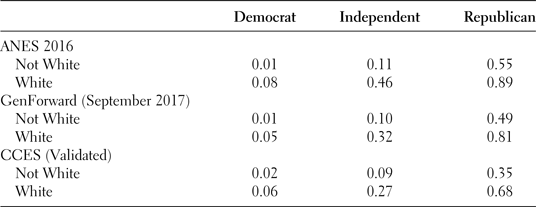
Partisanship plays a large role in determining vote choice. However, as Table 5 demonstrates, the probability of voting for Trump is higher among whites than non-whites regardless of partisanship and across every dataset. While each dataset produces slightly different probability estimates, the overall pattern across datasets remains. Moreover, the difference in the predicted probabilities of whites and non-whites is comparable across datasets even when the specific estimates vary. Self-identified Democrats are the least likely to have voted for Trump in 2016, as expected. But even among this group, there are important differences between white and minority millennials; white millennial Democrats have a higher estimated probability of voting for Trump than non-white millennial Democrats.
Despite being more Republican in their vote choice than their peers of color, young whites do appear more Democratic than older whites. Table 6 presents 2016 ANES data on partisanship, turnout and Trump vote share by both age and race.Footnote 7 As demonstrated by the data, partisanship, turnout, and Trump vote share all vary by age.Footnote 8
Table 6. Millennials Compared with other Age Groups (ANES 2016)

Looking only at whites, young adults between the ages of 18 and 30 are the least likely to identify as Republican. The difference in young whites who identify as Republican and those who identify as Democrat is + 1, indicating that the percentages of young Republican whites and young Democratic whites are roughly equivalent.Footnote 9 Among white adults between the ages of 31 and 60, there is a jump in Republican identification by about ten percentage points. The same is true for whites over the age of 61, suggesting that non-millennial white adults skew Republican.
Trump vote share in 2016 is also lower among young whites. While older whites selected Trump over Clinton by 15 to 21 percentage points, the difference in vote share between Trump and Clinton among whites ages 18 to 30 was 2 percentage points. White millennials were indeed more supportive of Trump than their minority peers, but significantly less supportive than their older counterparts.
Measuring voter turnout via self-reported survey measures is difficult and inexact due to frequent over-reporting; surveys routinely overestimate voter turnout when compared with official estimates (Belli et al. Reference Belli, Traugott, Young and McMonagle1999; Burden Reference Burden2000; Sigelman Reference Sigelman1982). While estimates of millennial turnout in 2016 hover around 50% (CIRCLE 2016), for example, the ANES overestimates this figure by approximately 20 percentage points. Regardless of over-reporting, surveys are nonetheless instructive for the patterns that emerge from the data even if the precise estimates are inaccurate. Comparing the 2016 turnout among whites across age groups suggests that the turnout rate for whites between the ages of 18 and 30 is lower than that for non-millennial white adults. This aligns with the established literature on voter behavior (Wolfinger and Rosenstone Reference Wolfinger and Rosenstone1980; Zukin et al. Reference Zukin, Keeter, Andolina, Jenkins and Delli Carpini2006).
Political engagement can take many forms and, indeed, research on the political participation of young adults suggests that voting is often not the preferred method of participation among youth (Zukin et al. Reference Zukin, Keeter, Andolina, Jenkins and Delli Carpini2006). Lower voter turnout among young people is an important reminder that young voters are not necessarily representative of all young people or even young, voting-eligible people. Young whites may have been more likely to vote for Trump in 2016 but that is not necessarily indicative of whether white millennials (as a cohort) will support the Republican candidate as they age.Footnote 10
It is likely that as millennials age more will cast their votes in elections and some of today's non-voting millennials will influence vote choice in future elections. Therefore, understanding the differences between voting and non-voting millennials in 2016 is important. How are non-voting white millennials, in particular, different from white millennials who cast a ballot in 2016? Given that roughly half of the millennials did not vote in the election (CIRCLE 2016), Table 7 compares white millennial voters and non-voting white millennials more generally using 2016 ANES data.
Table 7. Non-Voters versus Voters in ANES 2016 (White Millennials)
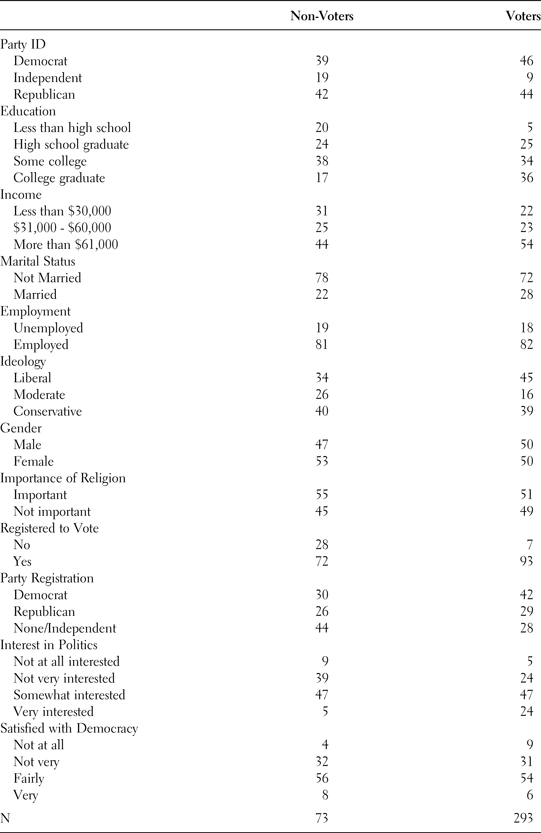
The descriptive statistics in Table 7 illustrate many attitudinal and demographic similarities between white millennials that voted and that those that did not vote in 2016 as well a few important differences. White millennial voters and non-voters are similar in marital status, employment rates, gender, how important religion is to their lives, and their satisfaction with democracy. Non-voters, however, are more likely to identify as Independent and ideologically moderate by approximately 10 percentage points, more likely to fall on the lower end of the income spectrum, and are 19 percentage points less likely to have a college degree compared with voters. Perhaps unsurprisingly, non-voters are also less interested in politics.
These statistics portray a potential swing bloc within the white millennial group and a potential target for mobilization efforts by candidates and parties in future elections. Among white millennials that did not vote in 2016, nearly three quarters report having already cleared one of the largest hurdles to voter turnout—being registered to vote. Of those who are registered, 26% are registered as Republicans, 30% are registered as Democrats, and 44% are registered as Independents or without a party affiliation. How the political preferences of non-voting white millennials in the ostensible middle of the political spectrum develop in future years will be important in future elections. Mobilization efforts targeted at non-voting millennials may be especially rewarding given their lack of strong partisan or ideological commitments and relatively high level of voter registration.
DISCUSSION: CONSIDERING RACE IN THE PREFERENCES OF MILLENNIALS
Many millennial voters have not had the opportunity to vote or otherwise electorally participate in an election that did not include Barack Obama as a presidential candidate. The election of 2016 presented millennials, young adults ages 18–30, with two, perhaps familiar in name and recognition, but otherwise novel candidates. This study sheds light on the role of race in shaping the electoral preferences of millennials in the 2016 election and demonstrates that there was significant variation in support for Trump within the millennial cohort. Far from being a monolithic group with uniformly Democratic preferences, there were considerable differences between white millennials and millennials of color in their vote choices.
Among the most racially and ethnically diverse generation in history, white millennials stand out as the exception in their generation. In 2016, young whites were significantly more likely to have voted for Donald Trump than voters of color. This is evident both in comparisons of the raw vote choice percentages across a number of datasets as well as in regression analyses predicting vote choice while controlling for important factors such as partisanship, ideology, racial resentment, education, and income.
Despite their apparent conservatism (as illustrated by voting for Donald Trump) relative to their peers of color, young whites were less conservative than older whites in the 2016 election. Compared with whites in older age groups, white millennials were the least likely to vote for Donald Trump and identify as Republican. Given that official estimates of millennial turnout suggest only about half of voting-eligible millennials cast a ballot in the 2016 election, it is important to consider how white millennials that did not make it to the polls compare with those that cast a ballot. Indeed, research on millennial turnout suggests that Trump voters were disproportionately likely to vote in 2016 compared with Clinton voters (CIRCLE 2016). The descriptive statistics presented in this paper suggest that non-voting white millennials were more likely to identify as independents and ideological moderates. It is probable that a significant portion of white millennials held unfavorable views toward Donald Trump that were not captured in the final vote choice numbers.
Whether these trends will persist for millennials beyond the ages of 18–30, however, requires further research. While this paper often references millennials as a generation, the cross-sectional nature of the data only allows for a snapshot of preferences and attitudes at this particular point in the lifecycle of millennials. Millennials, in this analysis, are young people. But millennials will not remain young and additional research is necessary to identify whether the patterns discussed in this paper will persist beyond this time in their lifecycle and define the millennial generation as a cohort beyond their youth.
Taken together, these findings offer a portrait of millennial political preferences that is more nuanced than typically portrayed by the media and political observers. As for the general population, race matters to the political preferences of millennials and structures their attitudes in unique ways depending on various aspects of their group identity (Masuoka and Junn Reference Masuoka and Junn2013). The millennial generation is the largest generation in American history, comprises the largest share of the American workforce, and is on the cusp of overtaking the baby boomers as the largest share of the voting-eligible population. Understanding how millennials think, feel, and act given the unique conditions and circumstances of their generational context, especially with regard to race and politics, is important to understanding how America will continue to develop in the years ahead.
Appendix
Table A1. Question-Wording Across Datasets (Turnout)

Table A2. Racial Breakdown of Millennials Across Datasets (weighted %)