


The sorting of the Democratic and Republican Parties in the US Congress into two ideologically cohesive teams that are increasingly divided along a single, left-right dimension of political conflict is one of the most recognised, studied and cited phenomena in the contemporary study of American politics. The traditional account of this sorting and polarisation along a single dimension starts in the 1960s with the Democratic Party becoming the party of racial, economic and social-welfare liberalism, thereby shifting the composition of the two parties (Carmines and Stimson Reference Carmines and Stimson1989; Aldrich Reference Aldrich1995). The Republicans coalesced into a group of conservatives who grew increasingly distinct from the emerging group of liberal Democrats and the structure of competition between the parties collapsed onto a single, left-right dimension.
The most frequent source of evidence cited for the increased polarisation of the parties and the reduced dimensionality of political competition in Congress is the changing pattern of roll call voting in Congress using Poole and Rosenthal’s (Reference Poole and Rosenthal1991, Reference Poole and Rosenthal1997, Reference Poole and Rosenthal2007) NOMINATE scores. Scaling procedures such as NOMINATE claim to show that since the 1970s the ideological distance between the average Republican and Democrat member in Congress and the amount of variance in roll call voting explained by the first dimension have increased. The implication of these findings is that congressional roll call decisions can be explained by a member’s position on this latent left-right dimension.
The push to explain the causes and consequences of polarisation may have been premature given that we have not precisely determined the nature of congressional voting and agenda setting in Congress (Clinton Reference Clinton2012, Reference Clinton2017). Consider that, despite research and ubiquitous journalistic accounts of increasing polarisation, bipartisanship still exists and is more widespread than many recognise (Adler and Wilkerson Reference Adler and Wilkerson2013; Curry and Lee Reference Curry and Lee2019; Harbridge Reference Harbridge2015). Some scholars have noted that a focus on roll calls tends to exaggerate the level of ideological polarisation (Carson et al. Reference Carson, Finocchiaro and Rohde2010; Egar Reference Egar2016). More generally, it is not clear that just because the parties have sorted into two voting blocs that they are equally polarised on all issues: the content of legislation may matter a great deal. Adler and Wilkerson (Reference Adler and Wilkerson2013) argue that the congressional agenda is dominated by compulsory issues and voting patterns are more bipartisan than the literature on roll call voting would lead one to believe. For example, Bateman et al. (Reference Bateman, Clinton and Lapinski2017) show that the parties have become less polarised on civil rights issues if one accounts for the content of legislation in analysing roll call votes. Finally, while the traditional account of ideological polarisation assumes that competition occurs largely on a single policy dimension, there is strong evidence that competition is better captured in multiple policy dimensions (Crespin and Rohde Reference Crespin and Rohde2010; Aldrich et al. Reference Aldrich, Montgomery and Sparks2014; Bateman et al. Reference Bateman, Clinton and Lapinski2017).
In this article, we focus on three main areas of inquiry. First, we explore how closely legislators tie their votes to the actual content of the bills, rather than relying on ideology, cues from the committee(s) of origin, or other strategic factors related to their districts. Second, we work to establish what the dimensionality of choice is for legislation in the US House – does a single dimension suffice or do we need a higher dimensional space to explain legislator behaviour? And last, we provide new evidence on the debate about the level of polarisation that is present in the modern congress.
Our findings suggest that votes cannot be entirely explained by a member’s position on a left-right ideological dimension. On the contrary, we show that roll call decisions are more accurately predicted by accounting for the policy content of legislation, thus implying that members pay attention to the details of the bills under consideration and that there are many distinct policy dimensions underlying political competition in Congress.Footnote 1 We demonstrate this by predicting members’ decisions on final passage votes in the contemporary House of Representatives using the characteristics of the individual bills derived from a structural topics model (Roberts et al. Reference Roberts, Stewart and Tingley2016). We compare the predictive power of the content of bills against other explanatory variables: (1) the committees that originated the bills; (2) the characteristics of the member’s constituency and (3) the member’s first and second dimension NOMINATE scores as a measure of a member’s ideological predispositions.
There are several notable findings. First, we are able to predict roll call votes by members of the House in the majority party at 97% and the minority at 91.3% accuracy on final passage votes, which represents a considerable improvement in the out-of-sample predictive accuracy over alternative models.Footnote 2 Second, this accuracy is driven largely by the substantive content of bills, indicating that bill content rather than ideology is the most salient factor in legislator decisionmaking.Footnote 3 Third, the mapping from bill content to votes is not well characterised by a low-dimensional space; rather, many dimensions underlie choice corroborating Roberts et al. (Reference Roberts, Stewart and Tingley2016). Finally, we find that polarisation is not ubiquitous and instead varies systematically based on the content of the legislation under consideration. Much of the time and on many topics, the two parties cooperate.
These results – along with the literature on bipartisanship in Congress – suggest that congressional scholars need to reconsider the meaning and implications of the roll call record for understanding polarisation and policy outcomes. In the last part of the article, we take a first step in this direction by examining the substantive areas where the minority party is most likely to oppose the majority party.
Theories of congressional roll call voting
In his detailed account of congressional decisionmaking, Kingdon claimed that the problem confronting members of Congress in roll call voting is typical of the dilemma confronting decisionmakers of all kinds: “As a nonexpert who is obliged to make unavoidable decisions about matters in which he is little schooled and to which he is able or willing to devote only limited time and attention, how does he go about making up his mind?” (Kingdon Reference Kingdon1989). What Kingdon acutely understood was that members of Congress have neither the time nor the incentive to become fully informed consumers of the legislation they vote on. First, members have too many votes to consider; they have to make choices about how to allocate their attention given the complexity of legislation.Footnote 4 Second, members have other more valuable activities to invest their time in, such as meeting with lobbyists and constituents, campaigning, and fundraising.
So in lieu of assuming members of Congress are policy experts, Kingdon built a theory of decisionmaking that started with the premise of limited attention and resources. Members gather information, are influenced by other political actors, and are guided by their own ideological system of beliefs. But despite its importance, Kingdon cautioned against using ideology as the sole determinant in explaining votes (Reference Kingdon1989, 273). For Kingdon, members possess an ideology that helps structure how they approach an issue, who they listen to, and where they gather information. But ideology is not the sole consideration in decisionmaking in his account. The importance and visibility of the issues are considered and the signals of other actors (e.g. is there consensus or disagreement?) may be influential.
Despite Kingdon’s cautions about a purely ideological model of voting, this model now dominates the literature. The spatial model of roll call voting is the foundation of many theories of congressional behaviour, and debates have focused on how much ideology matters relative to party (Krehbiel Reference Krehbiel1991, Reference Krehbiel1998; Cox and McCubbins Reference Cox and McCubbins1993, Reference Cox and McCubbins2005; Smith Reference Smith2007). These debates have been informed by the measurement of legislator ideology using roll call votes, most notably Poole and Rosenthal’s groundbreaking NOMINATE procedure (Reference Poole and Rosenthal1991, Reference Poole and Rosenthal1997, Reference Poole and Rosenthal2007). Many scholars, including Poole and Rosenthal, have argued that roll call votes and the resulting summary measures of voting behaviour such as NOMINATE scores are expressions of members’ underlying predispositions or ideology.Footnote 5 These measures have been used in countless studies that examine legislator behaviour and the broader structure of Congress; most recently, NOMINATE scores have been used to demonstrate increasing polarisation in Congress. While there are analyses that consider other influences on roll call voting and examine the limits of ideology as an explanatory factor, Poole’s (Reference Poole2007) claim that members of Congress “die with their ideological boots on” represents the core approach of the Congress field.Footnote 6
Recent scholarship, however, has raised doubts about this claim, demonstrating that scaling procedures such as NOMINATE may obscure the true dimensionality of roll call voting. Crespin and Rohde (Reference Crespin and Rohde2010) show that by limiting the sample to annual appropriation bills, one finds that member preferences are multidimensional. Anderson (Reference Anderson2012) finds that even though domain-specific measures of legislator scores are highly correlated with general measures of ideology such as NOMINATE, there are areas such as agricultural policy where there are important differences that can be consequential for understanding policymaking. And Jochim and Jones (Reference Jochim and Jones2013) show that the ideological polarisation of parties in Congress has not been a uniform process across 18 issue areas they identify using data from the Policy Agendas Project from 1965 to 2004.
These findings are given further support by Roberts et al. (Reference Roberts, Stewart and Tingley2016) who show that multidimensionality in preferences is the typical pattern when roll calls are examined within bill episodes, as well as within major policy areas. What is particularly interesting is that this pattern of multidimensionality begins to disappear when votes are aggregated, suggesting that measures of ideology that aggregate across policy areas may be obscuring the differences across members of Congress.Footnote 7
Finally, scholarship that demonstrates that there is a large degree of bipartisanship in the legislative process (Adler and Wilkerson Reference Adler and Wilkerson2013; Harbridge Reference Harbridge2015; Curry and Lee Reference Curry and Lee2019) suggests that the content of legislation cannot be classified by a simple left-right divide. And, without some understanding of the content of bills, it is difficult to disentangle ideological stories about polarisation from the (possibly) changing content of legislation.
Dimensionality and polarisation
At present, there are few models that predict votes out-of-sample and as a result it is difficult to know what the dimensionality of choice is for legislators.Footnote 8 Our null hypothesis based on the research on ideology cited above is that: (1) one dimension can adequately describe choice and (2) the detailed content of bills is not likely to help predict the voting behaviour of legislators. This null hypothesis is deduced from the spatial model of votingFootnote 9 that assumes members of Congress make decisions by considering their position on a single ideological dimension relative to bills that are located on this same dimension.
Put another way, once one accounts for obvious covariates such as the committee of origin of bills, district and career characteristics and the ideology of legislators, adding features of the content of legislation should not improve our understanding of voting behaviour. The reason for this is straight forward: if legislators are voting based on a spatial model and are ordered from left to right on a single underlying ideological dimension, then adding covariates (based on the substance of the bill or anything else) should not change our ability to forecast votes. For example, if almost all Republicans vote “yea” on a bill restricting abortion rights and Democrats vote “nay”, additional details of the legislation are not required to predict these outcomes. Similarly, if bills on defense and welfare produce the same voting coalitions, we can rely on a unidimensional ideological space to explain choice. The alternative hypothesis, which we test here, is that if other features of a given bill affect votes (e.g. budget mechanisms, issues of federalism, etc.) or if different substantive areas produce different coalitions, then this is inherently a multidimensional choice space and measures of content will improve forecasting performance.
Examining the number of dimensions present in legislative choice also bears on the polarisation debate. The current understanding is that in a unidimensional ideological space, the distance between legislators from opposing parties is increasing.Footnote 10 Given the dependence of NOMINATE on agreement scores between legislators, polarisation depends on the majority and minority party voting differently on the bulk of legislation.Footnote 11 This is a powerful statement that most of the time, legislators from opposing parties diverge and that the debate is framed in left-right ideological terms. The alternative is that the two parties might agree on some dimensions and not on others.
Recently, scholars have provided evidence that the story of polarisation may be more complex (Curry and Lee Reference Curry and Lee2019). Notably, the rate at which majority and minority party members support final passage votes on the floor of the House has not decreased in recent terms of Congress. This runs contrary to what one would expect if the parties were polarised ideologically. Figure 1 shows the percentage of Yea votes for the majority and minority parties from the 83rd through the 114th congresses.Footnote 12 The percentage of Yea votes has increased slightly over this period, whereas the percentage of Yea votes for the minority party has varied but generally not decreased. If the parties have become more polarised over this time period, one would expect that the percentage of time the minority party supports final passage votes would decrease, especially given the salience of these votes. Given that almost all final passage votes are policies supported by most of the majority party (Cox and McCubbins Reference Cox and McCubbins2005), this pattern is puzzling.Footnote 13
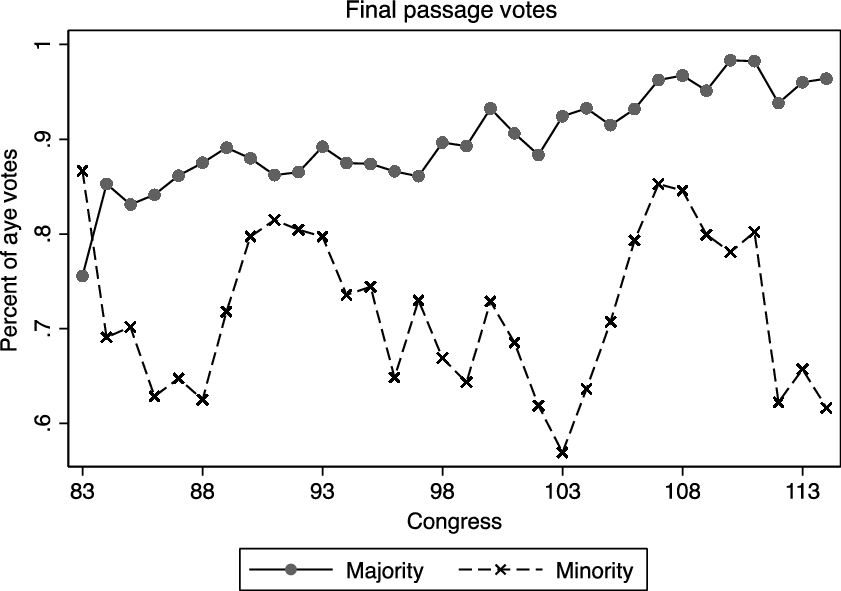
Figure 1. Final passage roll call votes by party status.
We thus have several different explanations for why members of Congress vote the way they do and few attempts in the literature to validate these explanations with out-of-sample tests on a relatively homogeneous sample of bills. We also have an explanation of polarisation that depends crucially on a single-dimensional space and aggregating all types of votes together into one sample. In what follows, we build a predictive model of roll call voting in the House and test the competing theories, focusing our attention on whether the substantive content of bills is useful in explaining legislator voting behaviour. Our approach is to account for all of the mechanisms defined in the literature and then (and only then) see whether or not adding the fine-grained features of legislation improves our understanding of voting behaviour in the House.
Bill topics and legislator voting behaviour
Our main interest is in using the content of bills to explain legislator voting behaviour; doing so depends on extracting topics from the full text of bills before Congress. But, it is important to discuss why feature extraction of this kind is important in the context of predicting votes. After all, if one wants to intervene as little as possible between the data and the model, one could instead build a statistical model that uses word counts from each bill directly. While the total dictionary size for a modern term of Congress is nearly 16,000 unique words [thereby producing an equal number of independent variables (IVs)], regularisation could trim this space substantially.
Unfortunately, regularised regression models fail in the context of predicting votes in Congress for three reasons. First and unsurprisingly, regularised regression models using the complete dictionary of words as IVs underperform regressions using topic models by a sizable amount (for details, see the Appendix). Second, a high degree of correlation exists between words within the same bill and no solution (e.g. n-gramming) eliminates this problem. In general, the correlation between features blunts the ability of high-dimensional regression methods such as the lasso or random forests to successfully capture the systematic component in the data (Conn and Ramirez Reference Conn, Ramirez and Alvarez2016). Finally, while we have many observations due to 435 members of Congress voting on the passage of several hundred bills, this is not as plentiful a source of data as it seems. Bill characteristics (whether words or topics) are fixed for each member of Congress and legislator characteristics are fixed across bills; this is close to a situation where there are more columns than rows. The bottom line is this: our “best” models in terms of out-of-sample accuracy depend on aggressively selecting a parsimonious feature space (Bishop Reference Bishop1995). Feature extraction based on topic models is essential if one wants accurate and stable results of how legislators’ vote and they have the welcome sideeffect of allowing us to more easily interpret the substantive implications of our models.
For this reason, we follow the machine learning literature and engage in the automated extraction of features (i.e. topics) of bills. The main advantage to an automated approach is that it is fast; the disadvantage is that it embeds assumptions about the data generating process (DGP). The best examples of automated feature extraction and the use of text as data are Gerrish and Blei (Reference Gerrish and Blei2011), Wang et al. (Reference Wang, Salazar, Dunson and Carin2013), Grimmer (Reference Grimmer2013), Roberts et al. (Reference Roberts, Stewart, Tingley and Airoldi2013), and Kim et al. (Reference Kim, Londregan and Ratkovic2018). Using topics as independent variables thus allows us to build simple regression models of roll call votes.
We build a predictive model of roll call voting using bill topics as predictors of final passage votes in the US House. If we can predict roll call votes using topics – while controlling for other factors that are commonly identified as salient in the literature – we will substantiate the importance of policy issues as critical to explaining roll call voting. Further, it will corroborate the findings of Roberts et al. (Reference Roberts, Stewart and Tingley2016) that the policy space underlying congressional decisionmaking is multidimensional. We can also inspect the topics of bills and see if polarisation is ubiquitous or instead differs based on content.
The first step in this process is to develop an approach to classify the content of bills, which is described in detail in the Appendix. Given the length of each bill and the large number of bills, coding bills individually “by hand” is not feasible. To classify the issues involved in each bill, we employ semi-supervised machine learning methods. This research is possible because new sources of data exist along with new statistical techniques for handling these data. Gerrish and Blei (Reference Gerrish and Blei2011) and Wang et al. (Reference Wang, Salazar, Dunson and Carin2013) develop and apply a technique for extracting topics from the full text of bills – Latent Dirichlet Allocation (LDA) – and then use the resultant topics in regression models of roll call votes. LDA, however, has issues with multiple local optima. For this reason, we use an extension of LDA, the structural topic model (STM) developed by Roberts et al. (Reference Roberts, Stewart and Tingley2016).Footnote 14 For a list of the topics we ultimately estimated, as well as the frequency and exclusivity of terms within these topics, see Table 1 and Figure 2.
Table 1. Top 50 topics from the STM

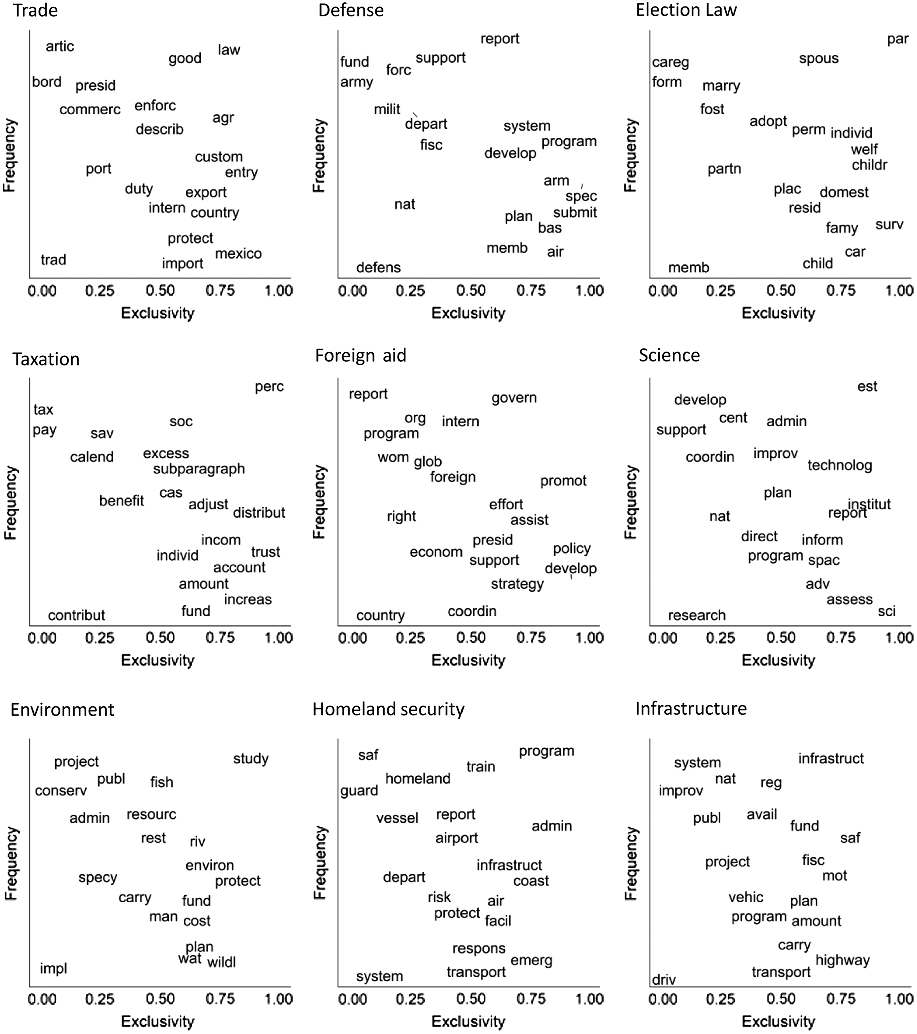
Figure 2. Top nine topics, frequency and exclusivity of terms.
Data and model
To investigate roll call voting, we focus on the 111th through the 113th House of Representatives. This is a good period to investigate voting behaviour because Democrats were in control of the House in the 111th and Republicans had a majority in the 112th and 113th Congresses. In these Congresses, we examine whether members support the final passage of a bill as our target variable. Supporting the final passage of the bill is tantamount to supporting the position of the majority party given agenda control and the fact that almost all final passage votes are supported by a majority of the majority party (Cox and McCubbins Reference Cox and McCubbins2005); only a few votes of the hundreds of the votes in these three Congresses were not supported by a majority of the majority party in the House.
Focusing on final passage votes in each term avoids problems of lumping very different types of votes into a single sample (see footnote 8 and Theriault Reference Theriault2008). This is also necessary if one is to be able to use topics as regressors – implicitly, we are leveraging the fact that if a bill makes it to the floor, the majority leadership is in favour of it passing. Without this strong prior, there is no easy way to interpret the expected direction of the effect of any given topic in a regression. Trivially, it seems obvious that a topic of a bill focused on “women” might mean something very different if the authors and supporters are Republicans instead of Democrats.
Committees, district characteristics and ideology
As noted above, the content of bills has not been the main focus of Congress scholars. To test whether bill text matters against the prevailing theories of Congressional behaviour, we include sets of independent variables that map to the leading theories in the literature. We start with the committee system itself. From the work of Shepsle (Reference Shepsle1979) on structure-induced equilibrium, we have every reason to believe that the committee system creates the salient dimensions of choice in the Congress. In the simplest case where there are not overlapping jurisdictions, each committee is primarily responsible for a single dimension. This arrangement helps members solve the social choice problems of legislating and serves members’ reelection goals by allowing them to dictate policy in those areas that a member’s constituents care most about. Additionally, “deference to committees, long considered an important norm in Congress, suggests that what the committee does will have a great bearing on what Congress chooses” (Aldrich Reference Aldrich1995, 201).Footnote 15 We include a set of binary variables that measure the committees of origin for a bill. This is particularly important because it presents a good test for the value of adding topics derived from the full text of bills – it is entirely possible that once one knows the committee of origin, one does not gain any additional information from bill topics.Footnote 16
We also include variables that account for the policy preferences of legislators’ constituents and the strategic context of their districts. Since the seminal study by Miller and Stokes (Reference Miller and Stokes1963), a basic concern in the study of Congress is whether elected members are responsive to the constituents in their district. We account for district preferences in several different ways using survey data from the 2010 and the 2012 Cooperative Congressional Election Studies (CCES). Each CCES study in those years has over 50,000 respondents, and thus has a sufficient number of respondents per House district to estimate the average district-level policy and ideological positions of the constituents. First, we estimate the average partisanship of the district by taking the placement of the citizens in each district on the standard seven-point partisan identification scale. Second, following Ellis and Stimson (Reference Ellis and Stimson2012), we estimated the symbolic ideology of constituents using the five-point, self-identification ideological scale and the operational ideology using a series of policy questions. For the latter, we conducted a principal components analysis of a large group of policy questions and calculated the first latent factor score. We expect that when Republicans are in the minority, they will be less likely to support the final passage of a bill the more conservative and Republican their district is; we expect that when Democrats are in the minority, they will be less likely to support final passage the more liberal and Democratic their district is.
We also used policy questions to estimate the complexity of citizens’ preferences in the district. Ensley et al. (Reference Ensley, Tofias and De Marchi2009) have shown that the complexity of preferences, or the diversity in the structure of citizens’ policy preferences, affects how well incumbents perform. Incumbents do better in more complex districts. For similar reasons, we surmise that complex districts may lead minority party members to vote more often with the majority party given the larger amount of uncertainty about the best position in their district. Complexity is measured here as the first eigenvalue from the principal component analysis used to estimate operational ideology. The eigenvalue captures how much of the variance in the policy questions is captured by the dimension, thus the larger the eigenvalue, the simpler the arrangement of citizens’ policy preferences in the district.
In addition to the policy characteristics of each member’s constituency, we also control for the level of electoral competition in the district. We include the margin of victory for the incumbent in the last election, the margin of victory for the presidential candidate in the most recent election, a binary variable for whether the incumbent’s party lost the presidential vote and the strength of the primary challenge. For the latter, we include the percent of the vote the incumbent received in the last primary, as well as the margin of victory over the next closest competitor. We also include binary variables for whether the incumbent was a freshman and whether the incumbent had announced his or her retirement.
Finally, we test for the effect of a member’s ideology by using Poole and Rosenthal’s (Reference Poole and Rosenthal2007) DW-NOMINATE scores, which are dynamic measure of a members’ ideology estimated by scaling roll call votes over the course of a member’s career.Footnote 17 We use both the first and second dimension scores given there is evidence that the second may capture some important elements of a member’s policy preferences. We expect that when Republicans (Democrats) are in the minority, the more conservative (liberal) the member is the less likely he or she will be to support the final passage of a bill. Using NOMINATE in this way is in some respects suboptimal; NOMINATE does not yield predictions about novel votes given the inability to determine where a bill’s cut point is prior to votes being recorded. That said, given the polarisation present in these Congresses and the fact of agenda control by the majority leadership, the latent ideology scores should account for some part of the variance if legislator choices are well-captured by a left-right ideology.
Given the number of IVs, it is important to avoid overfitting the sample. Accordingly, we use k-fold cross validation with five folds to focus on out-of-sample performance. The model used in all cases was a simple logit model:
Vote ~ f(topics, committees, constituent characteristics, NOMINATE scores)
The dependent variable is roll call votes in the House – which are either Yea or Nay Footnote 18 – but not all votes are created equal. In fact, many votes are procedural or amendments rather than votes that determine the passage of a piece of legislation. It is difficult to argue that these types of votes spring from the same DGP; worse, including amendments, referenda and procedural votes swamps the more significant votes determining passage. While there are examples of significant procedural and amendment votes, there are strong reasons not to lump different types of votes together (Roberts and Smith Reference Roberts and Smith2003; Theriault Reference Theriault2008; Crespin Reference Crespin2010). Accordingly, our sample consists only of final passage votes.Footnote 19 In the 111th House, there are 297 final passage votes; in the 112th, there are 274 and for the 113th, there are 293; together, this produces over 300,000 roll calls.
The standard for evaluating performance is how well the model fits the held-out sample compared to a reasonable baseline. In the sessions of Congress considered here, the baseline model is the percentage of Yea votes in each session; trivially, a model that predicts Yea for every observation will do well. The regression model thus includes all the variables listed in Table 2.
Table 2. Summary of independent variables

While this model may have the feel of a “kitchen-sink” regression that includes every theoretically relevant variable, we are validating it by how well the model performs out-of-sample with regularisation (i.e. using the lasso) and are thus avoiding the problems typically associated with such approaches. We also explore alternatives to the topic independent variables to see if a more parsimonious (i.e. lower dimensional) representation is possible. Finally, given the structure of topic models, we estimate the above regression for each party and term of the House separately.
Results
We begin the analysis by examining how well the model with the complete set of variables predicts roll call votes in the House. As indicated in Table 3, we do very well forecasting majority party votes with between 96 and 98% predicted correctly (i.e. accuracy). But majority votes are relatively easy to forecast given the power of the naïve model: predicting that a member of the majority will always vote Yea achieves over 90% accuracy.
Table 3. Out-of-sample performance

Note: Gerrish and Blei’s (Reference Gerrish and Blei2011) models of roll call votes using LDA to produce bill topics achieve an overall performance of 89.7% in modern terms.
Focusing on minority members is a sterner test for models of roll call voting and their votes should be the focus of any forecasting model. We expect minority party members to be more responsive to constituency pressures as well as other considerations (Clinton Reference Clinton2006; Smith Reference Smith2007) and the naïve model, that predicts a minority party member votes in favor of final passage, provides a baseline of between 62 and 67% accuracy. In our model, accuracy is approximately 94% out-of-sample for the two Congresses when the Democrats are in the minority. The model is less accurate for the 111th Congress, when the Republicans are in the minority, at 86%. Overall, our model provides a large improvement in fit but with a clear difference in accuracy between the Republican and Democrat minorities.
Given that our model is doing significant work in predicting roll call votes out-of-sample, the next question is which variables are most important to the model. To explore this question, we ran the model with regularisation to push marginally useful coefficients to zero. In short, the answer is that the topic variables, followed at some considerable distance by the committee variables, are doing the most work in predicting roll calls. The constituency variables are doing considerably less, as are the variables related to the members’ characteristics.
Of note is the observation that the ideology of the members is not a significant factor in predicting roll call votes compared to the information provided by the substantive content of bills and the committee of origin. We also attempted to find simpler representations of our (admittedly large) set of independent variables; as detailed in the Appendix, no simpler representation exists. Bills are complex and members of Congress (aided by their professional staffs, cues from other experts, etc.) are making choices on final passage votes in a high-dimensional space that does not map to left-right ideology.
While one could argue that NOMINATE, as a measure of ideology, captures the same information as the substantive topics of bills, that is obviously not the case given our results.Footnote 20 If NOMINATE were a good representation of the substantive topics of bills, then its performance out-of-sample would be high. Instead, NOMINATE performs no better than the naïve baseline model of Pr(Yea) = 1. Put another way, to forecast votes, we need the fine-grained and multidimensional content of the bill topics; a single (or two) dimensional ideology measure does not perform any better than chance. Figures 3–5 demonstrate this another way: even for very high values of lambda in our penalised regressions, which would privilege the simplest representation possible, topics remain the most salient predictors of roll call votes.

Figure 3. 111th Congress.
Note: in all graphs that follow, t# indicates a topic variable and tt# indicates the square of the topic variable. See Table 1 for variable ID’s.

Figure 4. 112th Congress.

Figure 5. 113th Congress.
In Tables 4 through 6, we present the top 15 predictors from each of the logistic regressions with regularisation from the three House terms. The variables are ranked according to the absolute size of the standardised coefficient. These results show that for each congressional term, the top predictors are almost exclusively topic variables or committee variables, with topics dominating. In fact, the only other variable that is in the top 15 predictors is the first dimension DW-NOMINATE score in fifteenth place for the 111th Congress.
Table 4. Top 15 predictors using lasso, 111th Congress

Note: in all tables that follow, t# indicates a topic variable and tt# indicates the square of the topic variable. See Table 1 for variable ID’s.
Table 5. Top 15 predictors using lasso, 112th Congress

Among the top 15 variables in Tables 4–6, the relationship between topics and roll call votes also makes sense substantively. For example, in the 112th Congress, some of the important topics are veterans’ affairs, research and science, manufacturing and memorials and commemorations, which are areas where we may expect some bipartisan agreement. However, other areas where we might expect more conflict, such as business, children and family law and election law, members of the minority party are less apt to vote Yea on final passage. There also seems to be diversity in terms of which committees are significant. For example, in the 111th Congress, if bills originated from Appropriation, Rules, Ways and Means or Education and Labor, members of the minority appear less likely to support final passage. However, there are also committees such as the Intelligence committee where the connections with minority party voting behaviour are less obvious.
Table 6. Top 15 predictors using lasso, 113th Congress

In Tables 4–6, we took advantage of the lasso to select the top 15 coefficients from the logistic regression that have the highest magnitude.Footnote 21 Figures 3–5 show the plot of all of the standardised coefficients against the parameter lambda, which is the penalty the lasso assesses for variables with nonzero coefficients in the model. The figures illustrate that for reasonable values of lambda, only a handful of the variables maintain their predictive power, which reinforces the power of bill topics as the driving factors in legislator voting behaviour.
The last comparison we make in Table 3 is to examine model performance with different subsets of independent variables. The important observation to make from Table 3 is that the predictive power of the models for each congressional term is driven by topics and committee variables. If we run the models with just those variables, the percent correctly predicted is approximately the same as the full models reported in Table 3. Or alternatively, we can see in Table 3 that if we add the constituency variables or the NOMINATE scores, they do not improve the predictive power of the models.
Polarisation results
Finally, we examine the topics that are most likely to incline the minority party to attempt to oppose the majority party. As we noted in the introduction, modern terms of the House do not have high levels of Nay votes, indicating that polarisation may not be as prevalent as is commonly thought. Given the strength of our model in predicting votes and the dominant role topics play in this model, we have an opportunity to investigate the substantive areas of legislation that most incline the minority party to either support or try to defeat legislation.Footnote 22
Our approach is to examine party behaviour by comparing the marginal effects of each topic by party, which indicates whether the party supports (or not) legislation in that substantive area. We focus on the ten topics that have the largest influence in our models.Footnote 23 As can be seen in Figure 6, when the Republicans are in the minority during the 111th Congress, there are several topics that consistently drive them to vote against the majority including bills dealing with veterans, financial regulations and the environment. There are also several topics where they are more unified and vote with the majority leadership including defense, family law and tariffs.

Figure 6. Support for legislation, 111th Congress (Democrat majority).
Figures 7 and 8 show the 112th and 113th Congresses when Democrats are in the minority. Democrats most often split with the majority on bills focused on family law, financial regulations, sex/crime bills, nutrition and US territories. They support the majority on bills concerning veterans, foreign aid, election laws, memorials, foreign policy and homeland security.

Figure 7. Support for legislation, 112th Congress (Republican majority).

Figure 8. Support for legislation, 113th Congress (Republican majority).
The above differences in party support for legislation make good sense based on our understanding of the policy agreements and disagreements between the parties. Democrats and Republicans most often disagree on issue areas involving crime, the environment, finance and health, and they most often agree on issue areas involving defense, foreign policy and homeland security. There are also two highly salient areas where agreement is conditioned on which party holds the majority: family law and veterans.
Overall, though, there is more agreement than disagreement and this is in contrast to the prevailing narrative both in journalistic accounts as well as much of the research on polarisation. Among media sources at the time, for example, there was a widespread conception of Republicans as the party of “no” who were willing to go to any length to stop the Democrats (most especially President Obama) from securing political victories.Footnote 24 This dynamic was reinforced by the rise of the Tea Party. Likewise, Republican leadership in the House in the 112th and 113th Congresses frequently blamed the minority party and split control of Congress for obstructing its legislative agenda.Footnote 25 Yet, in all of the terms studied here, the minority party (whether it is Republican or Democrat) most often voted with the majority party, though with varying support based on the substantive topics of the bills in question (as noted above).
There are, of course, two important limitations to these analyses that should be noted. The first is that the agenda is endogenous, and the absolute amount of legislation decreased dramatically from the 111th to the 113th Congresses. The other is that by focusing on final passage votes, we miss out on important intra-party strife and bargaining, which was particularly prevalent in the Republican-controlled terms in our study. These problems are relevant to all studies that rely on roll call votes. But, topic models, of the sort presented here, at least offer the hope that we can more directly study the content of legislation. And that means that it is possible to examine which topics are excluded from consideration – either due to intra-party strife or lack of support by the minority party. We will take up these problems in future work.
Discussion
Minority party voting in the US Congress has received scant attention in the literature, in part because much of the focus has been on the role of the majority party in controlling the agenda. In this article, we have focused on the roll call behaviour of the minority party across three Congresses, the 111th to the 113th, both because it not only presents a more difficult forecasting challenge but also because it sheds light on the level of polarisation in Congress.
Building off of recent research, our main hypothesis is that measures of bill content based on a structural topics model will be most effective in forecasting legislator behaviour. The out-of-sample predictive power of our models demonstrates that the substantive topics of bills and (to a lesser degree) the committee or origin does an excellent job of predicting roll call voting, whereas alternative variables derived from the literature, including constituency measures, member characteristics, and ideology, do not contribute significantly to our ability to forecast votes.
There are at least three additional implications that we can draw from our analysis. First, these results indicate that instead of relying on ideological shortcuts, members of Congress focus on the substantive details of legislation, at least when it comes to final passage votes.
Second, our results call into question whether stories of a polarised Congress, based largely on NOMINATE scores, should be accepted without further research. This is especially important given that the historical record of minority party support for roll call votes does not provide evidence that polarisation in the modern House is at an apex.
Last, given the diversity and number of topics and committee variables that are significant in predicting roll calls, we believe that the policy space in Congress is highly multidimensional. Monte Carlo simulations and the results presented in the Appendix show that the best models based on out-of-sample performance require at least 50 dimensions to fit roll call data. Overall, a single policy dimension (or any small number) does not do a good job of explaining roll call voting for minority members on final passage votes. If a single dimension underlies roll call voting, then we should have been able to predict minority roll call voting using simple measures, and we should have seen growing resistance to the majority party agenda in Congress. Accordingly, simple stories of divergence in a unidimensional policy space (which underlies most of the polarisation literature) are likely misleading.
Thus, it seems traditional measures of legislator ideology, which are then used to measure polarisation, obscure the deeper reality of congressional politics (Roberts et al. Reference Roberts, Stewart and Tingley2016; Aldrich et al. Reference Aldrich, Montgomery and Sparks2014; Crespin and Rohde Reference Crespin and Rohde2010). Measures of ideology are clearly helpful in understanding expressive and procedural votes. Based on the results presented here, however, this does not hold for final passage votes. Congress only appears to be unidimensional ex post, when aggregating across bill types, aggregating the majority party with the minority and when one includes party-line votes like procedural votes. More than likely, the unidimensionality of roll call voting found by others may reflect how well the parties have solved the collective action problems they confront (Aldrich Reference Aldrich1995; Cox and McCubbins Reference Cox and McCubbins1993, Reference Cox and McCubbins2005; Harbridge Reference Harbridge2015), as opposed to revealing growing differences that can fit neatly into a single, left-right ideological space.
Acknowledgements
We would like to thank Josh Clinton, Frances Lee, Michael Munger, Jason Roberts, and Arthur Spirling for their helpful comments on this manuscript. And, without the tireless work of Keith Poole to provide data to Congress scholars, this work would be impossible to complete.
Supplementary material
To view supplementary material for this article, please visit https://doi.org/10.1017/S0143814X20000069
Data Availability Statement
Replication materials are available in the Journal of Public Policy Dataverse at https://doi.org/10.7910/DVN/3DJVQP


