


Introduction
Academics and policymakers have been interested in detecting fraud and corruptionFootnote 1 for decades. With recent dramatic decreases in data collection and processing costs, many techniques based on hard data have been applied, from investigating deviations from theoretical frequency distributions (Ley Reference Ley1996; Cho and Gaines Reference Cho and Gaines2007; Giles Reference Giles2007) and inspecting changes in reported costs (Tella and Schargrodsky Reference Townsend and Sood2003) to cross-checking multiple sources of data on variables reported by officials (Golden and Picci Reference Golden and Picci2005; Olken Reference Olken and Baroon2009). However, access to data often remains an issue: in many such instances, the authorities are very reluctant to provide data, and it could be that the probability of this happening to a researcher is positively correlated with the incidence of fraud or corruption.
This article contributes to this discourse by applying a detection strategy based on data collected in the field. We focus on possible manipulations in the issue of car registration numbers in the Czech Republic, where car registration plates are allegedly assigned in random order. Repeated mass media reports of deviations from this rule have attributed them to supposed corruption at car registration offices, yet to date there has been no academic study published on this question; the issue was ripe for a more rigorous inspection. The Czech authorities’ reluctance to provide us with any official data meant that we had to look for an alternative way of collecting them. Aside from presenting a unique data collection method, this study also provides evidence about possible non-random allocation practices and their costs, identifies potentially forgone government income as a result of such practices and discusses the relevant implications related to driving conduct, police enforcement and possible applications of our research method.
If car registration plates were truly randomly assigned, the cars’ observable characteristics should be orthogonal to the randomised section of their registration plate numbers. We used a random sample of data on 5,000 cars, collected in the field, to measure the statistical relationship between registration plate numbers and estimated car prices (as assigned by our method using list prices, described below). Our results show that cars with “distinct” registration plates (e.g. 1A2 1111, defined below in detail) have statistically significantly higher prices than other cars (i.e. with “ordinary” registration plates), on average by 12,965 EUR (58%). Moreover, this price difference is greater for smaller categories of “distinct” registration plates (the fewer such registration plates available, the greater the premium); in other words, an average car’s price corresponds to the relative scarcity of its type of registration plate by between 6,917 EUR (31%) and 46,210 EUR (200%).
These results hold after sensitivity tests are performed, and are therefore not contingent upon any particular baseline model setup or special input data. With further corroboration from an additional survey we conducted, we are therefore able to conclude that (1) car registration plates in the Prague district were probably not assigned randomly, (2) the allocation of registration plates in the Prague district seems to have respected the exclusivity of particular registration plate number categories and (3) legally allowing individuals to pay extra for custom registration plates, as prescribed in a recently passed law in the Czech Republic, will not fully eliminate this problem.
This article is organised as follows. The next section briefly refers to previous research in the field of fraud and corruption detection. The third section introduces the car registration system in the Czech Republic and discusses possible drivers of demand. The following sections describe the data and our empirical strategy and report the results, including sensitivity checks. The final sections are devoted to a discussion of the results and to drawing conclusions.
Relation to fraud detection and corruption research
Fraud or data manipulation detection has been a focus in research for over a hundred years. The most frequently used principle for detecting manipulation is simple: the relevant outcome variable is expected to show some theoretical property (e.g. a certain distribution), and suspicious patterns are identified as deviations from this property. Newcomb’s (Reference Newcomb1881) theoretical prediction of digit frequencies in number-generating processes can serve as an illustrative example (thanks to Benford’s work from Reference Benford1938, known today as Benford’s Law). As they show, expected frequencies do not often have a uniform distribution (as fraudsters often wrongly perceive them to) and this enables researchers to clearly identify potentially manipulated data. This principle has been used for the identification of irregularities in many fields – for example, stock market data (Ley Reference Ley1996), eBay bids (Giles Reference Giles2007) or finances used for campaigns reported by political parties in the United States (US) (Cho and Gaines Reference Cho and Gaines2007).
Many other branches of research have developed different versions of the above-mentioned principle, which they have usually extended in two ways: incorporating economics in order to better define potential problematic outcomes or using different (appropriate) previous expectations about distributions. Famous examples have been in the field of sports, where actual results are found to deviate from theoretical outcomes; Wolfers (Reference Yardley2006) thus signalled possible corruption in basketball tournaments, whereas Duggan and Levitt (Reference Duggan and Levitt2002) investigated sumo-wrestling competitions. A similar approach was successfully applied in the detection of election fraud by Cho and Gaines (Reference Cho and Gaines2007) and Beber and Scacco (Reference Beber and Scacco2012), among others, and was used to investigate cheating among teachers by Jacob and Levitt (2003).
Our design implements a similar method to investigate whether suspicious patterns are found in observable variables in the allocation of car registration plate numbers with intuitively appealing combinations of digits. The statistical task is simple in this particular case, because the expected pattern without manipulation should be random assignment (explained in detail below). In line with previous research, we assume different patterns for different types of registrations plates – assuming that manipulators aim to maximise their possible profit (in whatever units) – and we inspect whether our results obey economic predictions.
As our enquiry below reveals, the phenomenon under question is linked to corruption-related research. To detect and measure corruption, perception-based and non-perceptual measures (as classified by Heywood and Rose Reference Heywood and Rose2014) have been used to identify and assess corruption in a number of fields. The former of these techniques are subject to a number of well-known limitations (see e.g. Lambsdorff Reference Lambsdorff2006; Knack Reference Knack2007; or Transparency International 2012), the most essential of which is that, owing to the very nature of corruption, surveys tend to be “more reliable precisely where corruption is less prevalent” (Golden and Picci Reference Golden and Picci2005, 40). This and similar shortcomings led to the expansion of efforts to “measure corruption through market and statistical inference” (Sequeira Reference Shapiro2012, 15). These methods have so far been applied, for example, to measure the stock market’s responses to changes in government (Faccio Reference Fagan and Davies2006), assess the influence of major anticorruption policy changes on reported input costs in hospitals (Tella and Schargrodsky Reference Townsend and Sood2003) or draw inferences from the comparison of physical quantities of infrastructure versus the prices paid by the government in different regions of a given country (Golden and Picci Reference Golden and Picci2005).
Our work extends this branch of research, applying similar methods to look for patterns in publicly available information that may signal corrupt behaviour. In the same way as the papers mentioned above, this methodology enables us to test whether the assignment of registration plates might have been manipulated, enabling policymakers and relevant authorities to observe whether deviation from the rule might be taking place. Nevertheless, it does not provide us with any definitive “proof” of manipulation. At the same time, the article demonstrates a methodology that may be used to pinpoint observable deviations from proclaimed rules across different regions or even countries, and could also potentially be applied to obtain comparable indicators of corruption rates as proposed by Golden and Picci (Reference Golden and Picci2005). This may not only be of relevance in trivial fields such as car registration but also in fields such as law enforcement where its implications may be more significant.
Car registration plates: Czech context and possible use
As stated in the Czech Government Directive 243/2001 (Public Notice Reference Sequeira2001), vehicle registration plate numbers in the Czech Republic are assigned by regional governments in the country’s 15 regions. The assignment of these registration plate numbers is not explicitly required to be random by law, but there are several reasons to take random assignment as a starting point: the Charter of Fundamental Rights and Freedoms (1992) states that all citizens shall be treated equally in official procedures, and that no one should be given preferential treatment in services provided unless the law explicitly prescribes otherwise. Moreover, manipulation of the order in which registration plates are assigned could be interpreted as an abuse of authority (Law No. 40/2009; 2009) or as bribery, if a bribe is accepted (Law No. 40/2009; 2009). There is at least one documented case of an officer being sentenced after accepting bribes for assigning “desirable” registration plates (Vaňous Reference Wolfers2010). As the Prague municipal authorities have repeatedly been questioned about this problem (Křivka 2009; Pražský deník 2010; Blesk 2012) and have repeatedly claimed officially that they assign random registration plate numbers generated by a computer (Czech Television 2011; Holek 2014), this region seemed to be the best candidate for the main focus of our research.
Czech car registration numbers consist of seven characters divided into two parts – one alphanumerical and one numerical; an example is “2A1 1344”. The letter in the first block is a code for the district in which the car is registered (in our example, A stands for Prague), whereas the numbers in the first block represent the series and are issued chronologically starting from 1A1 and ending in 1A0 (very recent series allow two letters, but these have no relation to our enquiry). The second block consists of a four-digit number within that series; it is this number that is (theoretically, at least) allocated randomly.
During the past decade, the Czech press has published a number of articles in which it questions the randomness of the assignment of these numbers (Křivka 2009; Pražský deník 2010; Czech Television 2011; Blesk 2012; Holek 2014; and many more). These claims were based on observations of luxury cars bearing “distinct” registration plates, and the articles investigating random assignment were usually illustrated with photographs of luxury cars bearing registration plate numbers such as 1A2 1111. Obviously, such anecdotal evidence cannot prove that those numbers were not assigned randomly. After all, the “observations” reported may have particularly selected luxury cars with “distinct” registration plates (whether intentionally or unintentionally), and in no instance were those observational findings compared with registration plates observed on non-luxury car types.
The first report of non-subjective evidence on the topic was compiled in November 2013 by Ernst & Young. Their study has not been published; however, in a press release, they reported to have found that 50% of “premium” registration plates were assigned to luxury cars (Ernst & Young 2013). Unfortunately, the press release did not provide details of how they had defined “luxury” cars nor of which registration plates they had considered to be “premium”. In other words, it was not possible to verify whether the result the study found was evidence of corrupt practices or not.
Our approach takes as its starting point the assumption that, if registration plates were indeed assigned randomly, there should be no statistically significant relationship between the registration plate number and the car’s other observable characteristics. By testing whether there is a statistically significant difference in the prices of cars with “distinct” registration plates and those without, we investigated whether there is a chance that authorities might in practice have deviated from the random assignment principle.
To perform any such test, we need to determine which registration plate numbers should be intuitively considered as “ordinary” (meaning undesirable or of no special social value) and which should be intuitively considered as “distinct” (meaning potentially desirable, of potential special social value). Without access to any objective evidence of such social value and its implications, these categories must be determined arbitrarily. It should be stressed again that this arbitrariness cannot undermine our results, because if the registration numbers were truly randomly assigned it would be impossible to define any general combination of numbers that would be correlated with the observations in the way our tests show.
In making this arbitrary selection, we faced a trade-off for practical reasons between including too few categories (e.g. only the most obvious type, such as 1A3 1111, further called type AAAA), which could result in too few cars in the sample for us to be able to draw any statistical inference, or including too many (such as e.g. 1A3 2888, type ABBB), which could make the list too long and the test too imprecise. Based on anecdotal evidence from discussions in daily newspapers and on our own intuition, we decided upon seven “potentially desirable” categories (further called “distinct” and fully described in the next section): AAAA, ABCD, A000, 000A, ABAB, AABB and ABBA. Knowing that our choice was arbitrary, we then undertook further measurements to check how this choice had influenced our results.
Is a “distinct” registration plate a good?
The most probable reason why registration plate numbers might be assigned non-randomly is that there is demand for them to do so; unlike the authorities, car owners do not perceive all registration plate numbers as equally valuable, which naturally causes increased demand for certain specific registration plate numbers. What is the good or service that a “distinct” registration plate might provide to its holder?
First, the registration plate, as a part of the car’s external appearance, represents a design feature, and the willingness to pay for a good’s design attributes is well documented (see e.g. Townsend and Sood 2012). Similarly, some people might wish to have a particular “lucky number” on their plate (Kramer and Block Reference Křivka2008). For example, Chinese car owners may pay thousands of dollars for their lucky number (Yardley 2006).
Second, the registration plate may serve as a signal to other road users during the immense number of anonymous interactions involved in driving, many of which may result in conflicts. Drivers build a visual message for such situations, which includes their choice of car – showing its owner’s attitudes and values (Choo and Mokhtarian Reference Choo and Mokhtarian2004) – and further personalisation of the car (such as bumper stickers or personalised registration plates). Many studies show that such messages are effective in influencing driving behaviour. The pioneering work of Doob and Gross (Reference Duggan and Levitt1968) reported that higher-status cars get less aggressive responses from other drivers (measured by the frequency and length of horn-honking). More recently, McGarva and Steiner (Reference McGarva and Steiner2000) recorded reactions to the same impulse and proved significantly higher aggressiveness against low status cars in all recorded forms. In another field experiment, Guéguen et al. (Reference Guéguen, Meineri, Martin and Charron2014) showed that low status cars are more frequently overtaken in the same pre-arranged situations. Thus, the status message given by a car can be perceived as a protective shield, and we have strong reasons to believe that registration plate numbers can play a part in that message.
The relationship between registration plates and status has deep roots in Czech-related history. In the Austro-Hungarian Empire, low registration plate numbers were reserved for members of the royal family (Zelený and Feuereisl 2011, 47), whereas in newly established Czechoslovakia (1918 and later) different plate colours were used for military cars (Feuereisl Reference Feuereisl2006a). During the Second World War, Germany used special codes for government, police and military fractions (described in detail in Herzfeld Reference Herzfeld2006), whereas the numbers again indicated the car’s importance in the hierarchy (e.g. Heydrich’s car had the (in)famous registration plate “SS-3”). As Feuereisl (Reference Fried, Lagunes and Venkataramani2006b) points out, the Czech communist regime assigned special plates to special groups from the very beginning (AA-marked plates for members of the government and top members of Communist party) and many other strictly defined types for ministries, diplomats, police and more. Interestingly, foreigners were assigned special plates too, in fact with different types allocated to those from communist countries versus those from the rest of the world (Zelený and Feuereisl Reference Zelený and Feuereisl2011, 339).
In these past eras, the rules regarding “distinct” registration plates were stated either explicitly by the law (right of way for government cars, etc.) or implicitly (internal directives for police). Today, only vehicles with diplomatic registration plates officially have a different status in the Czech Republic. So what status can be shown and what benefits can be achieved by having certain types of registration plates? We believe that others may associate a “distinct” registration plate number with a possible signal that the holder is well connected. Assuming there is a widespread belief about the association between potentially illegally (or at least unofficially) obtained registration plates and their holder’s status, the message contained in that signal is the influence required to obtain such a plate. This kind of signal is the most frequently mentioned in the related news articles (Plzeňský deník 2005; Křivka 2009; and many others mentioned below). Furthermore, a recent paper reported evidence that any personalisation of a car seems to be associated with its driver’s higher aggressiveness, as the presence of territorial markings show his or her perceptions of space ownership (Szlemko et al. Reference Tella and Schargrodsky2008). Registration plate numbers are a special case of such personalisation, and if this phenomenon is present in the Czech context it may contribute to the power of a “distinct” plate as a “protective shield”, as other drivers might be aware of that higher probability of aggression.
Third, registration plates may serve as a signal to police officers. A police officer judging a traffic offence often has a choice over whether to punish and whom to punish. In addition, academic papers have analysed many concerns about selectivity in these decisions – for example, possible race considerations (Knowles et al. Reference Kramer and Block1999 among many others) or the role of other factors such as wealth status (Fagan and Davies Reference Feuereisl2000). With reference to a fear of the driver’s possible connections (and hence possible future trouble), policemen in Mexico tend to be “more likely to demand bribes from poorer individuals and to let richer individuals off with a warning”, according to Fried et al. (Reference Frouzová2010, 91). In the Czech context, a “distinct” registration plate (especially when assigned to a high-class car) is considered to signal the same message about the driver’s connections, and the alleged police response is the same, according to many newspaper articles (e.g. Plzeňský deník 2005; Kozumplík Reference Kozumplík2011).
Even if such demand for “distinct” plates exists, the transactions that result in their allocation on demand would not occur unless the authorities are willing to cooperate. As mentioned, any non-random allocation of specific registration plate numbers on demand would break the official procedures and could become a criminal offence. The minimum price (in whatever units) that the officials would theoretically require to comply with a request of this sort should, therefore, at least compensate them for the disutility of a perceived possible punishment and the corresponding probabilities that their crime might be detected and result in conviction (Becker and Stigler Reference Becker and Stigler1974; a review of related works is given in Eide et al. Reference Eide, Rubin and Shepherd2006). If the potential customers offer a price exceeding this minimum, there is an exchange potential. The price paid might be monetary or might be in the form of other goods or services. With sufficiently high demand and sufficiently low punishments and/or low probabilities of punishments, a market for “distinct” registration plates might well emerge. Therefore, we test the following two hypotheses:
H1: The average price of cars with “distinct” registration plates is statistically significantly higher than the average price of rest of the cars.
If the goods they deal with (in this case, car registration plate numbers) are not perceived as homogeneous, the relevant officers can theoretically charge a non-zero price (in whatever units) for obtaining a specific good (a “distinct” registration plate number). Given the possible desirability of “distinct” plates, we have two reasons to expect a statistically significant relationship between car price and the presence of a “distinct” plate: (1) more expensive cars are associated with wealthier owners, who likely have higher purchasing power in the informal transactions needed to obtain a particular type of registration plate (income effect); and (2) more expensive cars re-inforce the possible status signal given by “distinct” registration plates: a higher car price can be construed as lending credibility to that signal, because more expensive cars are more likely used by an individual who is well connected. Practically all articles in the media have connected “distinct” plates with expensive cars (Plzeňský deník 2005; Křivka 2009; Vaňous Reference Wolfers2010; Blesk 2012; and many more):
H2: The average price of cars with plate numbers from the scarcest “distinct” categories (0.1% of the population) is statistically significantly higher than the average price of cars with plate numbers from more abundant “distinct” categories (1% of the population).
This hypothesis extends the first one. If the status goods themselves (i.e. “distinct” registration plates) are also not perceived as homogeneous, then the officers dispensing them could potentially charge different prices for obtaining different categories of “distinct” plate numbers. Theoretically, this could create very good conditions in which the price of each “distinct” plate number could be determined individually: the allocating office holds a monopoly in the allocation of registration plates, which cannot be traded without significant costs (only with a car and within the same registration region, otherwise the registration plate must be changed)Footnote 2 and, meanwhile, the staff working at that office can easily distinguish among “consumer” groups (as they see all the characteristics of the relevant car in the documents and are able to negotiate individually with its owner). Newspaper articles seem to confirm this discretionary allocation (Vaňous Reference Wolfers2010).
Our hypotheses might seem to be built on rather anecdotal evidence. Yet, as mentioned above, if registration plates were assigned randomly (as stated by authorities), there should be no statistically significant relationship between the registration plate number and other observable characteristics of the car.
Data collection and description
The ideal way to investigate which types of cars are assigned which types of registration plates would be to use official data from the Ministry databases. Not only would such data enable us to assess the whole car population and to test the orthogonality of more than one car attribute to the registration plate numbers, but with such a rich data set a computer would be able to identify suspicious patterns by identifying clusters of cars with higher prices (or other attributes) and non-random distributions of registration plate numbers. This method would have avoided any need to arbitrarily define what constitutes a “distinct” registration plate. Unfortunately, we were denied access to that official data despite repeated requests.Footnote 3
Our first challenge was, therefore, to obtain as random a data sample as possible. Simply looking for cars with registration plates we perceived to be “distinct”, as the authors of popular articles had done, was of course methodologically unacceptable.Footnote 4
To maximise cost efficiency, we decided to observe all the cars that passed the most frequented spot in Prague – the Nuselský Bridge – during a randomly assigned time period. A computer randomly assigned us two work days and starting times, in the last week of September 2011. For each of the measurements, we took photos of all the cars that passed the photographer (travelling in one direction). The length of each measurement was defined by the size of the memory card in the camera, which is an exogenous factor: the photographer could not affect the outcome by deciding to include/exclude certain cars into/from the measurement.
In addition to recording the car type and registration plate number, the photographs also recorded which lane the cars were using at the time. To avoid influencing the drivers’ behaviour (and creating any traffic problems), the camera was situated on a pedestrian bridge above the road, where it was not visible to the drivers. The photos were taken from behind, enabling us to determine the exact make and model of each vehicle. In total, we obtained 4,181 photos, each recording between one and three cars. We describe the data set in detail below.
Our second challenge was to accurately assign prices to the cars. In almost all cases (more than 99%), we were able to identify the car’s manufacturer and model and its approximate age (as the interval of years when the model was manufactured). Very often, we were also able to identify its engine type. Using this data and data from the private database produced by Eurotaxglass, which aggregates car prices from sellers across the Czech Republic, we were able to establish an average sales price for each car. We consider the Eurotaxglass database a very credible source of car prices; it is a large database and is used by insurance companies and leading media agencies in the Czech Republic.
Our third challenge was to determine which registration plates should be considered as “ordinary” and which should be considered as “distinct”. As mentioned above, based on anecdotal evidence from discussions in daily newspapers and on our own intuition, we decided upon seven “distinct” categories. As Table 1 shows, the plates that we intuitively labelled as “distinct” together theoretically constitute only 3.08% of the total car population.
Table 1 Theoretical and observed frequencies of selected types of registration plates

Source: Data collected in the field, our own calculations.
The first row of the table shows our code for each category, and the second row gives examples of the category’s number type. The first four categories on the left represent very scarce (around 0.1%) patterns; the remaining three on the right, although still scarce, are relatively more abundant (0.9%). The last row shows the theoretical proportions (scarcity) for each category, calculated as the number of possible combinations in the given category (e.g. for type AAAA, there are 10 possible combinations, 1111 through to 0000) as a share of the total number of registration plates issued in a single series (each series has 104 different plate numbers, i.e. there are 10,000 possible registration plates/series). This gives us a figure of 0.1% for category AAAA. Rows 3 and4 give information about the numbers and shares in our data sample, which will be explained in the next section.
Sample of cars with “ordinary” registration plates
Altogether, we took 4,181 photos, each recording between one and three cars. To obtain a sample of cars with “ordinary” registration plates, we generated a random subsample of 100 photos, from which we excluded cars registered in regions other than Prague, cars with “distinct” registration plates, cargo vehicles, emergency cars and cars with plates issued before the year 2001 (for details of these exclusions, see the Appendix). This produced a subsample of 105 cars with “ordinary” registration plates, for which we coded all the variables defined below. The random subsample was used owing to our limited resources; the valuation of one car, including coding all the variables, lasted approximately 5 minutes, and thus to do this for thousands of cars would have been extremely time-consuming.
Sample of cars with “distinct” registration plates
The sample of cars with “distinct” registration plate numbers consisted of all the cars, from all 4,181 photos, whose registration plate numbers were in our “distinct” categories (while again excluding cars registered outside Prague and other exceptions – see the Appendix). The reason for this asymmetric sampling is that “distinct” registration plates constitute a very small fraction of the registration plate population, and in a sample of around 100 cars there would (probably) be only a few of them, which would not provide sufficient evidence for robust statistics. As we explain below, we corrected for the sampling weights in our statistical tests.
In total, we obtained a sample of 177 Prague-registered cars with registration plates categorised as “distinct”. Row 3 of Table 1 shows the numbers of cars actually observed in our sample in each of the “distinct” categories. Looking at these as a proportion of our data sample (row 4) and comparing them to the theoretical proportions of each category (row 5), it is clear that the composition of our sample is close to that expected in a random sample, and especially close for the more abundant categories (this is given by the larger number of observations in those categories). Generally, therefore, we consider our sample to be reasonably representative of the Prague car registration plate population.
For all the cars in each sample, we coded the following variables: registration plate number, its type according to the categories above (Table 1), the time of measurement, the lane that the car was using, the manufacturer and model. These variables are described in the next section.
In order to test our hypotheses, we needed to assign a price to each car. For this, in addition to knowing the car’s manufacturer and model, we needed to make an assumption about its year of production. This was done by a linear projection that enabled us to estimate when the car was registered. The current registration plate number format has been issued since 1 July 2001. By the time of measurement (September 2011), approximately 1.5 million registration plate numbers had been issued in the Prague region. As the number series are consecutive and a new series is only started once all the numbers in the previous series have been issued, we were able to estimate the year of registration for each car using its series number.
Having established each car’s manufacturer, model and estimated year of registration, the Eurotaxglass database then enabled us to assign a price to each car. Unfortunately, for the majority of the observed cars, we were unable to determine the engine size, and therefore used the lowest price data for the relevant model of car (corresponding to the smallest engine, without additional features). We used price data according to production year, considering the car’s registration year to represent its production year. When the registration year was later than the last year of production for the particular model, we used the model’s last year of production instead of the registration year. To make the price data clearer to non-Czech readers, we have converted all prices to EURO currency, using an exchange rate of 1 EUR=27 CZK.
This method of assigning prices to the observed cars involves a number of assumptions. In an ideal scenario, we would have obtained data about the real prices the cars were purchased for at the time the car was registered. Using the list price, and in a number of instances using new car prices for older vehicles, will have positively biased our estimates. To address this weakness, we repeated all the major statistical tests described in Statistical Tests section, the second time reflecting the age of the cars with discounted prices.Footnote 5 Owing to limited space, we do not present those results here; nevertheless, they did not differ substantially from the results found in the first set of tests, and we can therefore conclude that the test results were not affected by the age distribution. It should be stressed that, if there were any positive bias common across all car prices, this would anyway not undermine the success of our empirical strategy. As there should be no relationship between car price and registration plate number, an overestimation of all prices might lead to an overestimation of any identified differences, but could not lead to a difference being wrongly identified.
Before we turn to the statistical tests, we briefly present the graphical exposition of our data in the subsample of cars with “ordinary” plates (105 cars) and the sample of cars with “distinct” plates (177 cars). In Figure 1, the graph on the left shows the frequency distribution of prices for cars with “ordinary” versus “distinct” registration plate numbers. A visibly smaller share of cars with “distinct” registration plates have prices in the first two segments (0–10,000 EUR and 10,000–20,000 EUR), whereas larger shares of these cars have higher prices, with several outliers in the extremely expensive segments (around 150,000 EUR).
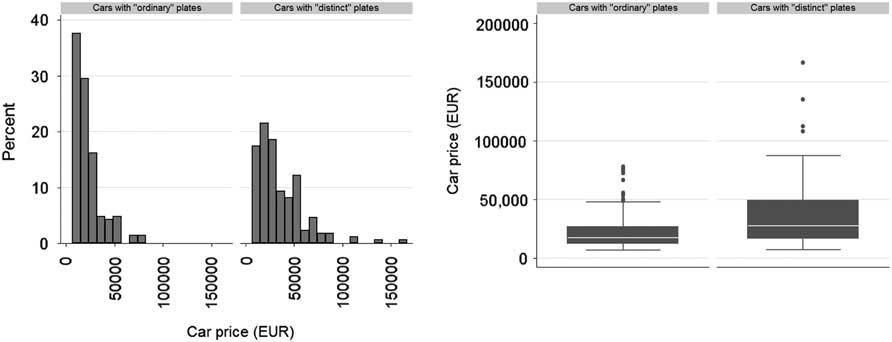
Figure 1 Graphical representation of car price distribution Source: Data collected in the field, car prices from http://www.eurotaxglass.com/.
The right section of Figure 1 shows the comparison of averages (white lines in boxes), 25/75th percentiles (ends of boxes) and 5/95th percentiles (T-bars). The data also show several extreme outliers: we will perform a sensitivity test in which we exclude these and inspect what happens to our results. Generally, these diagrams seem to indicate that registration plates do divide the cars into two different groups, but to make any statistical inference we must perform the statistical tests described in the following sections.
Statistical tests
Having obtained a random data sample, credible price data and clear registration plate number categories, we are ready to perform empirical tests of our hypotheses. As shown in Figure 2, the possible transactions connected to “distinct” registration plates can be perceived as a result of demand or supply interaction. For simplicity, we assumed that there are only two types of registration plates (“distinct” and “ordinary”) and we ignored all costs connected to the transaction.
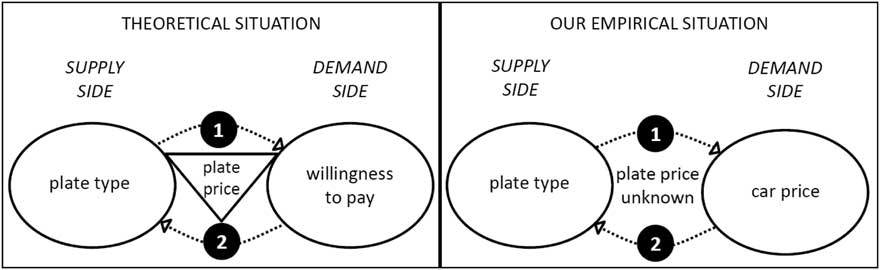
Figure 2 Possible transactions as an interaction of supply and demand
The left-hand side of the diagram (entitled “Theoretical Situation”) shows supply and demand for registration plates theoretically co-determining the possible plate price as an outcome of the transaction. The demand side is composed of car owners who (for whatever reason) are willing to pay a non-zero price to acquire a “distinct” plate and zero to obtain an “ordinary” one; arrow (1) illustrates that the type of plate in question affects the car owner’s willingness to pay. The supply side is hypothetically composed of officials who might assign “distinct” plates according to a car owner’s willingness to pay a non-zero price for such a service; arrow (2) illustrates that the car owner’s willingness to pay might affect the type of plate they are assigned.
In an “ideal case”, we would verify to what extent this type of behaviour is common in car registration plate allocation by collecting data about individual transactions, especially the plate price agreed (monetary or otherwise), the type of plate assigned, cost drivers and factors determining car owners’ willingness to pay (generally supply and demand shifters). As shown on the right-hand side of Figure 2 (entitled “Our Empirical Situation”), however, our information is limited to the type of registration plate assigned and the price of the car to which it is allocated (which we assume to be an approximation of willingness to pay).
With two variables in hand, analysis of variance or multiple t-tests could be used to test our hypotheses. However, we decided to use regression equations, as they enable us to include more control variables and to perform additional tests. Reflecting the diagram above, we can perceive the relationship between registration plate type (the categorical variable) and car price from the demand perspective (arrow 1) or from the supply perspective (arrow 2). Let us consider the Car price i to be the price of car i at the moment its registration plate was assigned (its list price, determined by the process characterised above) and Distinct i to be a dummy variable equal to 1 if car i’s registration plate belongs to the “desirable” category. The regression counterparts would be as follows:
 $$Car\,price_{i} =\beta _{0} {\plus}\beta _{1} Distinct_{i} {\plus}e_{i} \quad {\rm corresponding}\,{\rm to}\,{\rm arrow}\,1\,{\rm in}\,{\rm Figure}\,2$$
 $$Distinct_{i} =\beta _{0} {\plus}\beta _{1} Car\ {\rm }price_{i} {\plus}e_{i} \quad {\rm corresponding}\,{\rm to}\,{\rm arrow}\,{\rm 2}\,{\rm in}\,{\rm Figure}\,{\rm 2}$$
Equation 1 – if interpreted causally – shows that the type of plate affects the car owner’s willingness to pay for its assignment (approximated by car price), whereas Equation 2 – if interpreted causally – shows that the willingness to pay for registration plate allocation (approximated by car price) might result in the discretionary allocation of registration plates and determine which plate is assigned to a particular car; e stands for an error term representing any missing factors. However, as mentioned above, our ambition is not to estimate demand or supply using a structural model (as we do not observe the transaction prices or supply and demand shifters); our empirical exercise aims to detect any deviation from the proclaimed random rule and is focussed on identifying any correlation, rather than its causation. We choose the regression purely for the practical reasons mentioned above, and we use both Equations 1 and 2 in the specifications below.
The baseline regression model was run on the sample of 177 cars with “distinct” plates and the random subsample of 105 cars with “ordinary” registration plates, which gave 282 cars in total. As the samples are unbalanced (the probability of being included in the sample was 100% for cars with “distinct” registration plates and approximately 2.2% for cars without, owing to the need to obtain a sufficiently large sample of “distinct” plates from the collected data), all the regressions reported below were performed using appropriate sampling weights, and robust standard errors are reported in the tables.
H1: a difference in average price between “distinct” versus “ordinary” plate populations
Multiple versions of Equation 1 and Equation 2 led us to coefficients that test H1 and shed more light on the question at hand; these are all reported in Table 2. For example, specification A in Table 2 corresponds to the model based on Equation 1, in which the dependent variable Car price i is the lowest list price for car i and Distinct i is an explanatory dummy variable equal to 1 if car i belongs to any of the “desirable” categories listed in Table 1 (and 0 otherwise). As mentioned above, the input data are composed of 105 “ordinary” cars and 177 “distinct” cars, altogether 282 observations.
Table 2 Relationship between car price and type of registration plate
Source: Data collected in the field, car prices from http://www.eurotaxglass.com/.
Note: Definition: Distinct is a dummy variable equal to 1 if a car belongs to any of the “desirable” categories listed in Table 1, otherwise 0. Measurements (1, 2, 3) are dummy variables equal to 1 for the particular time period during which the car was observed, otherwise 0. Left/Middle lanes are dummy variables equal to 1 if the car was using left/middle lane, otherwise 0. Each column shows the result of a separate regression. Observations are weighted. Robust standard errors are reported in parentheses.
Statistical significance: ***0.01 and *0.1.
In specification A, the coefficient on constant shows that cars with “ordinary” registration plates have an average price (at the time of registration) of 22,067 EUR. At first sight, this appears rather high, but the distribution reveals this number to be realistic.Footnote 6 The median price for this sample is 17,218 EUR, and 75% of cars in the sample are cheaper than 25,181 EUR (using prices for the model variant with the most basic features). The mean is higher due to the prices of the top 25% of cars in the sample, whose prices at the date of registration range from 40,000 to 78,000 EUR (again in their cheapest variants).
The main coefficient of interest is the coefficient of the Distinct variable. In specification A, it shows that cars with “distinct” registration plates have a 12,965 EUR (58%) higher price on average than cars in the “ordinary” sample. The standard error of the estimated coefficient is 2,360, which makes the result significant at all conventional levels. Therefore, at conventional levels of statistical significance, we can reject the null hypothesis stating that cars with “ordinary” registration plates and cars with “distinct” registration plates have the same average price; the results of this first test demonstrate that there is a (substantial) statistically significant difference, and that the cars with “distinct” registration plate numbers have much higher prices, as H1 predicts.
Specification B uses the perspective of supply, and the dependent variable is now Distinct, explained by Car price. The positive and significant coefficient shows that distinct plates are consistently associated with higher prices of cars; more specifically, for every 1,000 EUR increase in car price, the probability of getting a distinct plate increases on average by 0.176%. This increased probability might be interpreted as a manifestation of (at least) two underlying variables: one is the proportion of “distinct” plates assigned by other than a random process (for whatever reason) and the other is the strength of the association between the car owners’ ability to obtain such non-random plates and the price of their car. Thus, the estimated coefficient, which suggests a relatively weak relationship, could still hide a relatively significant proportion of non-randomly allocated plates (assuming a weak correlation between the ability to obtain a non-random plate and car price), or vice versa.
In our third test (specification C), we extend the original model, taking into account further variables. The results are shown in column 3 of Table 2, and the variables are as follows.
The variable Measurement represents a dummy variable for the particular measurement during which the car was observed, from 1 to 4; the last one (Measurement 4) is omitted and serves as a baseline. A significant result for this variable would mean that cars with different (average) prices are observed at different times of the day. As different times of the day can be correlated with different types of car users (e.g. blue collar workers usually drive between 7:00 and 8:00 a.m. and white collar workers later on), this is not implausible, although we did not find it to be true in this particular case.
Lane stands for dummy variables representing the fastest (left lane), middle (middle lane) and slowest lanes (right lane) of the road (the right lane is omitted and serves as a baseline). This enables us to investigate whether there are patterns in the lanes being used by different types of cars.Footnote 7 As the results show, there is no statistically significant difference between the average price of cars in the left (fastest) and the right (slowest) lanes.
The coefficient of Distinct, which interests us the most, remains significant in this extended model, and hardly changes. Taking all the factors available to us in our data into account, we still find a positive and statistically significant positive difference between the purchasing price of cars with “distinct” registration plates and cars without.
H2: relative scarcity is a predictor of car price differences
To obtain a more detailed picture of the pattern observed, we performed separate tests for each of the considered categories. Table 3 shows the results of the regression Equation 1, where Car price is again always the lowest list price for car i and Distinct i is a dummy variable equal to 1 if car i belongs to a given “distinct” category in Table 3 and 0 otherwise. For each regression, we have only used cars from the given category and from the random subsample of cars with “ordinary” registration plates (e.g. for the AAAA type, the regression contained 13+105=118 observations).
Table 3 Regression coefficients showing disaggregated differences in prices

Source: Data collected in the field, car prices from http://www.eurotaxglass.com/.
Note: Observations are weighted. Robust standard errors are reported in parentheses.
Statistical significance: ***0.01, **0.05.
The disaggregated results support the conclusion that some registration plates are assigned non-randomly. Statistically significant differences were found for all categories, and, moreover, the price differences between cars with “ordinary” registration plate numbers and cars with registration plate numbers in the special categories appear to be correlated with the theoretical relative abundance of numbers from those given categories across all registration plates. This is more apparent in the graphical exposition in Figure 3.

Figure 3 Differences in prices with 95% confidence intervals Note: Observations are weighted. Robust standard errors are used. Source: Data collected in the field, car prices from http://www.eurotaxglass.com/.
The figure shows point estimates of differences from the prices of cars with “ordinary” registration plates (diamonds) and their 95% confidence intervals (lines). The first three categories of “distinct” registration plates are very rare (amounting at most to 0.1% of all registration plate numbers issued – see Table 3) and the point estimates of differences range between 21,683 and 46,210 EUR. The three categories on the right represent relatively more abundant types of “distinct” registration plates (from around 0.9% of all numbers issued) and display lower average price differences.
To perform a more rigorous test of the difference between categories within “distinct” plates, concretely those of low relative abundance (0.1% of all plates – types AAAA, 000A and A000) as opposed to other “distinct” registration plates (0.9% of all plates – types ABAB, ABBA and AABB), we ran the regression based on Equation 1 using only 177 cars from the sample of cars with “distinct” registration plates where the Distinct variable is now set to one only for plates from a very scarce (0.1%) category. The coefficient for Distinct is 24,965 EUR and is highly significant with robust SE 6,040, which means that the cars with registration plates of type AAAA, 000A and A000 are on average 24,965 EUR (83%) more expensive than cars with registration plates of type ABAB, ABBA or AABB.
Testing the same relationship from the supply side perspective with Equation 2 brings us a coefficient of 0.000643% (highly significant, with SE 0.000104%), which shows us that very scarce plates (0.1%) are consistently associated with more expensive cars than relatively more abundant though still “distinct” plates (0.9%). More specifically, within the “distinct” cars population, each increase in car price of 1,000 EUR is associated with a 0.643% increase in the probability of the car having a very scarce “distinct” plate number.
Therefore, at conventional levels of statistical significance, we can reject the null hypothesis stating that cars with the scarcest “distinct” plate categories (0.1% of the population) and cars from more abundant “distinct” categories (0.9% of the population) have the same average price. The results of this test demonstrate that there is a (substantial) statistically significant difference, with a much higher price for the scarcest “distinct” plate categories, as H2 predicted.
If a car’s price and the price of its registration plate number (whether zero or not) are correlated, this suggests that the key factor in the choice of a “distinct” number (and therefore demand for such numbers) is the scarcity of that type of number: scarcer numbers might, for example, serve as a stronger signal of their owner’s status. Clearly, this assumption presupposes that officials are able to charge different “prices” (in whatever units) for the issue of different types of “distinct” registration numbers. This possibility will be further discussed in Discussion of Results section.
Both our hypotheses can now be considered as confirmed (more precisely, the null hypothesis about independence was rejected at very low levels of significance in both cases). However, as our results might be influenced by our own assumptions or other factors, we address these next by performing various sensitivity tests.
Sensitivity tests and additional evidence
Sensitivity Test 1: another random sample
The subsample of cars with “ordinary” registration plates crucially influences our results. To decrease any possible bias that could stem from randomly pooling too low a price sample (which is improbable, but not impossible), we drew another random subsample of 100 photos and analysed the resulting 103 cars with “ordinary” registration plates in the same way as above. The results of this analysis using Equation 1 are reported in Table 2, specification D (subsample 2 with controls).
The same patterns are identified as in the first random subsample: the coefficient for Distinct is positive and statistically significant. The average price of cars with “distinct” registration plates is 12,538 EUR higher than the price of cars with “ordinary” registration plates. This value is sufficiently close to the result from the first subsample (12,341 EUR) to enable us to conclude that the first results were not driven by an extraordinarily low-priced subsample. The other coefficients for the second subsample also display the same patterns as before: they are not significant at conventional levels.
Sensitivity Test 2: exclusion of outliers
It might seem that our results were driven by a number of extreme outliers in the sample of cars with “distinct” registration plates. Indeed, the lowest list price for some car models in the sample is 100,000 EUR or more. To address this issue, we repeated the test after removing all cars whose list price is higher than 78,000 EUR (the highest price in the “ordinary” group of cars); 11 extremely expensive cars from the “distinct” sample were removed. The results using Equation 1 are shown in the specification E of Table 2, and once again confirm our results: the cars with “distinct” plate numbers are still on average 8,895 EUR more expensive than the cars with “ordinary” plate numbers, and this difference is statistically significant at conventional levels. Interestingly enough, this difference remains significant at the 5% level even if we reduce the maximum price ceiling further to 26,000 EUR (which is close to the 75th percentile in the “ordinary” cars’ price distribution and to the 47th percentile in the “distinct” cars’ price distribution).
Sensitivity Test 3: the most expensive cars
In order to shed some “non-parametric light” on the data we have, we created a list of the top 10% of cars by price across all subsamples (i.e. the sample of all cars with “distinct” registration plates and both our random subsamples of cars with “ordinary” registration plates, in total 385 cars).
Cars with “distinct” registration plates make up 32 out of these 40 cases in our data (80%), which is very far from their theoretical proportion (177/385=46%). In other words, out of the 40 most expensive cars in our samples, 32 had “distinct” registration plate numbers, whereas based on the theoretical proportion we would expect 18. This result strongly supports the previous results and provides further evidence that the registration plate numbers were probably not randomly assigned in the tested car population.
Our next test related to the most expensive cars questions the categories that might have been omitted by our arbitrary definition of what constitutes a “distinct” number. We look at the most expensive 10% of cars in subsamples 1 and 2 (cars without “distinct” registration plate numbers); these are listed in Table A.1. The shaded cells show which of these cars have registration plate numbers that could also be considered “distinct”, but did not fall into our selected categories. This exercise shows that such numbers do exist (examples are 0102 and 0603), and that our categories may be considered rather conservative as they did not cover all possible numbers that could be considered “distinct”. In any case, we believe that both non-parametric tests support our findings that (many) “distinct” registration plates may have been non-randomly allocated to certain cars.
Sensitivity Test 4: development of differences over time
In order to check that the difference we observed was not driven by “strong years”, we performed a sensitivity check that assessed the development of differences over time by modifying Equation 1 into interactions of year dummies (set according to the registration plate’s year of issue) with the dummy variable Distinct. The results of this test are reported in Figure A.1, where the coefficient and standard error of the interaction for each year are shown. Apart from a very large price difference in 2003, which is the result of very few “distinct” registrations during that year, but three outliers with prices higher than 80,000 EUR, there is no noticeable pattern in the data.
Nevertheless, it is worth noting the results for 2011, where the difference coefficient is close to 0 and loses its statistical significance. As this is not driven by a low number of observations, it might reflect the fact that it followed the year in which the first person in Czech Republic was sentenced for the unlawful allocation of registration plate numbers (Czech Television 2010; Vaňous Reference Wolfers2010) and, partly as a consequence, car registration officers in the Prague district were repeatedly attacked by the media (Pražský deník 2010; Vaňous Reference Wolfers2010). Furthermore, an internal audit (which reported a number of concerns about registration plate assignment) was also carried out in early 2011 (Frouzová Reference Heywood and Rose2011).
Overall, our sensitivity tests failed to falsify our findings, and by and large confirmed them. Our findings did not prove to be biased as a result of an “improbably” cheap subsample of cars with “ordinary” plate numbers (Test 1), nor were they driven by a few extreme outliers (Test 2). The presence of extremely expensive cars in the “distinct” category proved to be disproportionally high, and (as expected) we might have missed some of the “distinct” cars by classifying them in the “ordinary” category (which created negative bias to our results), as shown in Test 3. The final test, Test 4, did not show any significant change over time, although the last year seems to show a drop in the difference that might be attributed to media and legal campaigns connected to this issue.
Additional evidence concerning transactions
The patterns we have found in the data do not only point to some non-random allocation, but also support the theory that registration plates serve as status symbols (given that our findings show that the relative scarcity of a registration plate number is strongly correlated with car price). Yet, so far, all our conclusions about what the results tell us about behaviour have been based on indirect evidence. In order to move beyond mere postulation, we decided to collect further evidence, first from all the articles published in the Czech media related to the topic (both in print and online) and second by conducting interviews with eight people who admitted to have deliberately obtained a “distinct” registration plate number.
Our survey of all print media from 2000 to 2014, using the Anopress database,Footnote 8 revealed 68 articles (many in the list of References; a full list is available upon request) with some connection to our keywords (these included registration plates, related abbreviations and attributes such as godfather, prominent, VIP, which could be associated with status). After eliminating articles that primarily quoted other articles on the list, and those unrelated to potentially illegal manipulations, we were left with 13 articles that directly cited reasons for obtaining or providing “distinct” registration plate numbers. We proceeded to screen online resources in a similar way, initially obtaining hundreds of hits for our keywords, but by narrowing the results down to include only official media sources and removing duplicates we were left with 18 articles related to reasons for obtaining or providing “distinct” registration plate numbers. The evidence from these media articles had no scientific validity, and thus we used it only to provide contextual support to the results of our analysis.
In addition, we conducted eight anonymous interviews in October 2014 with a non-random sample of subjects selected based on claims that the individuals concerned had deliberately arranged the issue of a “distinct” registration plate in the Czech Republic. We obtained the interviewee contacts by a snowball method, contacting our professional and private contacts first, and through them gathered contact details of relevant individuals. All the interviews were conducted in person, with open questions, and the answers were recorded by taking notes. The interview subjects were informed about the purpose of the research and the further use of their responses. We report the results of the media and interview analysis in Table 4.
Table 4 Reported reasons for the demand and supply of “distinct” registration plates
Source: Data collected online and in personal interviews.
Our theoretical expectations about the demand for “distinct” registration plates match the evidence provided by both of these surveys quite well. “Signals to other drivers” and “signals to police” are the most frequent reasons given in media articles for the procurement of such numbers and dominate the interview responses as well. Design or lucky number notions seem to play some part in the subjects’ motivation, but significantly less dominantly so than signalling. On the other hand, two interview subjects also mentioned that “distinct” registration plates can have a possible negative effect in that the cars with those numbers may become a target for vandals, especially because cars with “distinct” registration plate numbers have received very negative publicity in recent years.
As far as supply is concerned, the contextual data provide some evidence as to why officials might allocate registration plate numbers non-randomly; this is summarised in the lower part of Table 4. Most of the articles (in print and online) mention an exchange for services as motivation, although nearly half of them still state that money is a standard form of bribe payment. The prices reported for the allocation of a non-random registration plate number range from 300 EUR to 1,000 EUR, and vary both from region to region (the larger the population, the higher the price) and according to the scarcity of the number type requested. The services exchanged in place of money are rarely specified and are usually referred to as “connections”.
The interviews clarified that almost all such registration numbers are obtained through a middleman, who is usually someone closely connected with a dealer (of new and/or used cars) and who arranges legal services for commission, sometimes including the procurement of non-standard registration plate numbers. The prices the interviewees reported for this service varied (again according to the particular type of number and the region) and were either monetary (in the range 400–1,300 EUR) or in the form of services (barter) within the sector, such as a discount on a car or spare parts.
Discussion of results
Through the analysis described in this article, we have found strong signs of non-random allocation of registration plate numbers. Based on a robust random data set of cars observed in the field, we conclude that registration plates are almost certainly not assigned randomly, given that the incidence of intuitively appealing registration plates is highly correlated with car price (H1). This indirectly confirms that certain registration plates are perceived as a good and certain car owners are willing to pay for them. Our survey among “distinct” registration plate holders suggests that non-random registration plate numbers might be assigned as part of non-formal transactions, which might be carried out for compensation and via intermediaries, usually associated with the car dealer from whom the car is purchased.
Furthermore, the price difference between cars with “distinct” registration plates and those without corresponds to the relative scarcity of the type of registration plate number in question (H2). This is in line with theories of the issuers’ profit maximisation behaviour, as explained in detail in Shleifer and Vishny (Reference Szlemko, Benfield, Bell, Deffenbacher and Troup1993), and later empirically identified, for example, by Olken and Baroon (Reference Olken2009). This relation to scarcity as well as additional evidence from both our surveys suggest that the most frequent reason for obtaining such a registration plate is the status signal it conveys. This “protective shield” phenomenon is in line with the historical experience of the Czech Republic (Feuereisl Reference Feuereisl2006a, Reference Fried, Lagunes and Venkataramani2006b), as well as with related research on driving behaviour targeting other drivers (McGarva and Steiner Reference McGarva and Steiner2000) or the police force (Guéguen et al. Reference Guéguen, Meineri, Martin and Charron2014).
The statistical analysis we performed did not reveal any significant trend over time, yet practically all the people we interviewed (in 2014) reported that the usefulness of “distinct” registration plate numbers decreases over time – in terms of their effect on both the police and the other drivers – and that, to some extent, the public is felt to bear a grudge against such car owners. This trend could be attributed to the numerous media campaigns documenting that such registration plates are the result of corruption (especially during the years 2010–2012) and ridiculing the mafia-like image of the relevant car owners (practically all the articles we analysed made such assertions or were at least written in a critical tone), or it might be the result of improved monitoring in the offices that issue registration plate numbers. As our field observations were made in 2011, more data (from more recent years) would be needed in order to assess whether such a trend has affected the allocation of “distinct” plate numbers in the years since 2011.
Before we turn to the further implications of our research, we must stress that our findings have several limitations. As we were denied access to official data, we were forced to make assumptions about the cars’ years of production and engine details, and in certain categories we obtained only a few observations. Furthermore, if we had had access to the full data from the registration authorities, we would have been able to search for suspicious patterns in registration plate numbers and car prices using a computer (by searching for high-price clusters), and this would undoubtedly have helped us better understand patterns in the assignment of registration plate numbers. Finally, we were unable to expand our work to other regions of the Czech Republic, because collecting further samples, coding them and assigning price data would have been too costly. The validity of our findings outside the Prague region is only confirmed by the evidence from our additional survey analysis, much of which related to practices in other regions (the media articles were related to a wide range of administrative regions across the Czech Republic, and four of our interview respondents had relevant experience from outside Prague).
As far as welfare implications are concerned, if illegal transactions are the cause of non-random allocation, these transactions are associated with multiple types of costs. The first type is related to any crime (see review by Shapiro Reference Shleifer and Vishny1999): transaction costs are borne by both sides, from the identification of the counterpart and the time devoted to negotiations for the preparation of the registration plate number and the transaction itself. Keeping such a transaction secret reduces the efficiency of the system, compared with standard issue procedures for such numbers (see Shleifer and Vishny Reference Szlemko, Benfield, Bell, Deffenbacher and Troup1993 and their comparison to taxation). Furthermore, law enforcement costs must be accounted for. Our data do not tell us what proportion of registration plates are issued illegally; therefore, it is difficult to estimate these costs precisely. Nevertheless, we make an attempt to do so.
There are around 0.5 million car registrations each year in the Czech Republic (Centrální register vozidel 2014), of which 15,400 (3.08%) are allocated “distinct” registration plates (in the categories we defined above). If, say, 10% (c. 1,500) of these allocations would be assigned through illegal transactions – which is a very conservative estimate in light of the results of Sensitivity Test 3 – the overall costs of such transactions could be hundreds of thousands of euros, rather than millions. The significance of the second type of costs may, however, be greater: media and interview evidences suggest that car owners use their “distinct” registration plates as a signal to the police in traffic-related cases, involving bribery or exemption from the rules. Without further evidence, we are reluctant to assign any number to this group of costs, but see its relevance in functioning as a potential bridge to further corruption.
More speculatively, reflecting on research into driving behaviour, “distinct” registration plates might encourage their owner to behave aggressively (in line with the association found by Szlemko et al. Reference Tella and Schargrodsky2008); however, more research would be required in order to confirm a direct link between this kind of status signal and behaviour. It is reasonable to expect that other road users would adjust to such aggressiveness by driving more cautiously; nevertheless, policymakers should still perceive such adjustments as net costs.
Conclusion
We believe that our findings contribute to the related branches of research in several ways. First, this article has enriched discussions of fraud indicators (Duggan and Levitt Reference Duggan and Levitt2002; Wolfers Reference Yardley2006; Cho and Gaines Reference Cho and Gaines2007) and corruption indicators (Tella and Schargrodsky Reference Townsend and Sood2003; or Faccio Reference Fagan and Davies2006) by investigating a new case of detecting possible deviation from rules. Furthermore, we collected our data in a novel way, and thereby show that even where the relevant authority refuses to provide source data (which may often happen in similar cases), suitable data for this type of investigation can be collected by means of observation in the field. Second, our research appears to suggest that issuing officers may provide different registration plates for different prices, which is in line with the expectations of profit maximising theory (Shleifer and Vishny Reference Szlemko, Benfield, Bell, Deffenbacher and Troup1993). Third, our enquiry brings interesting links to other branches of research, including driving behaviour (Doob and Gross Reference Duggan and Levitt1968; or Szlemko et al. Reference Tella and Schargrodsky2008) and law enforcement based on status (Fried et al. Reference Frouzová2010). Moreover, similar concerns might apply in many other countries, where analysis could be carried out using a similar technique.
The analysis we have conducted has lent further empirical evidence to claims of alleged corrupt practice in the allocation of registration plate numbers in the Prague region, but leaves open many avenues for further research. Locally, data from the Ministry of Transport would greatly help to better understand the relationship we have identified between car prices and registration plate numbers, as it would provide a more detailed and truly random sample. Furthermore, an investigation into whether more “distinct” registration plate numbers were assigned to expensive cars by certain groups of officials would enable us to identify where the randomisation rule is being broken, and, after gaining more material evidence, could potentially provide the police with grounds for prosecution.
Academics, corruption researchers and traffic experts might gain considerably from an investigation into the relationship between “distinct” registration plates and driving behaviour. In addition to registration plate numbers’ possible effect on driver aggression (mentioned above), further studies can shed light on the selectivity of police enforcement in the field (in line with Fried et al. Reference Frouzová2010). Such effects could be assessed in similar field experiments and recordings, as created by Doob and Gross (Reference Duggan and Levitt1968) or Guéguen et al. (Reference Guéguen, Meineri, Martin and Charron2014), or through arranged field experiments, as described in McGarva and Steiner (Reference McGarva and Steiner2000) or Fried et al. (Reference Frouzová2010). The perception of “distinct” registration plates by other drivers could similarly be assessed.
Moreover, hard data on accidents (which are currently collected by the Czech Police) would enable researchers to investigate the involvement of cars with “distinct” registration numbers in traffic accidents (controlling for intensity of driving) and, more importantly, to have a closer look at the potential bias in enforcing decisions related to such accidents, including court rulings. In addition, it would be interesting to distinguish the “effect of income” from the “effect of special status” on driving behaviour: better data, in combination with data related to traffic offences, would enable researchers to control for car prices (which are supposedly correlated to the income of their owners) and find the “net behavioural effect” of “distinct” registration plate numbers.
A further example of where this method might be usefully applied is in housing policy – for instance, within municipalities that use a random lottery to assign flats to lower income families – both in the Czech Republic (reported in the newspapers iDNES 2004; Hradec Králové 2011; Aktuálně 2014) and abroad – for example, New York (NYC 2014; New York City Housing Development Corporation 2014). Lottery systems are also used in many other instances, including public tender procedures (reported in Jihlavské listy Reference Knowles, Persico and Todd2014) and grant competitions such as Gate2Biotech (2012). Again, these procedures are not restricted to the Czech Republic (see e.g. lot allocation by Yukon Government Reference Doob and Gross2014). All of these are cases in which randomisation rules apply and from which deviations could be identified using a similar methodology to that presented in this article. A sufficient data sample for each would enable researchers to identify such possible deviations, and can usefully complement studies focussing on transactions affecting public tenders or auctions, such as Porter and Zona (Reference Porter and Zona1993).
Extending the data set to other regions or even countries might upgrade our method from “merely” being able to detect patterns to being able to provide a measure of corruption generated by the comparison of deviations between different regions (or countries). This would be in line with Golden and Picci (Reference Golden and Picci2005). In our case, the extent of corruption would be given by the extent of deviation from the rule in the assignment of registration plates. In relation to other policies (e.g. housing as mentioned above), the extent of corruption would be measured as the “distance” of deviation from the official rule.
Looking at the implications for the current policy, our results indicate that recently passed legislation allowing registration plate numbers to be legally sold (Law No. 239/2013 2013, which shall come into force on 1 January 2016) will only partially eliminate the potential for corruption in the allocation of these numbers. It will partially address demand, where special registration plates are desired for aesthetic reasons, as it enables car owners to legally purchase registration plates consisting of a particular word (similar to the practice in Slovakia or the USA), but it will not allow the purchase of a specific combination of numbers in the standard registration plate format. As our evidence suggests that car owners’ most dominant motivation for obtaining “distinct” registration plates is the desire to show their “distinct” or “influential” status, rather than for design or aesthetic reasons, it seems unlikely that this new law will prevent any corrupt allocation practices from continuing.
One way in which the Czech government could both mitigate the problem and internalise potential benefits would be to issue all “distinct” registration plates by auction, as in China (Yardley 2006). This would enable it to acquire profit from their allocation. For example, if the average price was 370 EUR for each such plate, as proposed by Law No. 239/2013 for customised plates, it would bring in extra revenues of 114,000 EUR per series of 10,000 plates, which is money that may currently go into the hands of any staff and intermediaries who engage in illegal transactions. Of course, the Czech authorities would still need to prevent corruption at the auctions; however, enabling legal purchase of such numbers would confuse the status-signalling effect and thereby eliminate the other welfare costs described above. An alternative to this would be to stop issuing such numbers at all: series would be produced without such numbers and they would not become a subject of interest. This would suppress this signal, but would generate no extra monetary profit for the state. Even though both these systems could potentially lead to different “distinct” categories emerging, we believe that both would bring fewer opportunities for corruption (as all other possible “distinct” categories are harder to communicate, the most obvious ones being those apparently exploited under the current system).
Acknowledgements
The authors thank to Michal Polák of Eurotaxglass who kindly provided free access to the company’s databases. We are grateful to Josef Montag, Eva Hromadková, Katarína Stehlíková, editor Peter John and anonymous referees for their helpful comments. Special thanks also go to Jiří Ovčáček, who processed the data, and to Rachel Danna and Annie Bartoň for their language editing and comments.
Appendix: Cars excluded from the measurement:
-
1. All registration plate numbers issued in regions outside of Prague. We focussed on Prague-issued numbers because the Prague Municipality has repeatedly insisted publically that it practices random assignment.
-
2. All cargo vehicles. Although similar signalling effects may exist in the case of cargo transport, with the small number of cargo vehicles observed (as vehicles with a weight exceeding 7.5 tonnes were prohibited at the location of our measurement), including these in our analysis would have meant introducing greater variance (and a lot of pricing dilemmas) into our measurement.
-
3. Police cars, ambulances and other official emergency-use vehicles. For these cars, there is no reason to believe that price would be correlated with registration plate assignment, and even if such a reason existed it would be problematic to assign prices to such vehicles.
-
4. All registration plates not readable from the photographs (a fraction, about 2%).
-
5. All cars with registration plates in the old format, issued before 2001. The current numbering system was introduced in that year, as was random assignment of registration plates.
Table A.1 10% of the most expensive cars from subsamples without “distinct” registration plates


Figure A.1 Aggregate differences in prices by years with 95% confidence intervals Note: Observations are weighted. Robust standard errors are used. Source: Data collected in the field, car prices from http://www.eurotaxglass.com/.


