


Many states on the receiving end of international migration flows have implemented some form of policy instrument to select immigrants. Canada, for instance, has used a point system that gives priority to immigrants meeting specific criteria with respect to age, education level or occupation. The resulting conventional wisdom is that Canadian policies are slanted in favour of skilled immigration. After all, educated immigrants should pay off politically compared to low-skilled immigrants. Education is commonly viewed as a form of capital embodied in humans, arguably making skilled immigrants a desirable type of labour (see Borjas Reference Borjas1995; Barro and Sala-i-Martin Reference Barro and Sala-i-Martin2004, Chapter 9), whereas recent studies have shown that voters hold more favourable views about immigrants of higher status (Hainmueller and Hiscox Reference Hainmueller and Hiscox2010; O’Connell Reference O’Connell2011; Harell et al. Reference Harell, Soroka, Iyengar and Valentino2012). Nevertheless, I argue in this paper that governments are caught in a cross-fire between the conflicting preferences of their national industries, a surprisingly large number of which still depend on a low-skilled workforce. Focusing on the Canadian case, I demonstrate that immigrant selection depends closely on the existing regional industry mix, with the implication that policies are committed to the status quo.
Despite the growth in high-technology sectors employing large numbers of skilled workers, a significant part of production in developed countries still comes from traditional, low-technology industries. Indicators used in this paper suggest that high-tech industries represent roughly 20% of the Canadian private sector’s output at the most. The rest of the economy comprises a large number of businesses that rely upon more traditional inputs. To begin with, the primary sector still accounts for around 19% of gross domestic output in a country disposing of abundant natural resources like Canada (Canada 2013a). This sector depends heavily on tradespeople and traditional labourers: about 90% of workers in the primary sector did not have a college degree in 2010.Footnote 1 Likewise, several industries in manufacturing and services (for instance, retail trade) comprise large and influential employers that do not depend massively on college graduates in order to do business. These “low-technology industries” are already facing an adverse transformation of the labour force, given that the supply of skilled workers (with tertiary education) has increased up to nine times faster than the supply of workers without higher education since the 1970s in economically advanced countries (Barro and Lee Reference Barro and Lee2010).Footnote 2 In other words, college graduates account for an increasingly larger proportion of new cohorts of workers, and they represent an overqualified and overpriced source of labour for traditional industries.
The central argument of this paper is that elected governments are risk averse when managing the skill composition of immigration and seek a compromise between the preferences of businesses. As a result, immigrant selection is responsive to the existing industry mix and still reflects the relative importance of low-technology industries despite the unpopularity of low-skilled immigrants. I also illustrate how immigration reduces the disparity between the rates of growth of skilled and low-skilled labour owing to its impact on population growth, even when generous proportions of college-educated immigrants are selected. The findings and their implications suggest that governments are using immigration as a buffer against radical changes to the labour force; current policies help to preserve the status quo in the industry mix while limiting the risk of discontent among corporate actors. Otherwise, restricting low-skilled immigration would exacerbate the relative growth of skilled labour and benefit high-technology sectors disproportionately, at the cost of greater uncertainty for traditional industries.
This study has few counterparts in the existing literature. Despite the scholarly attention devoted to the influence of corporate interest groups on immigration policies, rarely had quantitative studies brought forth supportive evidence linking policy outcomes to concerns for national industries. Moreover, the few examples of quantitative research along those lines have focused mostly on openness to immigration (Facchini et al. Reference Facchini, Mayda and Mishra2011; Nicholson-Crotty and Nicholson-Crotty Reference Nicholson-Crotty and Nicholson-Crotty2011), rather than on decisions regarding the skill composition of immigration per se. A separate stream of work has examined the impact of immigration on the national industry mix (Hanson and Slaughter Reference Hanson and Slaughter1999, Reference Hanson and Slaughter2002; Gandal et al. Reference Gandal, Hanson and Slaughter2004), building upon earlier empirical accounts supporting the view that the output mix adjusts to changes in factor endowments (Harrigan Reference Harrigan1995, Reference Harrigan1997; Bernstein and Weinstein Reference Bernstein and Weinstein2002). However, those studies have been devoted to the economic impact of immigration, leaving aside the political dimension of the problem. The present research contributes to this literature by examining the policy-making aspects of the relationship between industries and the skills-based selection of immigrants.
An obvious difficulty with the research design of this paper is the simultaneity of the relationship between policy outcomes and the mix of industries. Indeed, if expectations regarding the impact of immigration on the output mix are a motivation behind the selection of immigrants, the relationship can be viewed as a system. Testing the argument requires an estimator able to deal with simultaneous equations. I address this problem using data on Canadian provinces and a research design based on the two-stage least squares (2SLS) approach. The main results are also replicated by considering models for dynamic panel data accounting for both endogeneity and unobserved provincial effects using the generalised method of moments (GMM).
For a number of reasons, the Canadian case represents a fertile ground for research on immigration. To begin with, the country has often been referenced since implementing a point system that facilitates the skills-based selection of immigrants in 1967 (Borjas Reference Borjas2001; Chiswick Reference Chiswick2011), a policy instrument that has inspired similar measures in countries such as Australia, New Zealand and the United Kingdom (Hatton and Williamson Reference Hatton and Williamson2005; Somerville Reference Somerville2007). Therefore, the results of this study should offer useful insights to scholars and practitioners from other nations in which skills-based selection mechanisms are also in place. Moreover, Canada ranks high among the countries with the largest inflows of permanent residents relative to population size across the Organization for Economic Co-Operation and Development (OECD 2012, 30–32), and it has a long history as a recipient state of mass migration. As such, the Canadian setting represents a natural laboratory for the study of immigration, and the findings of this paper may help to inform other countries that have more recently adopted expansive immigration policies. Finally, Canada enjoys an immense geographical diversity, and provinces tend to differ markedly in terms of their industry mix. This provides a substantial amount of variation, which facilitates the use of statistical methods to test the central argument.
The rest of this paper proceeds as follows. The next section develops the theoretical argument in general terms. I then introduce substantive notions about Canadian policies in the section after that, before presenting the research design and the empirical data. The penultimate section discusses empirical findings and emphasises key policy implications. The final section concludes.
Theoretical model
Consider an economy composed of two industries. The first is a low-technology industry producing a traditional good labelled X, for instance, clothing. The second is a high-technology industry producing a sophisticated good labelled Z, say, computers.
Each industry relies upon different intensities of two factors of production, namely low-skilled labour (L) and skilled labour (H). Throughout this study, skilled labour refers to workers with a college education, whereas low-skilled labour refers to workers who lack it. It is natural to assume that the low-technology industry uses low-skilled labour most intensively, and skilled labour least intensively, relative to the high-technology industry. Formally, this means that the inequality
 $${{L_{X} } \over {H_{X} }}\gt {{L_{Z} } \over {H_{Z} }}$$
holds, where the subscripts refer to the quantity of each factor used in the X and Z industries.
$${{L_{X} } \over {H_{X} }}\gt {{L_{Z} } \over {H_{Z} }}$$
holds, where the subscripts refer to the quantity of each factor used in the X and Z industries.
Using traditional tools of economic theory, the arrangement of the aggregate economy can be represented by imposing factor market clearing conditions:
 $$a_{{L,X}} X{\plus}a_{{L,Z}} Z=L_{X} {\plus}L_{Z} =L$$
 $$a_{{H,X}} X{\plus}a_{{H,Z}} Z=H_{X} {\plus}H_{Z} =H$$
where the input coefficients
 $$a_{{i,j}} \,(i=\{ L,H\} ,j=\{ X,Z\} )$$
measure the fraction of output attributable to each factor. The well-known Rybczynski theorem provides a straightforward expectation regarding the impact of a change in the supply of either L or H, such as the one that would result from the addition of immigrant workers to the labour force (Rybczynski Reference Rybczynski1955). Given that
$$a_{{i,j}} \,(i=\{ L,H\} ,j=\{ X,Z\} )$$
measure the fraction of output attributable to each factor. The well-known Rybczynski theorem provides a straightforward expectation regarding the impact of a change in the supply of either L or H, such as the one that would result from the addition of immigrant workers to the labour force (Rybczynski Reference Rybczynski1955). Given that
 $${{a_{{L,X}} } \over {a_{{H,X}} }}\gt {{a_{{L,Z}} } \over {a_{{H,Z}} }}$$
stands as an inequality (which follows from the assumptions about the intensity of factors in each sector), a change in the supply of L through immigration would lead to an expansion of the industry X, which uses that factor most intensively, and to a contraction of the industry Z. The converse holds following a change in the supply of H.Footnote
3
$${{a_{{L,X}} } \over {a_{{H,X}} }}\gt {{a_{{L,Z}} } \over {a_{{H,Z}} }}$$
stands as an inequality (which follows from the assumptions about the intensity of factors in each sector), a change in the supply of L through immigration would lead to an expansion of the industry X, which uses that factor most intensively, and to a contraction of the industry Z. The converse holds following a change in the supply of H.Footnote
3
I contend that industries develop preferences over the selection of immigrants that are consistent with the expected impact on the output mix. Even though firms within those industries should theoretically become indifferent to the size of their activities under perfect competition, it appears realistic to relax such a strong assumption. The shrinking in size of an industry would imply, in practice, the closure of individual firms, the loss of unmovable assets and equity losses for investors. Thus, it is natural to think that firms prefer the type of immigration that would be most advantageous to their industry in order to avoid jeopardising their activities.
The change in industry output following the increase in each of the two factors of production can be obtained by differentiating (1) and solving for the partial derivatives
 $${{\partial X} \over {\partial L}}\,{\rm and}\,{{\partial Z} \over {\partial L}}$$
. Those partial derivatives are the familiar solutions to the Rybczynski theorem:
$${{\partial X} \over {\partial L}}\,{\rm and}\,{{\partial Z} \over {\partial L}}$$
. Those partial derivatives are the familiar solutions to the Rybczynski theorem:
 $${{\partial X} \over {\partial L}}={\minus}{{a_{{H,Z}} } \over {(a_{{H,X}} a_{{L,Z}} {\minus}a_{{L,X}} a_{{H,Z}} )}}\gt \,0$$
 $${{\partial Z} \over {\partial L}}={{a_{{H,X}} } \over {(a_{{H,X}} a_{{L,Z}} {\minus}a_{{L,X}} a_{{H,Z}} )}}\lt \,0$$
 $${{\partial X} \over {\partial H}}={{a_{{L,Z}} } \over {(a_{{H,X}} a_{{L,Z}} {\minus}a_{{L,X}} a_{{H,Z}} )}}\lt \,0$$
 $${{\partial Z} \over {\partial H}}={\minus}{{a_{{L,X}} } \over {(a_{{H,X}} a_{{L,Z}} {\minus}a_{{L,X}} a_{{H,Z}} )}}\gt \,0$$
Because of the intensity rankings associated with each industry, the signs of the comparative statics are straightforward. Clearly, firms of industry X would prefer to avoid the addition of foreign labour from the skilled category, which disadvantages the industry as a whole to the benefit of industry Z. Likewise, industry Z would rather avoid low-skilled immigration, which implies a reduction of its size.
Next, let me introduce a government in charge of the selection of immigrants. To maintain the focus of this study on the role of factor intensities, I consider a situation where the absolute levels of immigration are given exogenously. The government must choose the proportion of low-skilled migrants, denoted
 $$y\in [0,1]$$
(such that the proportion of skilled migrants becomes (1−y)).
$$y\in [0,1]$$
(such that the proportion of skilled migrants becomes (1−y)).
Suppose that, when making its decision, the government seeks to minimise the welfare loss of both industries. The rationale behind this modelling choice is relevant if one agrees with the idea that, in politics, governments prefer to avoid attracting negative attention to themselves, such as the negative news that would follow the closure of firms from specific sectors of local economies. Even if industry X or Z were theoretically preferable, for instance, because of an international comparative advantage, the transformation of the economy would come at a political cost. The loss of jobs and unmovable assets accompanying the depletion of a sector would direct negative attention and grievances towards the elected government, which itself would risk losing the support of important social actors.
Although the inner mechanism driving the government’s behaviour cannot be readily observed, it appears realistic to assume that elected officials prefer to avoid adverse consequences for local industries. First, an influential body of literature in psychology and behavioural economics suggests that humans pay more attention to negative information (Rozin and Royzman Reference Rozin and Royzman2001) and tend to be averse to loss (Tversky and Kahneman Reference Tversky and Kahneman1991). Public opinion has also been shown to respond disproportionately to negative economic news (Soroka Reference Soroka2006). Second, practice shows that governments are reluctant to let industries significantly associated with regions disappear. For instance, both the Canadian and American governments provided financial assistance for their automotive industries during the recent economic crisis, which represent large employers with a symbolic attachment to regional economies. The Canadian federal government specifically developed a programme in 2008 to support traditional industries affected by the crisis, focusing on sectors such as forestry and agriculture (Canada 2008, 16). In fact, the use of public funds to support specific industries extends beyond economic hard times. The recent proceedings of an OECD’s Global Forum on Competition estimated that public aid to industries represented 1% of the European Union’s gross domestic product in 2008 (OECD 2011, 18), excluding crisis-related stimulus packages. Although subsidies may serve strategic goals other than preventing the depletion of specific sectors of the economy, it is probably fair to say that governments care a great deal about the fate of national industries when making policy decisions. Accordingly, I expect that, when managing immigration policies, governments prefer to keep stability in the industry mix over inducing changes that would be detrimental to a sector.
To represent this problem, the objective function of the incumbent government can be expressed as a weighted sum of the quadratic distance from the ideal points of each industry:
 $$\mathop {\max }\limits_y U={\minus}(1{\minus}\,y)^{2} X{\minus}\,y^{2} Z$$
Put another way, this utility function means that the government seeks to minimise the loss that industry X would incur from high proportions of skilled migrants and the loss that industry Z would incur from high proportions of low-skilled migrants. The solution to this problem, denoted y*, is proportional to the share of the X industry in the whole economy:
 $$y^{{\asterisk}} ={X \over {X{\plus}Z}}$$
The comparative static of interest suggests that the share of low-skilled immigrants increases the intensity of the low-technology industry. An alternative hypothesis would be that governments choose immigrants in order to stimulate activities that are underdeveloped in the polity. In this case, the relationship in (8) would be negative rather than positive. Otherwise, a unilateral bias in favour of skilled immigration (i.e. a case where skilled applicants are more likely to be selected no matter what) would imply that selection is unrelated to the industry mix.
Illustrating the theoretical process
Before proceeding with a more systematic evaluation of the argument, it should prove useful to illustrate the relevance of the proposed theoretical process with a concrete example. I focus on what has probably been the most salient immigration-related issue in the Canadian media over the past few years, namely the Alberta “oil patch” and the associated shortages of tradespeople. This example traces out the key parts of the argument, from the preference of more traditional sectors for low-skilled immigration to the concerns of elected officials for regional industries and the political response.Footnote 4
Alberta ranks among the wealthiest provinces in Canada, with an economy centred around a lucrative oil extraction industry. Indeed, crude oil accounts for more than half the province’s exports, and the energy sector alone represents over one-fourth of Alberta’s gross domestic product (Alberta 2012, 9–11). During the past decade, the oil industry has spurred a high demand for tradespeople – defined as workers with specific skills that do not require a college education, such as carpenters, ironworkers, electricians, plumbers and so forth (Alberta 2007). Business spokespersons have repeatedly emphasised labour shortages in those occupations, and the issue has gained widespread attention in the media (see, e.g. Beauchesne Reference Beauchesne2006; Francis Reference Francis2006; Teel Reference Teel2007).
At the provincial level, the political response was blatant. The Albertan government has made intensive use of the Provincial Nominee Program (PNP) – a programme allowing provinces to pre-select their immigrants according to regional concerns – and created sub-programmes such as the Strategic Recruitment Stream, which facilitates immigration to the province for applicants of targeted skill levels (see e.g. Alberta 2011, 13). One main category of applicants eligible for this stream comprises compulsory and optional trades, addressing one of the most common requests from the oil industry. Targets for the province’s nominee programme are based in part on labour shortages reported in documents like the Occupational Demand and Supply Outlook (Alberta 2007) that estimate the gaps between supply and demand for various occupations (Alberta 2010, 18). The targeted occupations include not only trades, but also a variety of jobs labelled as “semi-skilled” and directed at service industries, such as food and beverage or hotel and lodging (Alberta 2013a). Besides, a recent analytical tool created by the Department of Enterprise and Advanced Education (now in charge of immigration in Alberta), named “Oil Sands Information Labour Market Analysis Projection (OILMAP)”, is specifically designed to identify labour market needs in the oil sands industry (Alberta 2013b, 18). The Department claims that this “will provide insight into the mix of skilled trades needed to support oil sands development” (Alberta 2013b, 18) and help to inform about the impact of immigration. This sort of political response is consistent with the argument presented above: selection mechanisms appear tailored to the needs of existing industries, in particular, the energy sector, which is central to the province’s economy.
The political response also came from the federal government directly. The Federal Minister of Immigration launched a national consultation on immigration in Calgary, Alberta in 2011, which spurred a number of demands from the province’s actors (see Ho Reference Ho2011; Pratt Reference Pratt2011). Again, shortages of tradespeople in the oil industry were part of the discussions. The next year, Ottawa took measures to accelerate the treatment of applications for permanent immigration from tradespeople looking to settle in Canada (Cryderman Reference Cryderman2012; Van Rassel Reference Van Rassel2012). The federal government created the Federal Skilled Trades Program (which took effect in January 2013), which is specifically tailored for qualified tradespeople applying for permanent residence in Canada [Citizenship and Immigration Canada (CIC) 2013a]. Although this programme is not limited to Alberta, it is especially well adapted to assist this province’s key industry, suggesting that regional concerns have an impact on federal decision making as well.Footnote 5
Overall, the case of Alberta corroborates many of the assumptions behind the proposed theoretical mechanism, as both levels of government appeared responsive to the province’s industries. This case alone provides preliminary evidence that Canadian policies are not merely biased towards the selection of highly skilled workers, as conventional wisdom would suggest, but oriented instead towards current industry needs. However, one case does not suffice for valid inference, and it is reasonable to ask whether the relationship is general, not just specific to the energy sector. The latter may represent an exceptional case because of its market structure and the importance of resource royalties for the province’s government. My goal in the following sections is to implement a more systematic test of the relationship between the mix of industries classifiable in the low-technology sector and low-skilled immigration in Canada.
Empirical research design
In order to implement an empirical test of the argument, I make use of data on immigration and industry mix in Canadian provinces between 2001 and 2010. Before presenting the empirical research design, I introduce some background notions on immigration policies in Canada.
Permanent residents admitted to Canada fall into three main categories: refugees, family reunification immigrants and economic immigrants [under Section 12 of the current Immigration and Refugee Protection Act (IRPA)]. Since 1967, a point system was established to select immigrants from the latter category according to criteria deemed desirable, such as age, work experience, educational attainment, the existence of a labour market demand for the immigrant’s profession or the intended place of residence (Labelle Reference Labelle1988; Reitz Reference Reitz2004; Beach et al. Reference Beach, Green and Worswick2011). Thus, the management of economic immigration can be adapted to specific requirements. Moreover, the gap between the number of applicants and the number of admissions, combined with the existence of an important backlog, means that governments dispose of latitude when selecting permanent residents.Footnote 6 In other words, the skill composition of immigration is unlikely to be driven merely by self-selection mechanisms.
Under Section 95 of the Constitution Act of 1867, the management of immigration in Canada is a responsibility shared between the federal and provincial governments (Canada 2013h). However, the federal government keeps the upper hand in cases where the policies of a province would conflict with existing federal laws – with Section 95 stating that provinces can exert authority “as long and as far only as it is not repugnant to any Act of the Parliament of Canada” (Canada 2013h, Section 95). Since the issuance of permanent resident visas is managed by federal agencies, it is probably fair to say that, in practice, immigration has been primarily under the control of the federal government.
Albeit the central role of the federal government, provinces have a say in the political management of immigration, and their influence has increased over time. When setting yearly immigration quotas, the federal government must meet with the provinces (under Section 10.2 of the IRPA), leaving the possibility to reach agreements with respect to the quantity and characteristics of immigrants admitted to each province (CIC 2011b, 2). Moreover, the involvement of provinces in the selection of immigrants has recently become more concrete. First, since the 1960s, the province of Quebec was granted an exceptional status allowing it to pre-select all of the immigrants intending to reside in the province (Labelle Reference Labelle1988; Reitz Reference Reitz2004). Although this agreement was driven primarily by language issues, Quebec also uses its own point system, which implies that the province’s government may select immigrants that fit the specific needs of its local industries. Second, as mentioned above, the other provinces were provided with a similar opportunity under the form of the PNP established in 1998 (CIC 2011b). Under the PNP, provinces are allowed to select their permanent residents from the economic category. An officially stated goal of the PNP is precisely to “increase the economic benefits of immigration to [provinces], based on their economic priorities and labour market conditions […]” (CIC 2011b, 1). Even though the federal government remains the central authority issuing legal visas to foreigners, the selection process has been increasingly shaped by the provinces, making regional concerns a key aspect of the decision-making process.
A simultaneous equations approach
A main feature of the theoretical model discussed in the previous section is the simultaneity of the relationship between industry mix and the policy response. Indeed, my main argument is that policymakers will adjust the selection of immigrants as a function of local industries. However, the motivation behind this decision is the expected impact of immigration flows on national industries. In other words, the causal relationship linking the intensity of low-technology industries to low-skilled immigration results from rational expectations.
Letting
 $$x={X \over {X{\plus}Z}}$$
denote the intensity of the low-technology sector, the relationship of interest can be expressed as a linear equation, including an intercept and a disturbance term:
$$x={X \over {X{\plus}Z}}$$
denote the intensity of the low-technology sector, the relationship of interest can be expressed as a linear equation, including an intercept and a disturbance term:
 $$y=\alpha {\plus}\beta x{\plus}u$$
When attempting to estimate (9) with classical regression techniques, such as ordinary least squares (OLS), a common problem of endogeneity arises. Indeed, any innovation in the residuals u affects the value of low-skilled immigration y, as shown in (9). This shock in y should in turn provoke a change in the value of x, owing to the relationship between factor endowments and output mix expected by the Rybczynski theorem (see previous section). In that case, the residuals u are correlated with the right-hand side variable x, violating a basic assumption of OLS regression.
To overcome this problem, I make use of an instrumental variable/2SLS approach to estimate the equation introduced in (9) and the parameter of interest β. The objective is to find valid instruments for x. The ideal instruments should have two properties: (1) they need to be good predictors of x and (2) they must explain a part of the variation in x that is not responsive to changes in y (see Angrist and Pischke Reference Angrist and Pischke2008; Kennedy Reference Kennedy2008). Put another way, the instruments must be variables that affect y only through their indirect effect on x. Here, I seek to avoid relying upon factors of production such as labour measures, which are themselves problematic variables.
I consider two variables that meet the requirements to serve as instruments: provincial gross expenditures in research and development (GERD) from non-business sectors and the provincial land area. Non-business GERD should reasonably affect the intensity of low-technology industries in a given province. Moreover, as those expenditures come from a variety of sources (different levels of government, non-profit research organisations and universities), they are unlikely to be a direct determinant of the selection of immigrants. As for the land area of provinces, it represents a strictly exogenous variable whose values have been determined in part by nature and in part by political decisions made decades ago. Moreover, land represents a traditional factor of production, which should realistically have had an influence on the specialisation of production over time. In the rest of this paper, I refer to those two instruments as GERD and Land Area, respectively.
The model introduced in (9) can be respecified by distinguishing between structural and first-stage equations, the latter including the above-mentioned instruments as predictors:
 $$y=\alpha {\plus}\beta _{1} \hat{x}{\plus}u$$
 $$\hat{x}=\pi _{{10}} {\plus}\pi _{{11}} GERD{\plus}\pi _{{12}} Land\,Area$$
This model is now (over-)identified and can be estimated empirically using 2SLS. The predicted values of
 $\hat{x}$
obtained from (11) are uncorrelated with the error terms of (10), provided that the instruments have all the required properties. This means that, with valid instruments, 2SLS estimates are robust not only to simultaneity (reverse causation), but also to endogeneity problems more generally, for instance, omitted variable biases (see Kennedy Reference Kennedy2008, Chapter 9). Moreover, notice that the system is over-identified: there are more instruments than required to estimate the structural equations. This is a desirable property, allowing the use of over-identification restriction tests in order to assess the validity of instruments.
$\hat{x}$
obtained from (11) are uncorrelated with the error terms of (10), provided that the instruments have all the required properties. This means that, with valid instruments, 2SLS estimates are robust not only to simultaneity (reverse causation), but also to endogeneity problems more generally, for instance, omitted variable biases (see Kennedy Reference Kennedy2008, Chapter 9). Moreover, notice that the system is over-identified: there are more instruments than required to estimate the structural equations. This is a desirable property, allowing the use of over-identification restriction tests in order to assess the validity of instruments.
In the empirical analysis that follows, I first estimate this model using a pooled 2SLS estimator. Semykina and Wooldridge (Reference Semykina and Wooldridge2008, 8–10) show that this estimator is consistent for panel data when a minimal number of assumptions are met, such as the absence of correlation between instruments and the residuals. Notice that, as one of the variables does not vary over time (Land Area), implementing a fixed effects 2SLS estimator becomes impossible. However, I show that the key results hold when using a generalised two-stage least squares (G2SLS) estimator (or random effects 2SLS) and a dynamic panel data estimator based on the GMM.
The data
The endogenous variable of interest is the share of low-skilled permanent immigrants, labelled y earlier. I define low-skilled immigrants as permanent residents without a university education. This includes immigrants with a high school degree or less, a trade certificate or a non-university diploma.Footnote 7 I make use of the Digital Library provided by CIC to retrieve the total entries of permanent residents aged 15 years and over, broken down by educational attainment and by province (CIC 2011a). The variable called Low-Skilled Immigration in the following analysis represents the share of permanent residents aged 15 and over, classified as low skilled. I consider permanent residents in general (rather than economic migrants specifically), as the breakdown of immigrants by category and level of education is not made available for all provinces by CIC. However, I include control variables measuring the share of immigrants admitted to each province in the Family and Refugees categories (the data come once again from the CIC Digital Library). In other words, the resulting specification filters away the variation in y caused by changes in the family and refugee classes, leaving only the variation within classes. As mentioned before, the data cover the period ranging from 2001 to 2010, which amounts to 100 observations, excluding territories. The mean of the Low-Skilled Immigration variable across the ten provinces during the whole time period equals 59%. Put the other way around, around 40% of all new entries of permanent residents aged 15 and over are individuals who declare disposing of college education.
The second variable of interest is the intensity of industries comprised in the low-technology sector, labelled x in the previous section. This concept is meant to measure the importance of traditional industries in each provincial economy. To transform the theoretical concept into an indicator, I first consider the breakdown of industries based on the North-American Industry Classification System (NAICS). I retain 32 industries for which all the required data are available. The list of those industries is reported in Table 1. Excluded from this list are the sectors of health care, education, public administration and miscellaneous services. Health care and education are largely (if not mostly) publicly managed in Canada. Like public administration, those sectors do not fit into the conceptual definition introduced in the theoretical section. As for the category comprising miscellaneous service industries (a residual category for all service industries not listed in Table 1), there were no consistent data available to include it in the creation of the variable. Otherwise, the list is exhaustive and comprises all industries of the Canadian economy.
Table 1 Classification of industries by level of technology
Notes: The table lists the principal industries of the Canadian economy, along with the corresponding North-American Industry Classification System (NAICS) codes and the average intramural business expenditures in R&D as a ratio of each industry’s output in Canada as a whole, between 2000 and 2010. The last columns present two classifications of industries based on the technology level.
BERD=business expenditures in research and development.
The next step consists of ranking those industries according to their level of technological sophistication. To do this, I rely upon an empirical technique. I use data on business expenditures in research and development (BERD) by industry in Canada as a whole made available by Statistics Canada (Canada 2013e). I then compute the ratio of BERD to industry gross domestic product, averaged across the sample time period.Footnote 8 This gives a detailed measure of the level of technology in each of the 32 industries, the values of which are reported in the second column of Table 1.
I consider two different criteria to classify industries composing the low-technology sector. Those criteria are based on the percentiles of the BERD variable. The third column of Table 1 shows a first classification of the 32 industries depending on whether they are located above or below the 50th percentile (i.e. the median). Alternatively, the fourth column shows a trinomial classification based on the
 $$33{1 \over 3}$$
th and
$$33{1 \over 3}$$
th and
 $$66{2 \over 3}$$
th percentiles. In the latter, each industry is classified as either a low-, mid- or high-technology industry. As can be observed from the table, the classification appears substantively relevant given the nature of each industry. High-technology industries comprise the most sophisticated sub-sectors of manufacturing, for instance, computers, electronics, aeronautics or pharmaceutical industries. The Professional, Scientific and Technical Services industry comprises engineering and scientific consulting firms, and is realistically classified in the high-technology category. On the other hand, the low-technology category comprises, for both classifications, various traditional industries, such as agriculture, food manufacturing, textile manufacturing and trade services.
$$66{2 \over 3}$$
th percentiles. In the latter, each industry is classified as either a low-, mid- or high-technology industry. As can be observed from the table, the classification appears substantively relevant given the nature of each industry. High-technology industries comprise the most sophisticated sub-sectors of manufacturing, for instance, computers, electronics, aeronautics or pharmaceutical industries. The Professional, Scientific and Technical Services industry comprises engineering and scientific consulting firms, and is realistically classified in the high-technology category. On the other hand, the low-technology category comprises, for both classifications, various traditional industries, such as agriculture, food manufacturing, textile manufacturing and trade services.
I chose to focus on R&D indicators because they are more accurate than available labour data. The latter – which could have been used to measure the intensity of skilled and low-skilled labour by industry – are only available from the Canadian Labour Force Survey (LFS). Using this type of data would introduce statistical error when aggregating by industry. However, it is important to note that there is a very strong correlation between estimated proportions of skilled workers by industry and the classification based on business R&D expenditures reported in Table 1. Nearly all industries with estimated shares of college graduates exceeding the national average (Petroleum and Coal Products, Pharmaceutical, Chemicals, Computers, Electronical, Electrical Equipment, Information and Cultural Industries and Professional, Scientific and Technical Services) according to the 2010 LFS are ranked as high-technology in Table 1, with the exception of Utilities, which is not comparable across data sources, and Finance. In addition, R&D activities employ very high proportions of college graduates to begin with, which is consistent with the theoretical idea that high-tech industries make intensive use of skilled workers. In fact, 59% of R&D personnel in the business sector was composed of college-educated researchers between 2006 and 2010 (as opposed to technicians and staff), which is far above the proportion in the population as a whole (Canada 2013f).
Using the R&D-based classifications, I create four variables that measure the intensity of the low-technology sector. The reliance upon four measures is purposely meant to ensure that the empirical results are not merely driven by the choice of a particular classification. The first variable is the share of provincial gross domestic product in low-technology industries, based on the binomial, 50th-percentile classification. Output data at basic prices by industry and by province come from Statistics Canada (Canada 2013g).Footnote 9 The second variable is the share of provincial output in both the low- and mid-technology industries, based on the trinomial classification. Thus, those two measures represent a narrow and a broad definition of the low-technology sector, respectively. Finally, I create two additional variables by computing the previous measures after excluding primary sector and construction industries. The reason behind those additional measures is to make sure that the estimated relationships are not driven only by the specific sectors of energy and natural resources, which play an important role for the economy of some provinces. For the sake of simplicity, I refer to the four variables as Low-Tech Sector below, although the tables will specify which definition is used.
As for the instruments introduced above, they are measured as follows. The GERD variable represents non-business gross expenditures in R&D (GERD) by province as a ratio of total provincial output. The data come once again from Statistics Canada (Canada 2013d). Non-business GERD comprise the total expenditures in R&D from all types of funders, with the exception of the business sector, as the latter is used for the classification of industries. The idea is to capture the variation in the Low-Tech Sector variables that is orthogonal to the residuals of the structural form equations, hence exogenous to low-skilled immigration. Finally, the Land Area of provinces is measured in square metres, using the data provided in Canada (2005).
Table 2 reports descriptive statistics for the main variables of the model, broken down by province. The mean values are expressed as percentages. To simplify this table, I report descriptive statistics only for the first definition of the Low-Tech Sector variable (the one based on the binomial classification and including primary-level industries). As can be seen, there is a fair amount of variation in the means of each of the series across provinces. In particular, Newfoundland and Saskatchewan have the highest average shares of low-technology industries among the ten provinces, whereas Quebec and Ontario appear to rely most heavily on high-technology industries.
Table 2 Descriptive statistics
Notes: The table reports the means of five main variables for the time period 2001–2010 by province, expressed in percentages, along with standard deviations in parentheses. The Low-Tech Sector variable is based on the binomial classification and includes primary-level industries.
GERD=gross expenditures in research and development.
Finally, Figure 1 shows scatterplots of the bivariate relationship between the Low-Skilled Immigration and Low-Tech Sector series, using each of the four alternative definitions of the low-technology sector. As clearly seen from all of the sub-figures, there seems to be a positive relationship between the two series. Although the patterns observed in those scatterplots appear consistent with the main argument of this paper, the main issue is to confirm whether there is a relationship going from industry mix towards immigrant selection.
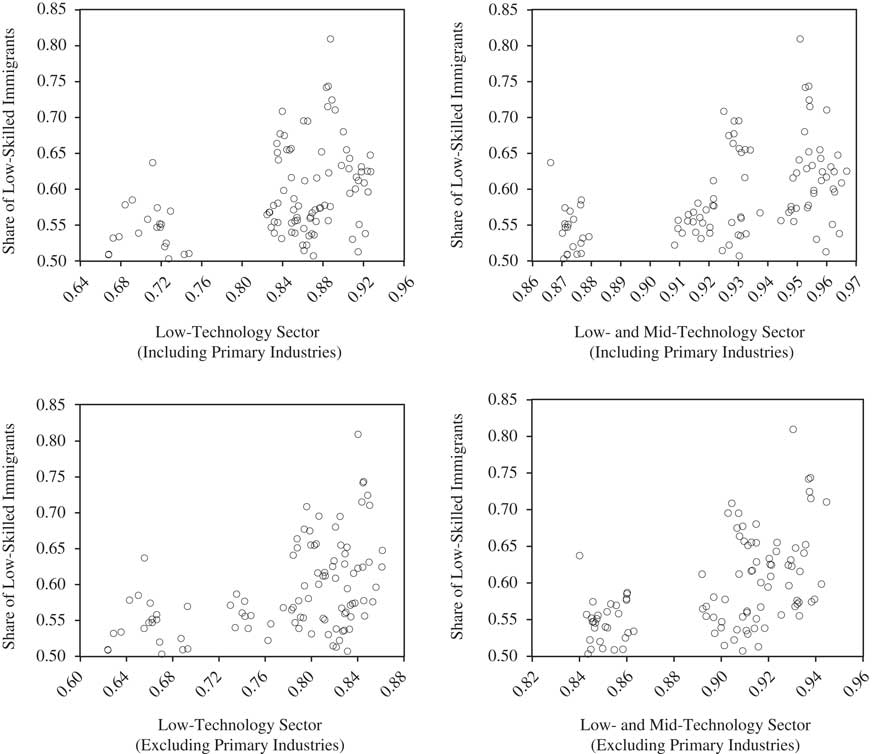
Figure 1 Low-skilled immigration and the intensity of low-technology sectors in Canadian provinces (2001–2010).
Unit root tests
As a preliminary step to empirical analysis, I test each of the main variables for stationarity. Non-stationary variables would require special treatment to ensure consistent empirical estimates (Granger and Newbold Reference Granger and Newbold1974), and consequently unit root testing represents an essential step when using data comprising a time-series component.
I make use of the Levin-Lin-Chu panel unit root test of the null of non-stationarity (Levin et al. Reference Levin, Lin and James Chu2002), performed on each of the five main time-varying series used in this study, including the four possible definitions of the Low-Tech Sector. In each case, I compute the test after including an intercept and a time trend. The Levin-Lin-Chu adjusted–t-statistics are reported in Table 3 for 0, 1 and 2 lags. As the sample time period is limited to ten years, it becomes irrelevant to consider larger lag lengths.
Table 3 Levin-Lin-Chu panel unit root tests
Notes: The table reports adjusted
 $t^{{\asterisk}} $
statistics of Levin-Lin-Chu tests along with significance levels. All tests are computed using the natural logarithms of the variables, along with intercepts and time trends. Significant statistics indicate that the variables are trend stationary.
$t^{{\asterisk}} $
statistics of Levin-Lin-Chu tests along with significance levels. All tests are computed using the natural logarithms of the variables, along with intercepts and time trends. Significant statistics indicate that the variables are trend stationary.
GERD=gross expenditures in research and development.
***p<0.001, *p<0.05.
As can be observed from Table 3, for mostly all cases considered, the null hypothesis of a unit root is rejected at the p<0.001 significance level. The only exception is the Low-Tech Sector series computed with the binomial codification and excluding the primary sector. In this case, the null cannot be rejected with confidence when two lags are included in the underlying augmented Dickey-Fuller regression. However, given the unambiguous verdicts for all other series, I will treat the main variables as trend stationary in the empirical analysis that follows. In short, unit root processes are not a major concern in this study.
Empirical results
Table 4 reports the results from pooled cross-sectional 2SLS estimates using each of the four definitions of the Low-Tech Sector variable. The bottom part of the table presents the reduced form (or first-stage) estimates. The upper part shows the structural (or second-stage) estimates, along with heteroskedasticity and autocorrelation consistent standard errors in parentheses. Notice that all variables are expressed in natural logarithms, so that estimates are comparable in size and can be interpreted as elasticities, i.e. as the percentage response in the dependent variable for a 1% increase in the corresponding right-hand side variable.
Table 4 Low-skilled immigration to Canadian provinces (2001–2010): 2SLS estimates
Notes: The table reports pooled cross-sectional 2SLS estimates, along with Newey-West standard errors computed using a two-lag bandwidth in parentheses. The dependent variable in the structural equations is the log of Low-Skilled Immigration.
The column headers indicate which definition was used to compute the Low-Tech Sector variable. The first column reports results using the binomial classification, whereas the second column is based on a grouping of the low- and mid-technology industries using the trinomial classification (see Table 1). The third and fourth columns replicate the same measures after excluding the primary sector.
2SLS=two-stage least squares; GERD=gross expenditures in research and development.
***p<0.001, **p<0.01, *p<0.05.
A very important statistical tool to evaluate whether the 2SLS approach effectively eliminates the correlation between the problematic right-hand side variables and the residuals is the Sargan-Hansen over-identification restriction test. The null hypothesis of this test is that all instruments are valid. The last rows of the upper panel of Table 4 report the Hansen-J statistics of this test for all models, along with the p-values. Using either one of the four definitions of the low-technology sector, those statistics are well outside the conventional bounds of statistical significance (considering the value of 0.05 as a benchmark), confirming the adequacy of the chosen instruments.
The first column of Table 4 presents the results using the first variant of the Low-Tech Sector measure, based on the binomial classification and including primary-level industries. Focusing on the first-stage estimates, both the excluded instruments, GERD and Land Area, are significantly associated with the share of industries in the low-technology sector, at the p<0.001 level. This is a required property of the model that ensures reliable structural estimates. The estimate for GERD has an intuitive negative sign: the value of −0.18 means that a 1% increase in non-business GERD leads to an estimated 0.18% decrease in the share of industries in the low-technology sector (or equivalently to a 0.18% increase in the share of high-technology industries), all else equal. To further assess the adequacy of the instruments, I report the Angrist-Pischke multivariate F-test at the bottom of the table (Angrist and Pischke Reference Angrist and Pischke2008): a significant statistic rejects the null hypothesis of weak instruments, as is the case in this model.
Turning to the structural estimates in the upper part of Table 4, and still focusing on the first column, the coefficient of interest for the instrumented Low-Tech Sector variable appears significantly associated with the share of low-skilled immigration in the recipient province. The estimated elasticity is about 0.48: an exogenous shock increasing the intensity of low-technology industries by 1% induces an estimated 0.48% increase in the share of low-skilled immigrants. This result is consistent with the theoretical idea that governments adjust the levels of low-skilled immigration according to the provincial industry mix, although a value lower than 1.0 suggests that this adjustment is short of a one-for-one proportional response. Notice that the coefficient of interest can be interpreted the other way around: a 1% exogenous increase in the intensity of high-technology industries induces an estimated 0.48% increase in the share of skilled immigrants.
However, the magnitude of the effect depends on how one defines the low-technology sector. The second column of Table 4 reports estimates based on the broader definition of the low-technology sector (regrouping industries classified in both the low- and mid-technology categories). In this case, the estimated elasticity is closer to 1.0, suggesting that the skill composition of immigration responds proportionally to differences in the intensity of the low-technology sector, on a nearly one-for-one basis. In fact, the estimated coefficient is not statistically different from 1.0. Importantly, the first-stage estimates for the excluded instruments remain statistically significant after changing the definition of the low-technology sector.
The last two columns of Table 4 replicate the same analysis, this time by excluding primary-level industries. Using either the narrow or broad definition of the Low-Tech Sector, the estimates are close in size to the ones found earlier, although slightly smaller. The structural estimates of interest remain within the bounds of the 95% significance level, and the elasticities are 0.43 and 1.12, respectively. Overall, the direction of the key comparative static appears robust to modifications in the definition of the low-technology sector.
Robustness tests
In order to assess the robustness of the main findings presented so far, I now turn my attention to alternative specifications of the models. To begin with, I consider a G2SLS estimation of the first two equations presented earlier in Table 4, as well as specifications including additional control variables. Next, I report results obtained with a dynamic implementation of the original models that uses GMM estimators.
The G2SLS model introduced in Balestra and Varadharajan-Krishnakumar (Reference Balestra and Varadharajan-Krishnakumar1987) allows the residuals of (10) to be decomposed as follows:
 $$u=\mu _{i} {\plus}v_{{i,t}} $$
where the subscripts i and t, respectively, indicate the province and the time period, μ i captures unobserved provincial effects and v i,t represents idiosyncratic errors. The random effects model estimates the variances of μ i and v i,t , which are then used to transform the original data. In what follows, I make use of the Baltagi and Chang (Reference Baltagi and Chang2000) estimator of those variance components.
The first two columns of Table 5 replicate the first two models of Table 4 using the G2SLS approach. As can be seen, the structural coefficients of interest are close to the ones obtained earlier, although slightly larger in size. For instance, the estimated coefficient for the instrumented Low-Tech Sector in column 1 is now 0.59, compared with the value 0.48 obtained using pooled 2SLS. Notice that the Sargan-Hansen tests once again suggest that the instruments are appropriate. In addition, the instruments remain significant predictors of the Low-Tech Sector variables in the first stage.
Table 5 Low-skilled immigration to Canadian provinces (2001–2010): G2SLS estimates
Notes: The table reports the results of G2SLS regressions using Baltagi-Chang consistent estimators of the variance components, along with standard errors in parentheses. To simplify the table, only the first-stage estimates for excluded instruments are reported. The dependent variable in the structural equations is the log of Low-Skilled Immigration.
G2SLS=generalised two-stage least squares; GERD=gross expenditures in research and development.
***p<0.001, **p<0.01, *p<0.05.
To produce the results in the last two columns of Table 5, I include additional control variables in the model. The Oil Production variable is a dummy indicating whether the province is an oil producer. It equals one for the three major oil-producing Canadian provinces (namely Alberta, Saskatchewan and Newfoundland), and zero otherwise. The Unemployment variable measures the rate of unemployment in manufacturing industries by province (Canada 2013c). Finally, I include a measure of labour force trends, labelled Intercohort Skills Gap. This variable corresponds to the proportion of the cohort aged between 25 and 34 years who are college-educated, divided by the equivalent proportion in the cohort at the age of retirement (65 years old and above). The variable is built from the Canadian LFS microdata files for the years 2001 to 2010 and measured at mid-year using the surveys for July (Canada 2001–2010). The Intercohort Skills Gap is a measure of the scarcity of low-skilled labour over time, which accounts for the labour force conditions in each province.
The new specification has potential drawbacks, as the inclusion of additional variables that are potentially not strictly exogenous (e.g. Unemployment or Intercohort Skills Gap) may introduce a statistical bias that I sought to avoid in the first place. As can be seen, the Hansen test does not provide strong support for the validity of instruments for the model in the third column. However, after including those additional control variables, the estimates of interest for the intensity of the low-technology sector are practically identical to those reported in the first two columns. Here, my goal is primarily to confirm that the signs of the structural estimates remain consistent after including control variables that may be substantively relevant.
Finally, I replicate the results of Table 4 after considering a dynamic model, using GMM estimators for panel data. The initial equation in (10) can be readily expressed in dynamic terms:
 $$y_{{i,t}} =\alpha y_{{i,t{\minus}1}} {\plus}\beta _{1} x_{{i,t}} {\plus}\beta _{2} x_{{i,t{\minus}1}} {\plus}\beta _{3} {\mathop{\rm Re}\nolimits} {\rm fugees}_{{i,t}} {\plus}\beta _{4} {\rm Family}_{{i,t}} {\plus}u_{{i,t}} $$
 $$u_{{i,t}} =\mu _{i} {\plus}v_{{i,t}} $$
where the disturbance terms are again decomposed into individual effects and i.i.d. errors. Arellano and Bover (Reference Arellano and Bover1995) and Blundell and Bond (Reference Blundell and Bond1998) proposed a system estimator that makes use of lagged values of the endogenous right-hand side variables to create GMM instruments. Those instruments are then used to impose moment conditions on both the level equation and a first difference transformation of that equation. The GMM estimator was initially intended to deal with the bias resulting from the inclusion of a lagged dependent variable, which is by construction correlated with the individual effects in the disturbances (Arellano and Bond Reference Arellano and Bond1991). However, the GMM approach is flexible enough to deal with other endogenous regressors, in this case x i,t , the Low-Tech Sector variable. The same set of instruments used in the 2SLS models can be incorporated in the model, in addition to GMM-type instruments.
The GMM approach has important benefits, as it can distinguish between short-run and long-run effects, deal with endogenous covariates and account for unobserved individual effects in panel data. For instance, the instantaneous effect of a shock in the Low-Tech Sector variable is captured by β
1 in (13), whereas the long-run effect corresponds to
 $${{\beta _{1} {\plus}\beta _{2} } \over {1{\minus}\alpha }}$$
. The only drawback with this approach is that the number of GMM-type instruments increases rapidly with the time dimension and the problematic regressors. The data set used in this paper, which is reduced to nine time periods with the inclusion of lagged variables, implies the use of 28 GMM-type instruments for each endogenous regressor in the difference equation only, for a total of 56 [again, the two problematic regressors in (13) are y
i,t−1
and x
i,t
]. Adding GMM-type instruments to the level equation would increase the instrument count close to the number of observations, weakening the Sargan over-identification test. To limit the number of instruments, I consider a system GMM estimator in which only standard instruments (i.e. the set of variables used as instruments in the 2SLS approach) are considered in the level equation, whereas both the GMM and the standard instruments are included in the difference equation.
$${{\beta _{1} {\plus}\beta _{2} } \over {1{\minus}\alpha }}$$
. The only drawback with this approach is that the number of GMM-type instruments increases rapidly with the time dimension and the problematic regressors. The data set used in this paper, which is reduced to nine time periods with the inclusion of lagged variables, implies the use of 28 GMM-type instruments for each endogenous regressor in the difference equation only, for a total of 56 [again, the two problematic regressors in (13) are y
i,t−1
and x
i,t
]. Adding GMM-type instruments to the level equation would increase the instrument count close to the number of observations, weakening the Sargan over-identification test. To limit the number of instruments, I consider a system GMM estimator in which only standard instruments (i.e. the set of variables used as instruments in the 2SLS approach) are considered in the level equation, whereas both the GMM and the standard instruments are included in the difference equation.
Table 6 shows the results obtained using this GMM estimator, replicating each of the four columns of Table 4. Focusing on the first column, the short-run elasticity of Low-Skilled Immigration with respect to the Low-Tech Sector variable corresponds to 0.99. The estimate is statistically significant at the p<0.01 level, using standard errors robust to arbitrary heteroskedasticity and autocorrelation. This means that a 1% shock in the Low-Tech Sector variable induces a 0.99% increase in the share of low-skilled immigration during the first year.
Table 6 Low-skilled immigration to Canadian provinces (2001–2010): GMM estimates
Notes: The table reports GMM estimates for dynamic panel data, along with standard errors robust to heteroskedasticity and autocorrelation in parentheses. The dependent variable is the log of Low-Skilled Immigration. The p-values for the Arellano-Bond tests of the null of no second-order autocorrelation [AR(2)] are reported at the bottom of the table.
Instruments in the first differences equation include the lags of Low-Skilled Immigration and Low-Tech Sector in levels, starting at t−2 backwards (GMM-type instruments), as well as the variables GERD, Refugees and Family in first differences (standard instruments).
Instruments in the levels equation include GERD, Land Area, Refugees, Family and the Time Trend (standard instruments).
GMM=generalised method of moments; GERD=gross expenditures in research and development.
***p<0.001, **p<0.01, *p<0.05.
The estimated effect in the second period corresponds to −0.27 (computed as αβ
1+β
2 or 0.40(0.99)−0.67), although statistically indistinguishable from zero. This value comprises the instantaneous effect carried over in the next period by the Low-Skilled Immigration variable itself (0.40×0.99), plus the direct short-run impact in the second period (–0.67). As for the long-run elasticity, it corresponds to
 $${{0.99{\minus}0.67} \over {1{\minus}0.40}}=0.53$$
, which is very close to the estimate obtained using the G2SLS model (0.59) and close to the one initially found using the pooled 2SLS model (0.48). Put simply, the dynamic estimates suggest that the response of policies to a change in the intensity of the low-technology sector occurs mostly in the short-run (during the ensuing year), whereas the long-run effect is the same as that found using static estimators.
$${{0.99{\minus}0.67} \over {1{\minus}0.40}}=0.53$$
, which is very close to the estimate obtained using the G2SLS model (0.59) and close to the one initially found using the pooled 2SLS model (0.48). Put simply, the dynamic estimates suggest that the response of policies to a change in the intensity of the low-technology sector occurs mostly in the short-run (during the ensuing year), whereas the long-run effect is the same as that found using static estimators.
The story is similar when considering the broader definition of the Low-Tech Sector variable in the second column of Table 6. Most of the impact of a change in the intensity of low-technology industries appears to occur in the short-run, and the estimated long-run elasticity
 $$\left( {{{1.95{\minus}0.84} \over {1{\minus}0.31}}=1.6} \right)$$
is close in size to the values found using the G2SLS specification. The results based on the definitions excluding the primary sector are once again consistent with those obtained with the previous estimators, as can be observed in the third and fourth columns. The non-significant values of the Sargan tests suggest that the instruments are valid (although, recall that those tests are weakened by the large number of instruments–65–relative to the number of observations). The full list of instruments in the difference and level equations is reported in the footnote of Table 6.
$$\left( {{{1.95{\minus}0.84} \over {1{\minus}0.31}}=1.6} \right)$$
is close in size to the values found using the G2SLS specification. The results based on the definitions excluding the primary sector are once again consistent with those obtained with the previous estimators, as can be observed in the third and fourth columns. The non-significant values of the Sargan tests suggest that the instruments are valid (although, recall that those tests are weakened by the large number of instruments–65–relative to the number of observations). The full list of instruments in the difference and level equations is reported in the footnote of Table 6.
In short, the additional tests presented in this subsection tend to reinforce the main conclusions previously drawn regarding the relationship between industry mix and low-skilled immigration in Canada. A higher intensity of traditional industries in a province provokes the selection of higher proportions of low-skilled immigrants, and this result appears robust to endogeneity and alternative specifications.
Policy implications
The argument and the findings discussed in the previous sections lead to important policy implications. First, as long as traditional industries remain influential actors at the national level, governments are likely to face strong incentives to admit low-skilled immigrants, thus counteracting the ongoing trends in the labour force as a whole. In fact, I show below that immigration, by inflating population growth, tends to reduce the discrepancy between the rates of growth of skilled and low-skilled labour – in spite of relatively large proportions of skilled immigrants being admitted to a country like Canada. Second, the findings also suggest that policies, by targeting the labour needs of existing local industries, will likely reinforce patterns of regional specialisation. Unless some other adjustment mechanism comes into play, this means that policies may sustain existing technological gaps between regions. Those implications raise interesting questions about the economic impact of immigration that could be examined in future research.
As mentioned at the outset, most developed countries are facing a rapid transformation of their labour force. This transformation is caused by the important gap between educational attainment in retiring cohorts and workers entering the workforce.Footnote 10 As a result, annual population change is lopsidedly composed of college-educated workers. Indeed, the annual change in the working-age population was composed of 58% workers with a college education and 42% workers without a college education in Canada, averaged over the period 2001–2010 and based on weighted annual estimates from LFS data (Canada 2013b). As long as the share of skilled immigrants admitted to Canada is lower than 58%, increasing the levels of immigration actually reduces the percentage of population change composed of skilled workers. I discuss this mechanism in the Appendix. Put another way, without immigration, the younger cohorts would barely suffice to replace the retirement of large numbers of low-skilled workers, a situation mitigated when the total number of new workers is increased.
The incentives behind low-skilled immigration can be explained by the current intensity of the high-technology sector, which is still relatively small in Canada. Depending on which of the four definitions proposed in this paper is used, high-technology industries represented between 7 and 20% of the private sector’s production in Canada during the period 2001–2010.Footnote 11 This means that the bulk of national production is still performed in lowly or moderately sophisticated industries. When governments adjust the skill composition of immigration to the existing industry mix, incentives for low-skilled immigration remain significant. As implied by the Rybczynski theorem and given the current labour force trends, a restrictive immigration policy with limited inflows of low-skilled immigrants would exacerbate incentives to invest in activities making intensive use of skilled labour, boosting the size of high-tech sectors.
Whether those implications represent a problematic situation is of course a normative question. On one hand, the behaviour of governments may be interpreted as a fair response to the conflicting preferences of industries, taking into account the needs of traditional sectors already struggling with the waning intensity of low-skilled labour. On the other hand, current policy decisions may lead to undesirable outcomes in terms of economic development, by tempering down the growth of industries playing a significant role in the process of technological change. An interesting avenue of future research would consist of assessing the consequences of this policy trade-off for economic outcomes. In particular, governments from countries where low-technology industries are even more prevalent than in Canada could face even stronger incentives to admit low-skilled workers in order to sustain their existing industrial mix.
Conclusion
This study has set out to examine whether governments manage the skill composition of immigration as a function of the existing regional industry mix. I argued that, when selecting immigrants, governments compromise between the preferences of industries to avoid hurting sectors associated with the economy of regions. Thus, a stronger presence of traditional, low-technology industries leads a government to increase the proportion of low-skilled immigrants. This argument was tested using panel data on Canadian provinces. To account for the simultaneity of the relationship between the composition of immigration and the industry mix, I made use of 2SLS estimators in which endogenous regressors are instrumented.
The empirical findings are generally consistent with the theoretical claims. Canadian provinces with larger shares of low-technology industries are more likely to receive larger proportions of low-skilled immigrants. This relationship is robust to endogeneity and to changes in the definition of the low-technology sector. The key results were replicated using GMM estimators, taking into account unobserved provincial effects and the dynamics between the variables. Those results lead to an overlooked and counter-intuitive implication, namely that immigration can be viewed as a policy tool preventing the depletion of traditional industries, despite the presence of mechanisms aimed at the selection of skilled migrants. Indeed, the skill composition of immigration appears to adjust to the needs of existing industries, in contrast to the change induced by natural increases in the labour force as a whole, which overwhelmingly benefits sectors relying upon skilled labour.
Compared with the topic of immigration levels, policies on the skills-based selection of migrants remain largely understudied. Yet, the mix of skills that newcomers introduce into the labour market may have important consequences on their own prospects of integration and on the development of economic activities that are conducive to technological change. I have proposed an explanatory mechanism of policy making that is consistent with empirical evidence, but the question certainly deserves additional scrutiny. Complementary methods like elite interviews or alternative research designs suitable for cross-national and industry-level comparisons could be useful to further examine the links between industry preferences and policy outcomes. Future work would also benefit from taking into consideration related policy decisions affecting the skill composition of labour, such as the management of undocumented immigration, a topic that I had to leave aside owing to feasibility constraints.Footnote 12 There may be political incentives to tolerate undocumented migrants in order to provide a more steady flow of workers for traditional jobs, such as those less appealing to native residents. The issue has been at the forefront of debates in the United States and the phenomenon is sizeable, with an estimated 11.5 million unauthorised immigrants living there in 2011 (Hoefer et al. Reference Hoefer, Rytina and Baker2012, 1). Overall, because of the transformation that developed countries are experiencing – a decrease in the intensity of low-skilled labour, understanding how governments deal with immigrant selection will likely remain an important question in the field of public policy.
Acknowledgements
The author thanks the anonymous reviewers for their helpful comments and the Fonds de recherche du Québec – Société et culture (FRQSC) for research support.
Appendix
To illustrate the mechanical impact of immigration levels on the skill composition of annual population change, suppose that N represents the size of the new cohort of workers and R the size of the retiring cohort. Each cohort contains a proportion of college-educated workers, labelled n and r, respectively. It is natural to assume that n>r (new cohorts have higher levels of educational attainment) and that N>R (population growth is positive). The ratio of college-educated among the net number of workers added to the labour force corresponds to
 $${{nN{\minus}rR} \over {N{\minus}R}}$$
This ratio is larger than n itself, by the amount of
 $${{R(n{\minus}r)} \over {N{\minus}R}}$$
. Given the assumptions mentioned above, the skill composition of the new workers will be more heavily skewed towards college-educated individuals as population growth decreases. This is apparent when taking the derivative of the function
$${{R(n{\minus}r)} \over {N{\minus}R}}$$
. Given the assumptions mentioned above, the skill composition of the new workers will be more heavily skewed towards college-educated individuals as population growth decreases. This is apparent when taking the derivative of the function
 $${{nN{\minus}rR} \over {N{\minus}R}}$$
with respect to N, yielding:
$${{nN{\minus}rR} \over {N{\minus}R}}$$
with respect to N, yielding:
 $${{{\minus}R(n{\minus}r)} \over {(N{\minus}R)^{2} }}$$
It follows that, by increasing the size of population growth, immigration will reduce the disparity between the rates of growth of skilled and low-skilled workers. The extent to which immigration affects ongoing trends also depends on the skill composition of immigrants. This can be seen from (14) above, which is a function increasing in n, the share of college graduates among the workers entering the labour force.


