1. Introduction
Understanding and controlling rotation in plasmas has a tremendous importance for an extended variety of plasma regimes. In the context of astrophysical plasmas, rotation and shear are essential ingredients in the context of the dynamo instability (Rincon Reference Rincon2019) and the magneto-rotational instability (Lesur Reference Lesur2021); the control of the rotation profile is thus a key ingredient in experiments dedicated to the study of basic astrophysical processes (Forest et al. Reference Forest, Flanagan, Brookhart, Clark, Cooper, Désangles, Egedal, Endrizzi, Khalzov and Li2015; Plihon et al. Reference Plihon, Bousselin, Palermo, Morales, Bos, Godeferd, Bourgoin, Pinton, Moulin and Aanesland2015; Terasaka et al. Reference Terasaka, Tanaka, Yoshimura, Aramaki, Sakamoto, Kawazu, Furuta, Takatsuka, Masuda and Nakano2015; Flanagan et al. Reference Flanagan, Milhone, Egedal, Endrizzi, Olson, Peterson, Sassella and Forest2020). In the context of technological plasmas, it has been known for a long time that sheared poloidal rotation leads to turbulence reduction in fusion devices (Biglari, Diamond & Terry Reference Biglari, Diamond and Terry1990; Burrell Reference Burrell1997). At smaller scales, the effect of ${\boldsymbol{E}}\times {\boldsymbol{B}}$ rotation -- where
  ${\boldsymbol{B}}$ is the magnetic field and
  ${\boldsymbol{E}}$ is the electric field -- has an impact on several promising technological fields, such as plasma propulsion and plasma processing (Kaganovich et al. Reference Kaganovich, Smolyakov, Raitses, Ahedo, Mikellides, Jorns, Taccogna, Gueroult, Tsikata and Bourdon2020), and centrifugal separation (Zweben, Gueroult & Fisch Reference Zweben, Gueroult and Fisch2018).
A large number of studies have been dedicated to the exploration of how boundary conditions might change the rotation profile in plasmas. Most of these studies focused on the influence of the bias of cold limiters, concentric rings or grids on the rotation profiles and on the rotation-shear profiles of plasma columns or plasma tori (Hooper et al. Reference Hooper, Cohen, Correll, Gilmore and Grubb1985; Tsushima et al. Reference Tsushima, Mieno, Oertl, Hatakeyama and Sato1986; Severn et al. Reference Severn, Hershkowitz, Breun and Ferron1991; Brochard, Gravier & Bonhomme Reference Brochard, Gravier and Bonhomme2005; Schaffner et al. Reference Schaffner, Carter, Rossi, Guice, Maggs, Vincena and Friedman2013; Terasaka et al. Reference Terasaka, Tanaka, Yoshimura, Aramaki, Sakamoto, Kawazu, Furuta, Takatsuka, Masuda and Nakano2015; Desjardins & Gilmore Reference Desjardins and Gilmore2016; Gueroult et al. Reference Gueroult, Evans, Zweben, Fisch and Levinton2016). Fewer studies investigated the effect of emissive cathodes on the control of the velocity profile and on the rotation-shear profile. Following the pioneering studies in the late 1980s (Intrator et al. Reference Intrator, Cho, Wang, Hershkowitz, Diebold and DeKock1988; Taylor et al. Reference Taylor, Brown, Fried, Grote, Liberati, Morales, Pribyl, Darrow and Ono1989), the community showed recently a renewed interest in this topic (Moon et al. Reference Moon, Kaneko, Tamura and Hatakeyama2010; Plihon et al. Reference Plihon, Bousselin, Palermo, Morales, Bos, Godeferd, Bourgoin, Pinton, Moulin and Aanesland2015; Jin et al. Reference Jin, Poulos, Van Compernolle and Morales2019). In this article, we investigate in detail the scheme proposed in Plihon et al. (Reference Plihon, Bousselin, Palermo, Morales, Bos, Godeferd, Bourgoin, Pinton, Moulin and Aanesland2015) where a background radio-frequency plasma column is stirred using large emissive cathodes inserted into the plasma column.
This article shows that current emission over a background plasma is an efficient way to continuously control the plasma rotation profile. We show that the rotation profile is set by the local value of the electric drift and that current injection modifies the plasma potential profile. Several recent theoretical models have been developed to understand how biased electrodes modify the potential distribution in strongly or weakly magnetized plasma columns (Curreli & Chen Reference Curreli and Chen2014; Gueroult, Rax & Fisch Reference Gueroult, Rax and Fisch2019; Poulos Reference Poulos2019; Liziakin, Gavrikov & Smirnov Reference Liziakin, Gavrikov and Smirnov2020). Our experimental investigation provides a set of experimental data in the weakly magnetized regime, which complements the work of Jin et al. (Reference Jin, Poulos, Van Compernolle and Morales2019) in strongly magnetized regimes.
The experimental set-up and the plasma diagnostics used is this article are detailed in § 2. Section 3 first presents the operation of the large emissive cathodes over the background radio-frequency plasma column. The ability to continuously control the plasma rotation using strong current emission is then shown. The experimental rotation profiles are then analysed in § 4 in the framework of plasma drifts perpendicular to the magnetic field, strongly damped by collisions. The azimuthal dependence of the rotation profile and the effect of the central anode are discussed in § 5. Finally, concluding remarks are given in § 6.
2. Experimental set-up
2.1. Experimental apparatus
The experimental set-up consists of a magnetized plasma column, described in detail in Plihon et al. (Reference Plihon, Bousselin, Palermo, Morales, Bos, Godeferd, Bourgoin, Pinton, Moulin and Aanesland2015), and main characteristics of which are recalled here. The plasma is created by a radio-frequency inductive source made of a 3-turn helicoidal coil wrapped around a 11 cm inner diameter borosilicate bell jar. The antenna is powered by a 3.3 kW radio-frequency (r.f.) power supply running at 13.56 MHz through a manual L-type matching box (Lieberman & Lichtenberg Reference Lieberman and Lichtenberg2005). The plasma then enters an 80 cm long, 20 cm in diameter grounded stainless-steel cylinder – the $z$ -axis being defined as the axis of the cylinder, while $x$
 is the horizontal axis and $y$
 the vertical axis (see figure 1). Argon gas is injected through a puffed valve at the top of the experiment, close to the source, in the plane $z = 16\ \textrm {cm}$
 and is pumped down by a primary pump and a turbo-molecular pump located on the side of the experiment, further away from the source, in the plane $z = 49\ \textrm {cm}$
 . Working pressures are in the millitorr range, while base vacuum is routinely below $10^{-6}\ \textrm {Torr}$
 ($1.4 \times 10^{-4}\ \textrm {Pa}$
 ). The plasma is confined by an axial magnetic field generated by a set of three Bitter coils located around the vessel in the planes $z = 3$
 , $z = 29$
 and $z = 69\ \textrm {cm}$
 . Each coil is composed of one hundred copper rings of 26 cm inner diameter and 58 cm outer diameter, generating a 50 turn coil of thickness 11 cm. All coils are powered by the same constant current and produce a field up to 1500 G along the axis of the experiment. All results presented in this article were obtained for typically 1 kW of r.f. power, magnetic fields of the order of 100 G and pressure around 1 mTorr, leading to plasma columns with densities of a few $10^{18}\ \textrm {m}^{-3}$
 , an electron temperature of a few eV and a radial extension $R$
 of typically 5 cm (see § 2.2). In this context, the electrons are fully magnetized, while the ions are weakly magnetized – which is why we call theses regimes weakly magnetized. Indeed, the ion Larmor radius is of the order of 2 cm (i.e. 0.4 $R$
 ) and the ion–neutral collision frequency is of the same order of magnitude as the ion cyclotron frequency.
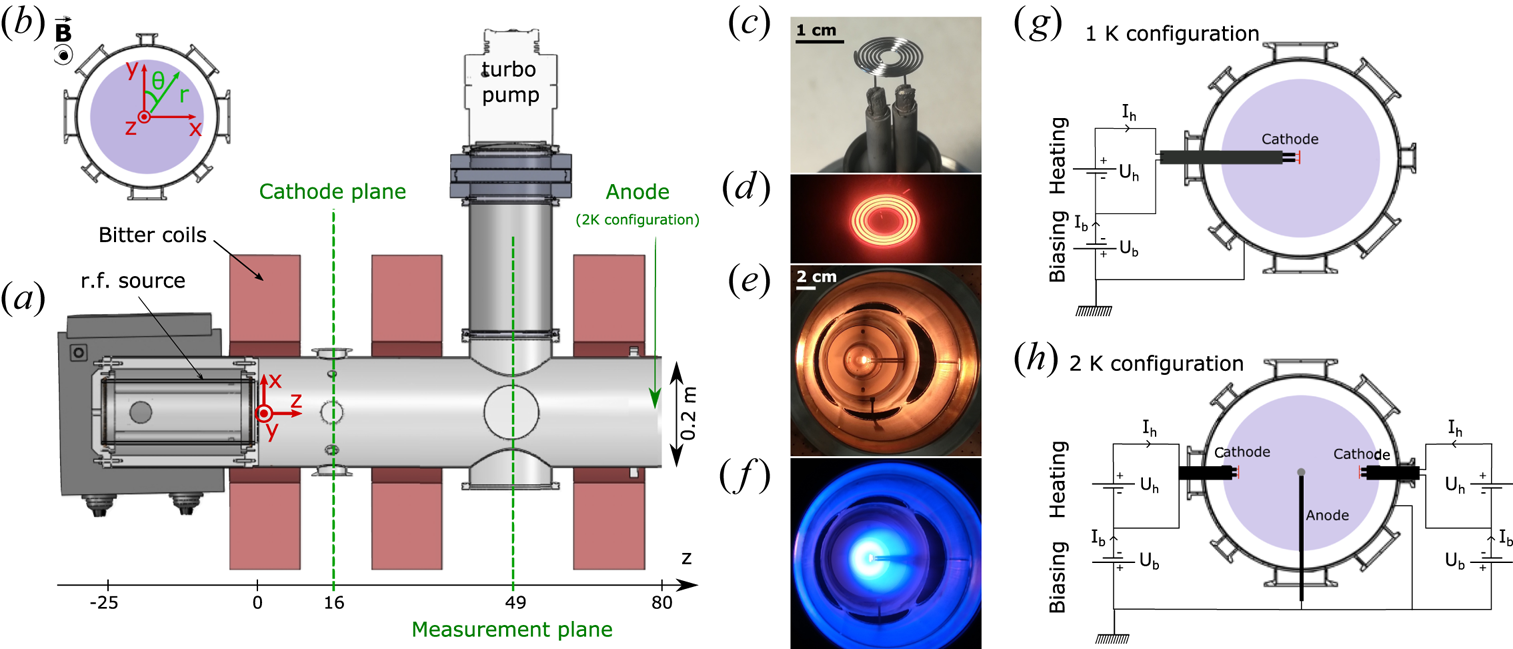
Figure 1. Experimental set-up: (a) top view, (b) end-port view. A large emissive electrode modifies the plasma parameters. (c) Photograph of the emissive filament, and glowing emissive filament when heated up to approximately 1500 K; (d) close up, (e) when the plasma is off and (f) when the plasma is on. Electrical configurations with (g) one cathode and (h) two cathodes inserted. See text for details.
The goal of this article is to investigate and demonstrate the ability to control the rotation profile of the plasma column when inserting large emissive cathodes into the plasma column. The operation of the emissive cathodes is detailed in § 3.1; it consists of a tungsten filament heated up to 2650 K and negatively biased to emit a few amperes into the plasma. The emissive cathodes may be inserted in the centre of the plasma column or at mid-radius. One configuration studied here consists of a single cathode in the centre (see figure 1g) and the other consists of two cathodes located at $x=\pm 3\ \textrm {cm}$ and an anode in the centre (see figure 1h). The electrical boundary conditions of the end plates of the cylinder are chosen as insulating: an alumina ring (110 mm inner diameter, 197 mm outer diameter) is installed at $z=0\ \textrm {cm}$
 and a borosilicate disk (195 mm outer diameter) is installed at $z=80\ \textrm {cm}$
 . The current flows in the presence of strong electron emission from the cathodes are discussed in § 5, but we summarize here the overall picture. The electrons emitted by the cathodes are strongly magnetized and lead to the formation an axial electron beam radially and azimuthally localized at the cathode location. The cathode current is thus balanced by an ion current, driven towards the cathode. In the presence of a single cathode, this means a radially inward current. In the configuration with two off-centred cathodes and an anode this corresponds to a radially outward current in the central region, and a radially inward current in the outer region (for radii larger than the location of the cathodes).
To keep the whole apparatus in a steady thermal state, the operation of the plasma is pulsed: the plasma is sustained over typically 1 s, during which data are acquired, with a repetition period of typically 30 s. Note that, when emissive cathodes are used, the heating power supplies are always kept on, which maintains a high temperature of the tungsten filaments. The biasing power supplies are powered only when the plasma has been fired by the r.f. power supply. The whole experiment is fully automated to allow high repeatability and reproducibility of the plasma. The level of shot-to-shot reproducibility is ${\pm }0.6\,\%$ for the ion saturation current of a Langmuir probe, with a standard deviation of $0.2\,\%$
 (estimated from a series of 40 shots) and ${\pm }50\ \textrm {mV}$
 for the plasma potential from an emissive probe, with a standard deviation of 13 mV (estimated from a series of 20 shots). The probes are inserted in the measurement plane at $z=49\ \textrm {cm}$
 , either along the $x$
 or the $y$
 -axis using motorized translators. Diametrical scans of the plasma parameters are acquired sequentially: each spatial point has been acquired during one plasma pulse, and the probe is translated between two pulses.
2.2. Experimental methods
Plasma parameters reported in this article were measured using electrostatic probes: plasma density and electron temperature from Langmuir probes, plasma potential from emissive probes and ion velocity from Mach probes (Désangles Reference Désangles2018). The Langmuir probes are composed of a single tip made of a 1 mm long 0.2 mm tungsten wire enclosed in a single alumina probe shaft of 1.5 mm outer diameter and 0.8 mm inner diameter. The current–voltage characteristics (Chen Reference Chen2003) are measured using a National Instrument Source and Measure Unit PXIe-4139. The Langmuir probes were not r.f. compensated, but previous studies showed that, in the range of parameters used for this study, r.f. compensated Langmuir probes (Sudit & Chen Reference Sudit and Chen1994) showed similar results to uncompensated Langmuir probes. The plasma density is computed following the method proposed in Chen, Evans & Arnush (Reference Chen, Evans and Arnush2002). The emissive probes (Sheehan & Hershkowitz Reference Sheehan and Hershkowitz2011) are made of an 8 mm long loop of 0.2 mm diameter tungsten filament held by a two bore alumina shaft of 6 mm outer diameter. The filament is made emissive by Joule heating: a home-made constant-current controller delivers up to 8 A from a 12 V battery. The heating current is controlled with an uncertainty of $\pm$ 0.1 A, leading to a $\pm$
 0.25 V uncertainty on the measured plasma potential. The heating current is evaluated for each set of experimental parameters following the method proposed in Kemp & Sellen (Reference Kemp and Sellen1966) and is kept constant for a diametrical scan. The Mach probes are made of two 4 mm diameter and 0.1 mm thick Tantalum disks back to back to each other, embedded in an 8 mm diameter ceramic head, following the design described by Weisberg (Reference Weisberg2016). The probe head is held by a two-bore ceramic shaft of 4 mm outer diameter. Both Tantalum disks are biased at $-$
 60 V with respect to the grounded vessel by two independent DC power supplies, and the flowing ion saturation current is measured using shunt resistors. The ion flow velocity is then obtained from the logarithm of the ratio of the ion saturation current density measured on the collector facing the ion flow ($J_{\textrm {sat},\textrm {up}}$
 ) to the ion saturation current density measured back to the flow ($J_{\textrm {sat},\textrm {dn}}$
 ) (Chung Reference Chung2012) as $V_i = ({C_s}/{K_m}) \ln {({J_{\textrm {sat},\textrm {up}}}/{J_{\textrm {sat},\textrm {dn}}})}$
 , where $C_s$
 is the sound speed (assessed for the different plasma conditions in the experiment and taken uniform over the plasma and equal to $3500\ \textrm {m}\ \textrm {s}^{-1}$
 ) and $K_m$
 is a calibration factor taken from Particle In Cell and fluid simulations results available in the literature (Chung Reference Chung2012). In the case of unmagnetized ions (ion Larmor radius greater than the probe dimension) and cold plasma ($T_i < 3 T_e$
 , where
  ${{{T}}_{i}}$ is the ion temperature and
  ${{{T}}_{e}}$ is the electron temperature), we use the recommended and commonly used (Chung Reference Chung2012; Collins et al. Reference Collins, Katz, Wallace, Jara-Almonte, Reese, Zweibel and Forest2012) value of 1.34. The other sources of uncertainties on the estimate of the ion velocity by Mach probes are respectively the evaluation of the collection area, the probe angular position relative to the azimuthal flow and the influence of an eventual axial flow (Shikama et al. Reference Shikama, Kado, Okamoto, Kajita and Tanaka2005). The influence of the collection area is corrected by a systematic procedure averaging two 180 degree symmetric measurements (one face facing the flow, and then back to the flow). The second issue is mitigated by the development of a protractor on the probe mechanical feed-through flange. From calibration measurements, we estimate the uncertainties over the measured velocity to be smaller than $100\ \textrm {m}\ \textrm {s}^{-1}$
 for our experimental set-up. We adopt here a conservative approach and chose to keep error bars of $100\ \textrm {m}\ \textrm {s}^{-1}$
 , including uncertainties related to drift of plasma conditions, probe conditions and probe perturbations. We note that, due to different geometries of our probes, the spatial averaging of the measurements varies from $1$
 mm for the plasma density and electron temperature to $4$
 mm for the plasma potential and the ion velocity.
2.3. Typical background plasma parameter profiles
Figure 2 displays diametrical scans of the plasma density $n$ , electron temperature $T_e$
 and plasma potential $\varPhi _p$
 , measured along the $x$
 -axis in the plane $z = 49\ \textrm {cm}$
 , for a typical set of experimental control parameters (120 G, 1 kW and 1 mTorr), showing a plasma column with a typical radial extension $R\sim 5\ \textrm {cm}$
 . This configuration is the reference plasma background case, over which we investigate the effect of current injection from large emissive cathodes. This reference background plasma case will be labelled 0-K in the remainder of this article, for no cathode present in the plasma column. We note a weak hollow centre on the plasma density, which is likely to be a skin-depth effect of the ionization by the r.f. inductive source (Chabert & Braithwaite Reference Chabert and Braithwaite2011). A slight asymmetry is observed on the plasma parameter profiles, whose origin lies on the geometry of the r.f. antenna (which is not perfectly axisymmetric) and the disturbances due to the presence of intrusive probes.Footnote 1 In the remainder of the article, we analyse the experimental results in a framework where we assume axisymmetric plasma parameters; we therefore introduce a procedure which symmetrizes the experimental plasma parameters with respect to the centre of the vessel. The experimental data points $X(x)$
 are first interpolated and smoothed as $X^i (x)$
 (the original experimental data points are filtered using a 7-point, first-order Savitzky–Golay filter, before being linearly interpolated every 1 mm), and an axisymmetric field $X_s(r)$
 is computed as $X_s(r=a) = [ X^i(x=a) +X^i(x=-a) ]/2.$
 The steps of this procedure are shown in figure 2, resulting in the symmetrized fields shown as dashed lines. All experimental measurements displayed in the remainder of this article have been symmetrized.
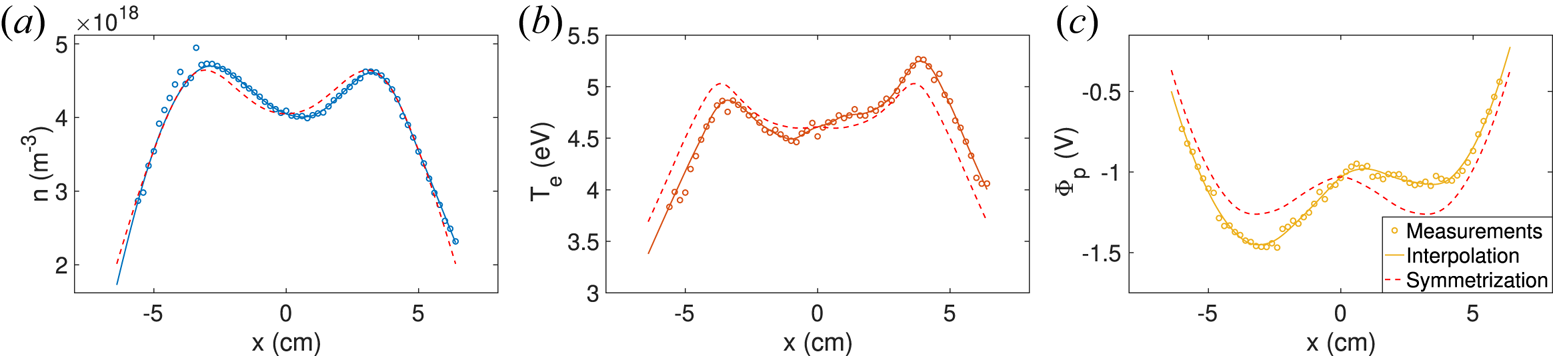
Figure 2. Diametrical scan of $n$ , $T_e$
 and $\varPhi _p$
 for a 120 G, 1 kW and 1 mTorr plasma: raw measurements $X$
 (open symbols), interpolated data $X^i$
 (solid line) and symmetrized fields $X^s$
 (dashed line).
3. Control of the rotation profile using large emissive electrodes
3.1. Characterization of current emission by a large emissive electrode
Let us first describe the experimental operation of the large emissive cathodes inserted within the background plasma column in order to drive and control the rotation profile. The large emissive cathode is a 0.508 mm diameter tungsten wire rolled up on itself over 6.25 turns (see figure 1c). The legs of the filament are mechanically locked in 4 mm diameter copper rods (insulated from the plasma by alumina tubes) which feed the current to the cathode. The cathodes’ filaments were bought from Union City Filament (custom design ref. 119–114). The cathodes can be inserted in the plasma radially from ports in the $z=16\ \textrm {cm}$ plane. The principle of operation is the following: the filaments (i) are Joule heated up to 2650 K in order to become strongly emissive, using a heating DC power supply and (ii) are negatively biased with respect to the plasma potential using a biasing DC power supply, typically down to $- 40$
 V with respect to ground, in order to emit an electronic current of approximately 10 A in the plasma. Two different experimental arrangements have been used for the purpose of this communication: one cathode in the centre of the plasma (configuration 1 K in figure 1g) and two cathodes off centred at $x = \pm 3\ \textrm {cm}$
 with a grounded anode in the centre of the plasma, located at $z = 70\ \textrm {cm}$
 (configuration 2 K in figure 1h).
A strongly emissive regime is obtained when flowing a heating current $I_h$ within the filament, typically reaching 20 A (resulting in a voltage drop $U_h$
 of the order of 18 V, i.e. 360 W of heating power). Both the current $I_h$
 and the voltage $U_h$
 of the heating power supply are measured in vacuum and in the absence of plasma. The temperature of the tungsten filament can then be estimated using the calibrated tungsten resistivity (Desai et al. Reference Desai, Chu, James and Ho1984). This estimate is in excellent agreement with measurements using an optical pyrometer (Raytek RAYMR1SCSF), with uncertainties lower than 10 K. Note that we chose to control the heating of the tungsten filament imposing the voltage of the heating power supply, although, at first sight, the current seems to be the most accurate experimental control parameter. Indeed, when the cathode is in contact with a plasma and left floating (as occurs for each shot during the ignition phase of the plasma), the voltage drop within the filaments drives currents to and from the plasma, which do not significantly contribute to the Joule heating. In short, this can be understood from the fact that, in the presence of a plasma, only the centre of the emissive filament floats at the plasma potential. Half of the filament is at a potential larger than the plasma potential (drawing electrons from the plasma) and half of the filament is at a potential lower than the plasma potential (emitting electrons to the plasma); these extra currents add up to the heating current when the voltage is kept constant, but do not contribute to heating. We checked, from measurements using the pyrometer, that the temperature of the emissive cathode does not increase when the plasma is ignited, supporting our choice for the control of the temperature of the emissive cathode.
During one shot, once the plasma has been ignited, the cathode is biased negatively at voltage $U_b$ with respect to ground, using a biasing DC power supply. The voltage bias of the cathode $\varPhi _{c}$
 is defined as the averaged potential over the length of the filament: $\varPhi _{c} = U_{b} +{U_{h}}/{2}$
 . The evolution of the bias current $I_b$
 fed by the biasing power supply to the emissive cathode as a function of the cathode bias is reported in figure 3(a) for several values of the cathode temperature. As expected, the bias current is controlled by the temperature of the tungsten filament $T$
 and the cathode bias relative to ground $\varPhi _{c}$
 . This current significantly increases as the temperature increases, and exceeds 10 A when the temperature exceeds 2600 K (the ion saturation current of the cold cathode being 280 mA). The emitted current is introduced as $I_{\textrm {em}}(\Delta \varPhi , T) = \lvert I_b(\Delta \varPhi ,T) - I_b(\Delta \varPhi ,T=285\ \textrm {K})\rvert$
 with $\Delta \varPhi$
 being the potential of the cathode relative to the unperturbed plasma potential (i.e. when the cathode is left floating) $\Delta \varPhi = \varPhi _c - \varPhi _{p, I_{\textrm {em}}=0}$
 . The evolution of $I_{\textrm {em}}$
 as a function of $\Delta \varPhi$
 is displayed in figure 3(b). An empirical evolution of the emitted current $I_{\textrm {em}}$
 as a function of the cathode temperature $T$
 and the bias $\Delta \varPhi$
 is well captured by Richardson's law (Richardson Reference Richardson1924), introducing an effective emission area of the filament $\mathcal {A}_\textrm {eff}(\Delta \varPhi )$
 as
as

with $A_G=6.0 \times 10^5\ \textrm {A}\ \textrm {K}^{-2}\ \textrm {m}^{-2}$ the Richardson constant (Bernhard Reference Bernhard1995; Gale & Totemeier Reference Gale and Totemeier2004), $W=4.54\ \textrm {eV}$
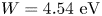 the work function of tungsten and $k_b$
 the Boltzmann constant. The effective emission area $\mathcal {A}_\textrm {eff}(\Delta \varPhi )$
 takes into account the current of electrons from the plasma, collected at the cathode, which increases as $\Delta \varPhi$
 increases, allowing for an empirical prediction of the current delivered by the biasing power supply and injected into the plasma. We stress here that the evolution of the emitted current following (3.1) does not take into account the shift of the central plasma potential $\varPhi _p(r=0)$
 towards negative values when the cathode is strongly emissive and negatively biased (i.e. $\varPhi _{c}\ll 0$
 ). The modification of the central plasma potential $\varPhi _p(r=0)$
 in the presence of strongly emissive cathodes will not be discussed further in this article, but it is worth noting that the shift can reach $-$
 14.5 V for a cathode biased at $-$
 40 V and emitting 12 A.
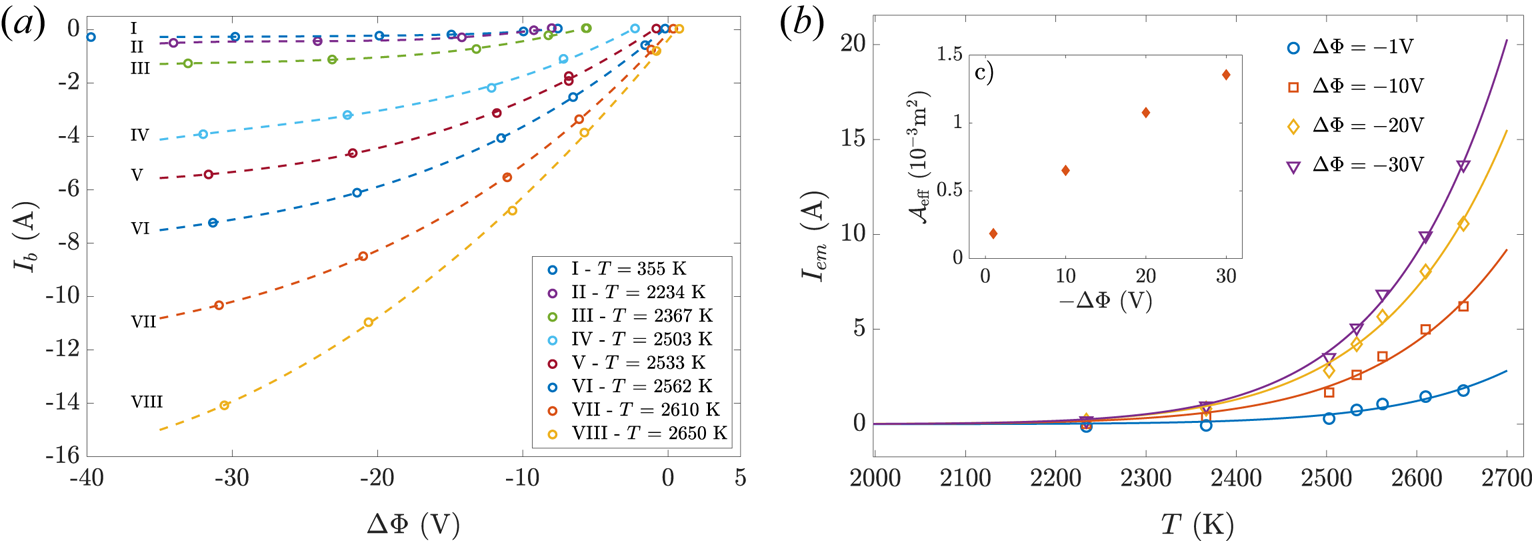
Figure 3. (a) Evolution of the bias current $I_b$ as a function of the bias voltage $\varPhi _c$
 for various values of the cathode temperature $T$
 , (b) thermionic emitted current as a function of $T$
 for various bias voltages $\Delta \varPhi$
 . The inset shows the evolution of the effective area $\mathcal {A}_\textrm {eff}$
 as a function of $\Delta \varPhi$
 . See text for details.
3.2. Control of the plasma rotation profile
In this subsection, we demonstrate that large current emission from the cathodes allows for the control of the azimuthal flow. As previously introduced, three configurations are detailed in this article. The reference case (labelled 0-K) corresponds to the background plasma created by the r.f. source for a 120 G magnetic field, a 1 kW absorbed r.f. power, at pressure 1.0 mTorr, whose plasma parameters are displayed in figure 2. Two configurations in which the plasma flows of the background plasma are modified by current emission from large cathodes are analysed here: one configuration in which one cathode located at the centre of the plasma column injects current to the vessel wall (referred to as the 1-K configuration in figure 1, for one single cathode inserted in the plasma column) and one configuration in which two off-centred cathodes drive current to the vessel wall and to an anode located in the centre of the column (referred to as the 2-K configuration in figure 1, for two cathodes inserted in the plasma column). The emissive cathodes are located in the $z = 16\ \textrm {cm}$ plane, while plasma parameters reported in this section were measured in the $z = 49\ \textrm {cm}$
 plane (heat radiation and high energy electrons emission by the cathodes spoil measurements in the $z = 16\ \textrm {cm}$
 plane, which are not discussed here).
The background plasma column displays radial gradients of the plasma potential and of the plasma pressure and a rotation profile is expected to emerge from drift velocities. Indeed, a strong azimuthal flow measured using Mach probes, is observed for the reference configuration (0-K), as displayed in figure 4(a) (open black circles). The velocity profile is strongly sheared with a clockwise flow for $r<3.5\ \textrm {cm}$ and a counter-clockwise flow for $r>3.5\ \textrm {cm}$
 . We will show in the next section that the features of this flow profile are understood from the local electric drift. Inserting floating hot cathodes does not modify the azimuthal plasma flow, as displayed in figure 4(a) for the single centred cathode configuration and the two off-centred cathodes configuration respectively labelled 1-K – off and 2-K – off . These flow measurements confirm that floating hot cathodes indeed behave similarly to emissive probes and that, despite the voltage drop $U_h$
 across the cathode (due to finite resistivity and Joule heating) our large emissive cathodes float at a potential close to the local plasma potential, and do not affect the global plasma equilibrium.
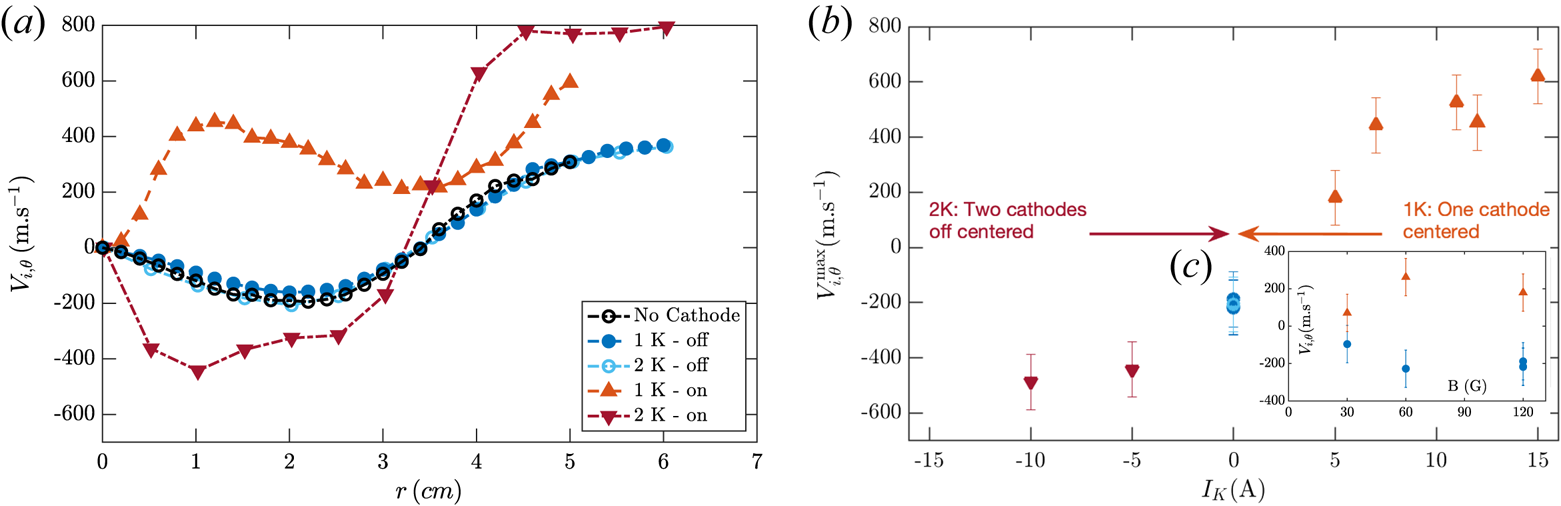
Figure 4. (a) Radial profiles of the azimuthal velocity $V_{i,\theta }$ measured using Mach probes: reference case (0-K), configuration with a single cathode in the centre (1-K) emitting 12 A and configuration with two off-centred cathodes (2-K), each one emitting 5 A. Floating hot cathode configurations are labelled off and emissive cathodes are labelled on. (b) Amplitude of the peak velocity $V_{i,\theta }^{\max }$
 as a function of the emitted current $I_K$
 (see text for details). (c) Evolution of $V_{i,\theta }^{\max }$
 as a function of the magnetic field amplitude $B$
 for the 0-K configuration (blue circles) and the 1-K configuration (upper orange triangles) for a 5 A emission current.
In contrast with floating cathodes, the azimuthal velocity profile is drastically modified for large current emission by the cathodes. Let us first focus on the azimuthal velocity profile in configuration 1-K, for 12 A of emitted current $I_{\textrm {em}}$ , displayed in figure 4(a) (upper orange triangles). When a large electron current is emitted at the centre of the plasma column, the azimuthal velocity is positive everywhere in the plasma column, i.e. the whole column rotates in the counter-clockwise direction. Electron current injection at the centre of the plasma column thus leads to a reversal of the rotation in the centre of the column. An opposite situation has been observed in the 2-K configuration: the central part of the plasma column rotates in the clockwise direction (similarly the 0-K configuration), but the amplitude of the flow is strongly increased, as observed in figure 4(a) (lower red triangles) when each of the two cathodes emit 5 A. This shows that the direction of rotation of the ions in the central part of a plasma column can be efficiently controlled by strong emission of electrons from emissive cathodes at specific locations. Surprisingly, the velocity profile in the outermost region of the plasma column is affected similarly, i.e. the counter-clockwise outer rotation is slightly increased by current emission with respect to the 0-K reference configuration. The origin of this effect is still unclear, but, as shown in § 5, this effect is absent in the vertical plane. A possible explanation could be the interaction, in the horizontal plane, of the large cathode shafts, which are partially grounded at large radii, with the current injection by the cathodes.
In order to quantify the influence of the emitted current, the evolution of the peak velocity $V_{i,\theta }^{\max }$ for $r<3.5\ \textrm {cm}$
 is displayed as a function of the cathode current $I_{K}$
 in figure 4(b) ($V_{i,\theta }^{\max }$
 is the velocity at zero radial shear, i.e. the maximum velocity for a profile of positive values of $V_{i,\theta }$
 , such as for the 1-K configuration, and the minimum velocity for a profile of negative values of $V_{i,\theta }$
 , such as for the 0-K configuration). As a convention, the cathode current is positively defined in the 1-K configuration (i.e. $I_K = I_{\textrm {em}}$
 ), and negatively defined in the 2-K configuration (i.e. $I_K = - I_{\textrm {em}}^1 = - I_{\textrm {em}}^2$
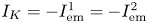 , where $I_{\textrm {em}}^1$
 is the current emitted by cathode 1). The origin $I_{K} = 0$
 A corresponds to the 0-K configuration, for which $V_{i,\theta }^{\max } = -200\ \textrm {m}\ \textrm {s}^{-1}$
 . As $I_K$
 increases, $V_{i,\theta }^{\max }$
 continuously increases, and exceeds $600\ \textrm {m}\ \textrm {s}^{-1}$
 when $I_K = 15\ \textrm {A}$
 (upper orange triangles). On the other hand, when $I_K$
 decreases, $V_{i,\theta }^{\max }$
 continuously decreases (lower red triangles). The scan in emitted current $I_{K}$
 reported in figure 4(b) was obtained with constant heating of the cathode (2650 K) while varying the amplitude of the bias $U_b$
 typically from $-20$
 to $-40$
 V; i.e. it was obtained following one of the constant-temperature curves displayed in figure 3(a). The detailed effect of the ion magnetization, through the evolution of the amplitude of the magnetic field $B$
 , is left for future studies, however, figure 4(c) shows that current injection in the 1-K configuration allows us to reverse the rotation profile for several values of the magnetic field $B$
 for $I_K= 5\ \textrm {A}$
 . For all amplitudes of the magnetic field, the value of peak velocity $V_{i,\theta }^{\max }(I_K=0)$
 in the reference 0-K configuration is negative (displayed as blue circles in figure 4c), while the value of peak velocity $V_{i,\theta }^{\max }(I_K=5)$
 in 1-K configuration is positive (displayed as upper orange triangles).
4. Drift velocity controlled by current emission
4.1. Drift velocity damping by collisions
In this section, we now show that the modifications of the azimuthal flow profile can be attributed to the modification of the plasma potential profile. The analysis is developed assuming axisymmetry and thus applied to the 0-K and 1-K configurations, however, a similar approach seems applicable to the 2-K configuration, as discussed in § 5. Assuming axisymmetry of the plasma column, the momentum equation for the ions leads to an azimuthal ion drift velocity involving an electric drift term $\boldsymbol {V_E} = (\boldsymbol {E} \times \boldsymbol {B})/{B^2}$ and an ion diamagnetic drift term $\boldsymbol {V_D} = - ({\boldsymbol {\nabla }}P_i \times \boldsymbol {B})/(n e B^2)$
 expressed as

where K is a factor accounting for the drag exerted on ions. The drag factor $K$ may be expressed as $K = 1 + ( \nu _m/\omega _{ci} )^2$
 (Chen Reference Chen2016), where $\nu _m$
 is the macroscopic momentum transfer frequency (Hagelaar Reference Hagelaar2008), which reads $\nu _m = \nu _{\textrm {in}} + \nu _{\textrm {iz}}$
 , and which takes into account momentum drag from ion–neutral collisions through the ion–neutral collision frequency $\nu _{\textrm {in}}$
 and the creation of ions through the ionization frequency $\nu _{\textrm {iz}}$
 .Footnote 2
The ion–neutral collision frequency is evaluated as $n_n \left \langle \sigma _{\textrm {in}} v_{\textrm {th},i}\right \rangle$ , where $n_n$
 is the neutral gas density, $\sigma _{\textrm {in}}$
 is the momentum exchange cross-section between an ion and a neutral and $v_{th,i}$
 the most probable thermal speed equal to $\sqrt {8kT_i/{\rm \pi} m_i}$
 . The values of $K$
 have been estimated assuming an ion temperature $T_i$
 equal to 0.2 eV for the 0-K configuration and equal to 0.32 eV for the 1-K configuration (a value estimated from laser induced fluorescence of the 442.6 nm ArII line (Bieber et al. Reference Bieber, Bardin, De Poucques, Brochard, Hugon, Vasseur and Bougdira2011)) and thus the cross-section $\sigma _{\textrm {in}}$
 at 0.2 eV and 0.32 eV (Phelps Reference Phelps1991, Reference Phelps1994). The theoretical estimate of the damping factor $K$
 assumes a flat neutral density profile (estimated from neutral pressure measured at the wall), and involves the plasma density averaged between $r=0$
 and $r=4\ \textrm {cm}$
 (using Langmuir probe measurements) and a constant ion temperature over the plasma column. The ionization frequency is estimated from the functional form $\nu _{\textrm {iz}} = n_n K_{\textrm {iz}}$
 , with $K_{\textrm {iz}}= 2.34\ 10^{-14}T_e^{0.59}e^{-17.44/T_e}\ \textrm {m}^3\ \textrm {s}^{-1}$
 (Lieberman & Lichtenberg Reference Lieberman and Lichtenberg2005). Assuming a neutral temperature of 350 K and an average electron temperature $T_e=4.6\pm 0.2\ \textrm {eV}$
 , this leads to values of $K_\textit {{0K}} = 7.2\pm 1$
 for the 0-K configuration and $K_\textit {{1K}} = 7.3\pm 1$
 for the 1-K configuration when the emissive cathode emits 12 A. We stress here that, for the plasma parameters investigated here, the ion–neutral collision frequency $\nu _{\textrm {in}}$
 and the ionization frequency $\nu _{\textrm {iz}}$
 are of the same order of magnitude, and thus contribute equally to the damping of the flow (i.e. even if there were no charge exchange collisions, the flow would be strongly damped). We also stress that the value of the drag factor $K$
 depends on the exact values of the electron temperature, ion temperature and the collisions cross-sections, with an extreme sensitivity on the electron temperature. We now show in next subsection that our experimental results may be interpreted from a damped electric drift.
4.2. Local drift computation
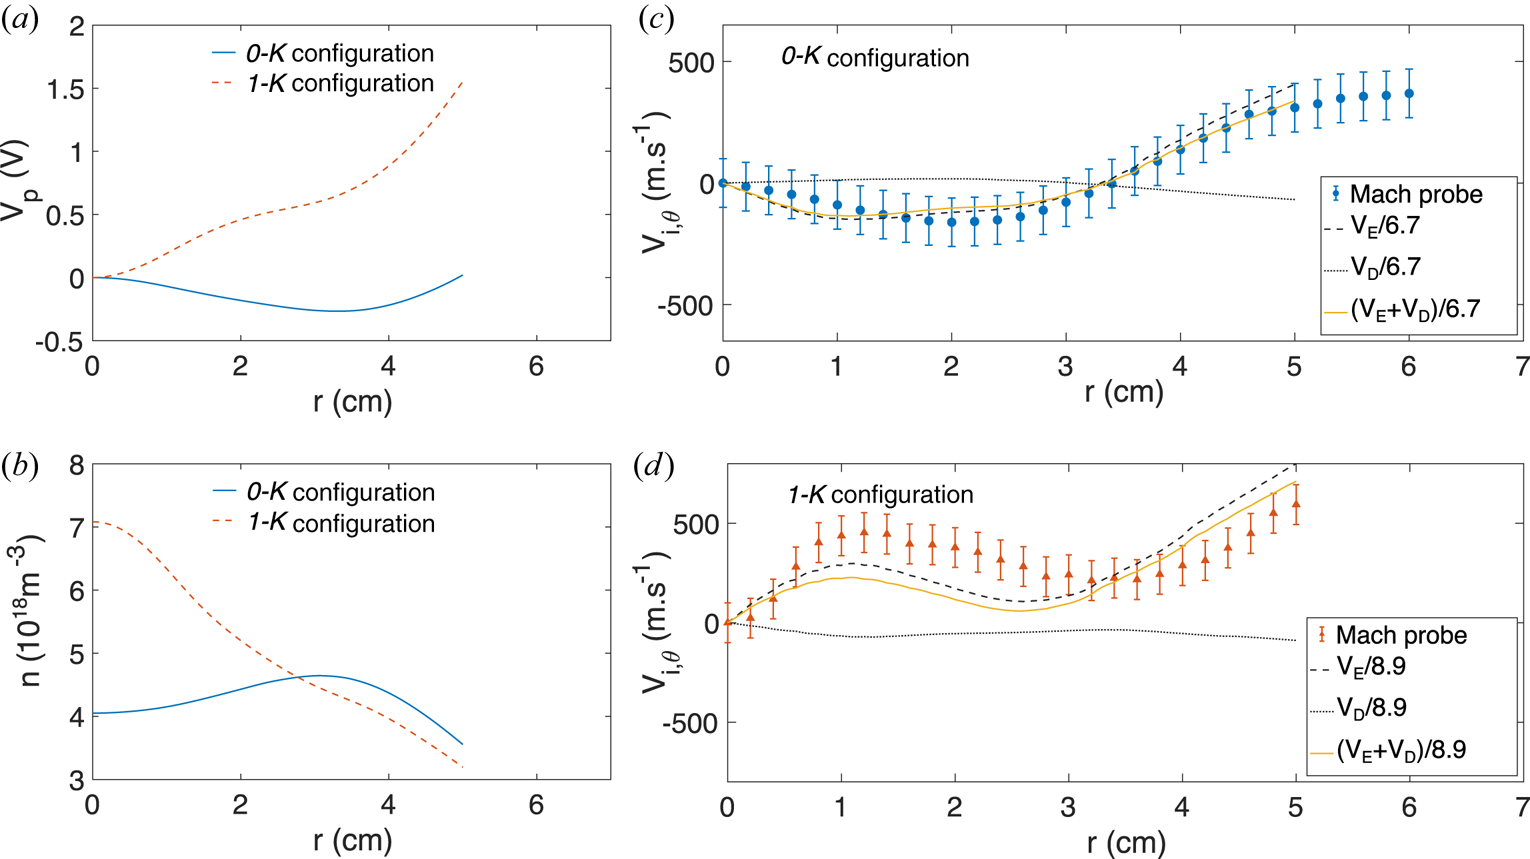
Figure 5(a) displays the relative plasma potential profiles $V_p$ measured from emissive probes and figure 5(b) shows the density profiles for configurations 0-K and 1-K for 12 A of current emitted by the cathode. To increase readability, the relative plasma potential $V_p$
 is defined as $V_p(r) = \varPhi _p(r)-\varPhi _p(r=0)$
 , with values of the plasma potential at the centre equal to $\varPhi _p(r=0) = -1$
 V for the 0-K configuration and to $\varPhi _p(r=0) = -15.5$
 V for the 1-K configuration at 12 A of emitted current. Strong electron current emission from a negatively biased cathode at the centre thus shifts negatively the plasma potential of the plasma column (the cathode bias was set to $U_b= -40$
 V). In addition to the global shift of the plasma potential, the injection of electron current in the centre also strongly modifies the shape of the plasma potential profile. The plasma potential profile of the background plasma column (0-K configuration) decreases from the centre outward, reaches a minimum around $r=3.5\ \textrm {cm}$
 and increases on the outward. The plasma potential profile is in strong contrast with the 1-K configuration; it continuously increases outward, with a localized drop of the potential near the cathode. This leads to a reversal of the local electric field, and thus a reversal of the electric drift velocity between the 0-K and 1-K configurations. Electron emission also strongly modifies the plasma density profiles, as can be seen in figure 5(b); ionization from the beam of primary electrons in the central part of the column strongly increases the plasma density in the central part of the plasma column ($r\leq 2\ \textrm {cm}$
 ), which also leads to a reversal of the diamagnetic drift velocity between the 0-K and 1-K configurations.

Figure 5. (a) Plasma potential (relative to the plasma potential at $r=0$ ) and (b) plasma density profiles for the configurations 0-K and 1-K (emitting 12 A). Experimental and computed drift velocities profiles for the (c) 0-K and (d) 1-K configurations.
The computation of electric drift and the ion diamagnetic drift velocities from the experimental profiles of the plasma parameters shows that the electric drift velocity clearly exceeds the diamagnetic drift velocity (see figure 5c,d). Moreover, the total drift velocity profile is strongly correlated with the experimental ion flow profiles displayed in figure 4(a). An empirical drag factor $K_e$ is introduced by the minimization of the function $f(K_e) = V_{i,\theta } - (V_E + V_D)/K_e$
 . The experimental ion velocity profiles and the damped drift velocities, including the minimization factor $K_e$
 , are displayed in figure 5(c,d) for the 0-K configuration (with $K_{e}^{0K} = 6.7$
 ) and the 1-K configuration, respectively (with $K_{e}^{1K} = 8.9$
 ). A good agreement is found between the measured velocity profile and the sum of the damped drift velocities, which are dominated by the electric drift velocity. The electron current injected by large emissive cathodes allows us to control the profile of the plasma potential and, in turn, the azimuthal velocity profile; large emissive cathodes are thus a very efficient means to achieve rotation profile control. While the empirical and theoretical values of the drag factor $K$
 are of the same order of magnitude, their small discrepancy is most probably due to one of the following reasons: an overestimate of the electric field when measuring the plasma potential profile with the emissive probe (the probe heating current is kept constant over the plasma column radius which likely leads to an overestimate of the plasma potential gradient) or the uncertainty on the renormalizing factors used in the Mach probe signal analysis.
We note here that the ion Larmor radius is of the order of the plasma potential gradient length, and that the conditions for the application of the $\boldsymbol{E}\times \boldsymbol{B}$ drift theory are not strictly fulfilled. The agreement observed between the experimental results and the computed drift velocity calls for the application of the fluid drift theory, although its validity should be confirmed from kinetic or PIC simulations in the presence of collisions.
5. Discussion: 2-K configuration and influence of the central anode
5.1. Azimuthal dependence of the plasma flow in the 2-K configuration
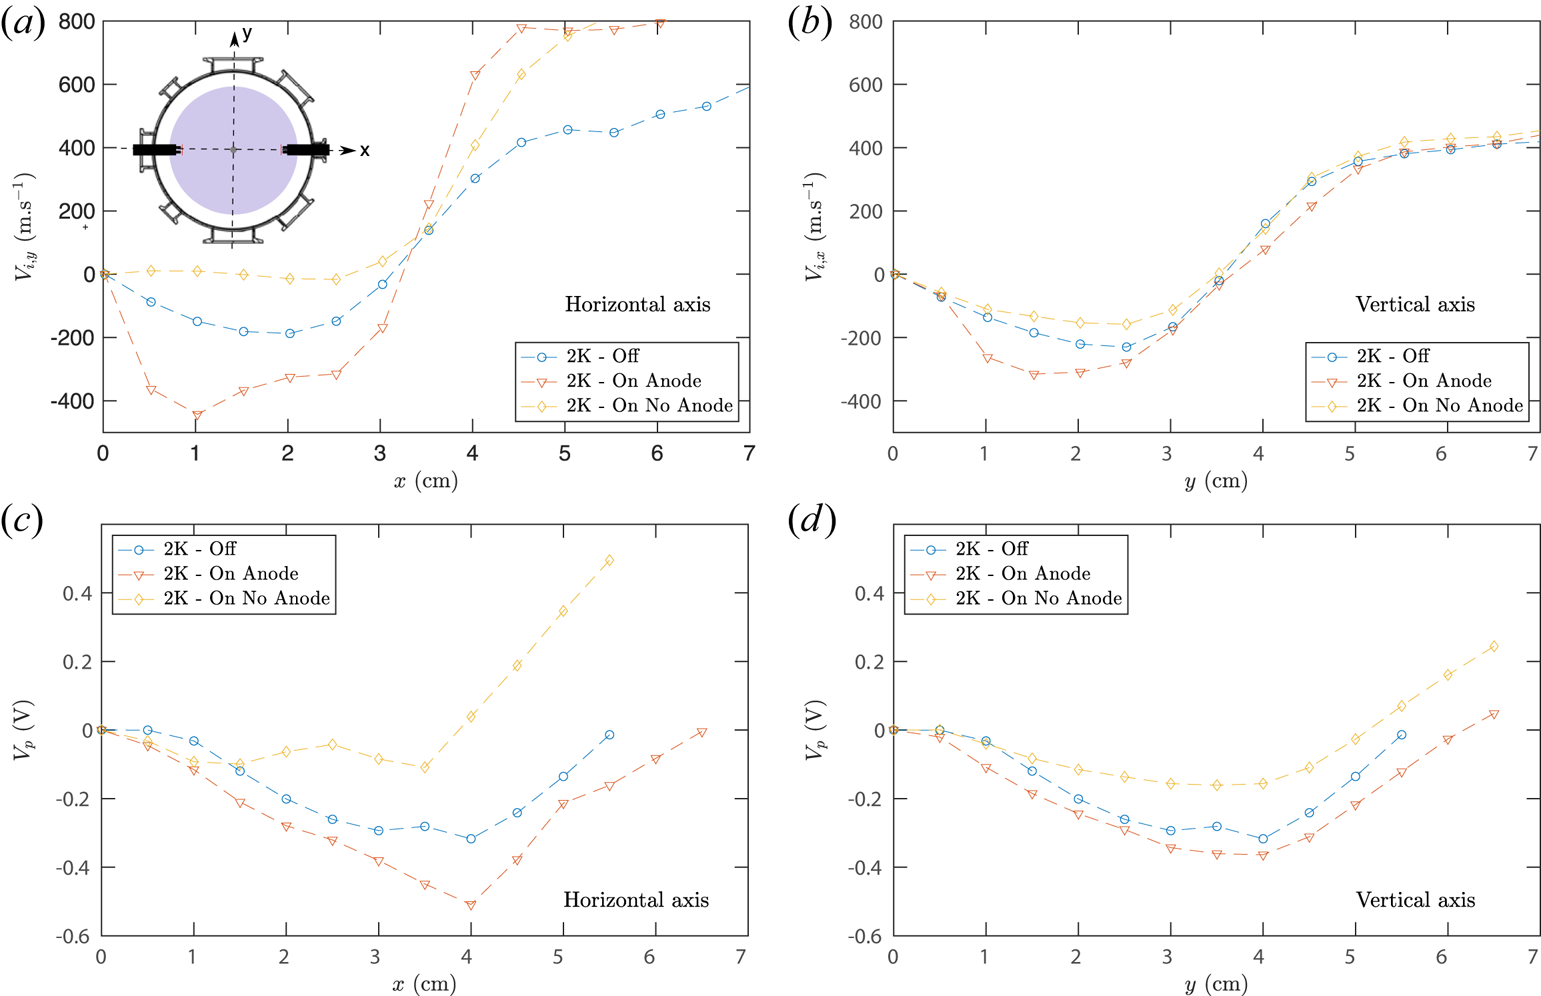
Diametral profiles of the ion velocity and of the plasma potential measured along the horizontal axis and the vertical axis are displayed figure 6 for several conditions in the presence of two cathodes, inserted in the horizontal plane at location $z = 16\ \textrm {cm}$ . As the central symmetry is preserved, the symmetrization procedure was applied to the measurements. The reference case, referred to as 2K-Off, consists of two hot unbiased cathodes in the presence of an anode in the centre and is displayed using blue bullets. The 2-K configuration introduced in the previous sections, with two hot, negatively biased cathodes, in the presence of a central grounded anode is shown using red lower triangles and is labelled in this section 2K-On Anode. In the central part of the column (i.e. radial positions lower than 5 cm), the velocity profiles are of similar amplitude along the vertical and horizontal axes. The first observation is that, for the 2K-On Anode case, a counter-clockwise flow larger than the 2K-Off reference case is observed in the central part, along both axes. Although the cathodes are inserted in the horizontal plane, they are efficient in driving an azimuthal flow everywhere in the plasma column. However, the central counter-clockwise velocity peak increases from $200\ \textrm {m}\ \textrm {s}^{-1}$
 in the 2K-Off reference case to approximately $400\ \textrm {m}\ \textrm {s}^{-1}$
 on the horizontal axis and to only $300\ \textrm {m}\ \textrm {s}^{-1}$
 on the vertical axis in the 2K-On Anode case. The increase in plasma velocity due to current injection being higher in the horizontal plane than in the vertical plane, axisymmetry is broken under this current injection geometry. As for the 0-K and 1-K configurations discussed before, the features of the flow are consistent with a strongly damped $E\times B$
 flow and with the measurements of the plasma potential shown in the lower panels of figure 6. The central plasma potential gradient increases from $7.6\ \textrm {V}\ \textrm {m}^{-1}$
 in the 2K-Off reference case to $12.5\ \textrm {V}\ \textrm {m}^{-1}$
 along the horizontal axis and only to $8.75\ \textrm {V}\ \textrm {m}^{-1}$
 along the vertical axis in the 2K-On Anode case. Similarly to the observations made in § 4, a large increase in the plasma velocity at large radius is observed only on the horizontal axis, whose origin may speculatively be attributed to the presence of the large cathode shafts along the horizontal axis.

Figure 6. (a,c) Horizontal and (b,d) vertical scans of the (a,b) ion velocity and (c,d) plasma potential for the three cases in the presence of two cathodes. The cathodes were biased to $-27$ V and emitting 10 A (5 A per cathode) for the anode and no anode cases. See text for details.
The radial location of null electric field corresponds to the radial location at which the azimuthal velocity is zero. Due the coil positions and the ripple of the magnetic field lines in our experiment, the magnetic field line crossing $r= 3\ \textrm {cm}$ at the cathode plane ($z =16\ \textrm {cm}$
 ) crosses $r = 3.8\ \textrm {cm}$
 at the measurement plane ($z = 49\ \textrm {cm}$
 ). However, the assumption that plasma parameters remain invariant along a magnetic field line does not strictly hold (the plasma parameters at $(r,z) = (3,16)\ \textrm {cm}$
 correspond to those at $(r,z) = (3.5,49)\ \textrm {cm}$
 ). We thus expect a minimum for the plasma potential for radius around 3.5 cm, which is in fairly good agreement with the data shown in figure 6.
5.2. Influence of the central anode on the flow
The ion velocity and plasma potential profiles in the presence of two hot biased cathodes in the absence of an anode are also shown in figure 6 as yellow diamonds, and referred to as 2K-On No Anode. In this case, all the current emitted by the cathodes is collected at the grounded vessel, while 30 % is collected at the central anode in the 2K-On Anode configuration. The first observation is that ion flow in the 2K-On No Anode case is strongly reduced in the central part of the plasma column (at radial positions below $\sim$ 3.5 cm) as compared with the 2K-Off reference case, along both the vertical and horizontal axes. Once again, the flow features are in good agreement with the plasma potential profiles. In particular, the plasma potential profile is strongly flattened along the horizontal axis. For radial location larger than 4 cm, the effect of the central anode is weaker. The effect of the central anode can be interpreted as follows: the current of the primary electron beam emitted by the cathodes is balanced by (i) an ion current directed inward from the grounded vessel, at radii larger than 3.5 cm, and (ii) an ion current directed outward from the anode, at radii lower than 3.5 cm, leading to local minimum of the plasma potential around 3.5 cm. In the absence of the anode, only the first contribution of the current leads to the modification of the electric field and of the flow.
In the 1-K configuration, the cathode is located at the centre of the plasma column and the current emitted by the cathode is collected at the grounded vessel walls. Since the primary electron beam is strongly magnetized, the global radial current flow likely consists of an ion flow. This leads to a local minimum of plasma potential at the centre of the column (see figure 5). We also investigated a configuration for which a grounded anode was inserted in the centre of the plasma column at location $z = 70\ \textrm {cm}$ . In this configuration, 40 % of the current was collected at the anode. Surprisingly, for the same current driven by the cathode, the differences measured for the velocity profile and for the plasma potential profile (not shown) in the presence or the absence of the central anode remain lower than the uncertainty of the measurements. The authors believe that more detailed spatial measurements of the plasma potential and modelling are required to provide a detailed understanding of these results.
6. Conclusions
Current injection from large emissive cathodes, over a background weakly magnetized plasma column generated by a r.f. source, was demonstrated to be an efficient way to control the rotation profile and rotation shear of the ion flow. In the range of plasma parameters investigated in the present article, we show that the azimuthal ion flow is effectively controlled by the local electric drift damped by a drag exerted on the ions. The large negative bias of the large emissive cathodes strongly modifies the local plasma potential, and their operation was found to follow a modified thermionic emission law, allowing us to precisely control the amount of injected current. This injected current strongly modifies all plasma parameters, and in particular the plasma potential profile. We showed that the plasma potential profile can be continuously modified by current injection – this allows us to continuously control the rotation profile of the ion flow, and the natural background plasma rotation may be reversed or enhanced depending upon the location of the emissive cathodes and the intensity of the injected current. Two physical effects contribute to the damping of the flow on nearly equal grounds: the ion–neutral charge exchange collisions, and also the creation of ions from volume ionization. The efficiency of the ion stirring using emissive cathodes could be increased at lower base pressure, thus requiring the design of an optimized r.f. source to create high density plasmas below the mTorr range. This work also calls for predicting the capabilities of the equilibrium plasma parameter when locally injecting current in order to better understand the driving mechanisms, for instance extending the recent works done for magnetized plasmas to moderately magnetized plasmas (Gueroult et al. Reference Gueroult, Rax and Fisch2019; Poulos Reference Poulos2019; Liziakin et al. Reference Liziakin, Gavrikov and Smirnov2020). Beyond the present investigations in quiescent regimes, the influence of large-scale, low-frequency fluctuations of the plasma parameters usually observed in plasma columns on the efficiency of the plasma flow drive is also a crucial question related to the self-organization in plasmas.
Acknowledgements
The authors are grateful to M. Moulin and M. Tanase for technical support and thank T. Carter, C. Forest and D. Weisberg for fruitful discussions.
Editor Cary Forest thanks the referees for their advice in evaluating this article.
Funding
This work was supported by French National Research Agency under contract ANR-13-JS04-0003-01.
Declaration of interests
The authors report no conflict of interest.
Data availability statement
The data that support the findings are available upon reasonable request from the corresponding author.
Author contributions
V.D and G.B. performed the experiments, V.D, G.B, A.P. and N.P. contributed to analysing data and reaching conclusion. V.D. and N.P. wrote the paper.