


1 Introduction
Laser wakefield accelerators (LWFAs), which could sustain extreme field gradients of the order of
 $100~\text{GV}~\text{m}^{-1}$
, are promising as compact sources of ultrashort e-bunches (Tajima & Dawson Reference Tajima and Dawson1979; Lu et al.
Reference Lu, Liu, Wang, Wang, Liu, Deng, Xu, Xia, Li and Zhang2011; Liu et al.
Reference Liu, Xia, Wang, Lu, Wang, Deng, Li, Zhang, Liang and Leng2011; Kim et al.
Reference Kim, Pae, Cha, Kim, Yu, Sung, Lee, Jeong and Lee2013; Wang et al.
Reference Wang, Li, Liu, Wang, Chen, Zhang, Qi, Leng, Liang and Liu2013a
,Reference Wang, Zgadzaj, Fazel, Li, Yi, Zhang, Henderson, Chang, Korzekwa and Tsai
b
; Leemans et al.
Reference Leemans, Gonsalves, Mao, Nakamura, Benedetti, Schroeder, Th, Daniels, Mittelberger and Bulanov2014). By applying new techniques to control the injection or the acceleration processes of a LWFA (Faure et al.
Reference Faure, Rechatin, Norlin, Lifschitz, Glinec and Malka2006; Oz et al.
Reference Oz, Deng, Katsouleas, Muggli, Barnes, Blumenfeld, Decker, Emma, Hogan and Ischebeck2007; Geddes et al.
Reference Geddes, Nakamura, Plateau, Toth, Cormier-Michel, Esarey, Schroeder, Cary and Leemans2008; Rechatin et al.
Reference Rechatin, Faure, Ben-Ismail, Lim, Fitour, Specka, Videau, Tafzi, Burgy and Malka2009b
; Faure et al.
Reference Faure, Rechatin, Lundh, Ammoura and Malka2010; Pak et al.
Reference Pak, Marsh, Martins, Lu, Mori and Joshi2010; Gonsalves et al.
Reference Gonsalves, Nakamura, Lin, Panasenko, Shiraishi, Sokollik, Benedetti, Schroeder, Geddes and Van Tilborg2011; Bourgeois, Cowley & Hooker Reference Bourgeois, Cowley and Hooker2013; Xi et al.
Reference Xi, Hidding, Bruhwiler, Pretzler and Rosenzweig2013; Buck et al.
Reference Buck, Wenz, Xu, Khrennikov, Schmid, Heigoldt, Mikhailova, Geissler, Shen and Krausz2013; Litos et al.
Reference Litos, Adli, An, Clarke, Clayton, Corde, Delahaye, England, Fisher and Frederico2014; Zhang et al.
Reference Zhang, Liu, Wang, Li, Yu, Tian, Qi, Wang, Qin and Fang2015; Zeng et al.
Reference Zeng, Chen, Yu, Mori, Sheng, Hidding, Jaroszynski and Zhang2015; Liu et al.
Reference Liu, Xia, Wang, Lu, Wang, Deng, Li, Zhang, Liang and Leng2011; Pollock et al.
Reference Pollock, Clayton, Ralph, Albert, Davidson, Divol, Filip, Glenzer, Herpoldt and Lu2011; Steinke et al.
Reference Steinke, Van Tilborg, Benedetti, Geddes, Schroeder, Daniels, Swanson, Gonsalves, Nakamura and Matlis2016), remarkable progress has been made for quasi-monoenergetic and high energy (several GeV) e-bunch generation. Whereas for applications such as ultrashort
$100~\text{GV}~\text{m}^{-1}$
, are promising as compact sources of ultrashort e-bunches (Tajima & Dawson Reference Tajima and Dawson1979; Lu et al.
Reference Lu, Liu, Wang, Wang, Liu, Deng, Xu, Xia, Li and Zhang2011; Liu et al.
Reference Liu, Xia, Wang, Lu, Wang, Deng, Li, Zhang, Liang and Leng2011; Kim et al.
Reference Kim, Pae, Cha, Kim, Yu, Sung, Lee, Jeong and Lee2013; Wang et al.
Reference Wang, Li, Liu, Wang, Chen, Zhang, Qi, Leng, Liang and Liu2013a
,Reference Wang, Zgadzaj, Fazel, Li, Yi, Zhang, Henderson, Chang, Korzekwa and Tsai
b
; Leemans et al.
Reference Leemans, Gonsalves, Mao, Nakamura, Benedetti, Schroeder, Th, Daniels, Mittelberger and Bulanov2014). By applying new techniques to control the injection or the acceleration processes of a LWFA (Faure et al.
Reference Faure, Rechatin, Norlin, Lifschitz, Glinec and Malka2006; Oz et al.
Reference Oz, Deng, Katsouleas, Muggli, Barnes, Blumenfeld, Decker, Emma, Hogan and Ischebeck2007; Geddes et al.
Reference Geddes, Nakamura, Plateau, Toth, Cormier-Michel, Esarey, Schroeder, Cary and Leemans2008; Rechatin et al.
Reference Rechatin, Faure, Ben-Ismail, Lim, Fitour, Specka, Videau, Tafzi, Burgy and Malka2009b
; Faure et al.
Reference Faure, Rechatin, Lundh, Ammoura and Malka2010; Pak et al.
Reference Pak, Marsh, Martins, Lu, Mori and Joshi2010; Gonsalves et al.
Reference Gonsalves, Nakamura, Lin, Panasenko, Shiraishi, Sokollik, Benedetti, Schroeder, Geddes and Van Tilborg2011; Bourgeois, Cowley & Hooker Reference Bourgeois, Cowley and Hooker2013; Xi et al.
Reference Xi, Hidding, Bruhwiler, Pretzler and Rosenzweig2013; Buck et al.
Reference Buck, Wenz, Xu, Khrennikov, Schmid, Heigoldt, Mikhailova, Geissler, Shen and Krausz2013; Litos et al.
Reference Litos, Adli, An, Clarke, Clayton, Corde, Delahaye, England, Fisher and Frederico2014; Zhang et al.
Reference Zhang, Liu, Wang, Li, Yu, Tian, Qi, Wang, Qin and Fang2015; Zeng et al.
Reference Zeng, Chen, Yu, Mori, Sheng, Hidding, Jaroszynski and Zhang2015; Liu et al.
Reference Liu, Xia, Wang, Lu, Wang, Deng, Li, Zhang, Liang and Leng2011; Pollock et al.
Reference Pollock, Clayton, Ralph, Albert, Davidson, Divol, Filip, Glenzer, Herpoldt and Lu2011; Steinke et al.
Reference Steinke, Van Tilborg, Benedetti, Geddes, Schroeder, Daniels, Swanson, Gonsalves, Nakamura and Matlis2016), remarkable progress has been made for quasi-monoenergetic and high energy (several GeV) e-bunch generation. Whereas for applications such as ultrashort
 $x$
- and
$x$
- and
 $\unicode[STIX]{x1D6FE}$
-ray sources from Compton scattering, wiggler or novel free electron laser schemes (Jaroszynski et al.
Reference Jaroszynski, Bingham, Brunetti, Ersfeld, Gallacher, Van Der Geer, Issac, Jamison, Jones and De Loos2006; Schwoerer et al.
Reference Schwoerer, Liesfeld, Schlenvoigt, Amthor and Sauerbrey2006; Schlenvoigt et al.
Reference Schlenvoigt, Haupt, Debus, Budde, Ckel, Pfotenhauer, Schwoerer, Rohwer, Gallacher and Brunetti2007; Fuchs et al.
Reference Fuchs, Weingartner, Popp, Major, Becker, Osterhoff, Cortrie, Zeitler, Horlein and Tsakiris2009; Huang, Ding & Schroeder Reference Huang, Ding and Schroeder2012; Phuoc et al.
Reference Phuoc, Corde, Thaury, Malka, Tafzi, Goddet, Shah, Sebban and Rousse2012; Chen et al.
Reference Chen, Powers, Ghebregziabher, Maharjan, Liu, Golovin, Banerjee, Zhang, Cunningham and Moorti2013; Powers et al.
Reference Powers, Ghebregziabher, Golovin, Liu, Chen, Banerjee, Zhang and Umstadter2014), the e-bunch quality and stability still need to be improved.
$\unicode[STIX]{x1D6FE}$
-ray sources from Compton scattering, wiggler or novel free electron laser schemes (Jaroszynski et al.
Reference Jaroszynski, Bingham, Brunetti, Ersfeld, Gallacher, Van Der Geer, Issac, Jamison, Jones and De Loos2006; Schwoerer et al.
Reference Schwoerer, Liesfeld, Schlenvoigt, Amthor and Sauerbrey2006; Schlenvoigt et al.
Reference Schlenvoigt, Haupt, Debus, Budde, Ckel, Pfotenhauer, Schwoerer, Rohwer, Gallacher and Brunetti2007; Fuchs et al.
Reference Fuchs, Weingartner, Popp, Major, Becker, Osterhoff, Cortrie, Zeitler, Horlein and Tsakiris2009; Huang, Ding & Schroeder Reference Huang, Ding and Schroeder2012; Phuoc et al.
Reference Phuoc, Corde, Thaury, Malka, Tafzi, Goddet, Shah, Sebban and Rousse2012; Chen et al.
Reference Chen, Powers, Ghebregziabher, Maharjan, Liu, Golovin, Banerjee, Zhang, Cunningham and Moorti2013; Powers et al.
Reference Powers, Ghebregziabher, Golovin, Liu, Chen, Banerjee, Zhang and Umstadter2014), the e-bunch quality and stability still need to be improved.
In many previous simulation works (Tsung et al. Reference Tsung, Narang, Mori, Joshi, Fonseca and Silva2004; Kalmykov et al. Reference Kalmykov, Beck, Yi, Khudik, Downer, Lefebvre, Shadwick and Umstadter2011, Reference Kalmykov, Davoine, Lehe, Lifschitz and Shadwick2015), the phase space rotation of the e-bunch due to the gradient acceleration field in a plasma-based accelerator was used for energy spread reduction, generating e-bunches with high energy and low energy spread. In some schemes, the plasma density and the bunch phase were operated carefully to attain precise control over the phase space rotation, then a controllable energy chirp compensation or energy spread mitigation could be fulfilled at a desired energy (Brinkmann et al. Reference Brinkmann, Delbos, Dornmair, Kirchen, Assmann, Behrens, Floettmann, Grebenyuk, Gross and Jalas2017; Manahan et al. Reference Manahan, Habib, Scherkl, Delinikolas, Beaton, Knetsch, Karger, Wittig, Heinemann and Sheng2017). On the other hand, the rotation could be suppressed by flattening the wakefield with a proper tailing beam loading (Tzoufras et al. Reference Tzoufras, Lu, Tsung, Huang, Mori, Katsouleas, Vieira, Fonseca and Silva2008; Litos et al. Reference Litos, Adli, An, Clarke, Clayton, Corde, Delahaye, England, Fisher and Frederico2014). In our previous work (Zhang et al. Reference Zhang, Li, Liu, Wang, Yu, Tian, Nakajima, Deng, Qi and Wang2016), the phase space rotation was applied to compress the longitudinal distribution of the bunch for a more efficient energy spread minimization. Since the rotation is strongly correlated with the wakefield characteristics and the bunch phase space distribution, it is meaningful to explore the rotation process both in theory and experiment.
Here in this paper, we investigate the phase space rotation of e bunches in a LWFA, which is in the nonlinear regime with a negligible beam loading effect, by altering the acceleration length (plasma length) experimentally, and present valid estimations of the wake characteristic parameters (longitudinal dispersion and slope) and the bunch length via the measured energy spectra. The resulting energy spread compensation at the beginning of acceleration was obtained. Three-dimensional (3-D) particle-in-cell (PIC) simulations show that the energy spread of an e-bunch evolves as a result of phase space rotation in the gradient wakefield, and the energy spread of an e-bunch with proper energy chirp could be compensated while being accelerated. The correlations of the bunch parameters (length, energy, energy spread) and the wake parameters are analysed in a phenomenological way, applied in our experiments for wake and bunch parameters estimation, and the results are proven to be credible. The discrepancies between the theory and experiment are also discussed.

Figure 1. Schematic of e-bunch phase space rotation in a LWFA. (a) The slippages of the e-bunch with respect to the plasma wake driven by a laser pulse with different propagation times (
 $t_{1}$
,
$t_{1}$
,
 $t_{2}$
,
$t_{2}$
,
 $t_{3}$
). (b) The wakefield on axis in the ion cavity and the wakefield dispersion
$t_{3}$
). (b) The wakefield on axis in the ion cavity and the wakefield dispersion
 $\unicode[STIX]{x0394}E_{x}$
for the e bunch. (c) The corresponding energy distribution and energy spectrum for the e-bunch at different times.
$\unicode[STIX]{x0394}E_{x}$
for the e bunch. (c) The corresponding energy distribution and energy spectrum for the e-bunch at different times.
2 Phenomenological description of the wake and e-bunch in a LWFA
Firstly, we give a phenomenological description of the phase space rotation of an e-bunch accelerated in a LWFA, and discuss the simplified correlations of the bunch parameters and the wake parameters. As shown in figure 1, the plasma wake is driven by the intense laser pulse while it enters an underdense plasma. In a nonlinear case, the acceleration field could be regarded as a linear gradient field along the propagation direction (Kostyukov, Pukhov & Kiselev Reference Kostyukov, Pukhov and Kiselev2004; Lu et al.
Reference Lu, Tzoufras, Joshi, Tsung, Mori, Vieira, Fonseca and Silva2007), and an e-bunch with longitudinal length of
 $l_{b}$
accelerated in such a field would experience a field dispersion
$l_{b}$
accelerated in such a field would experience a field dispersion
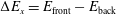 $\unicode[STIX]{x0394}E_{x}=E_{\text{front}}-E_{\text{back}}$
, where
$\unicode[STIX]{x0394}E_{x}=E_{\text{front}}-E_{\text{back}}$
, where
 $E_{\text{front}}$
(
$E_{\text{front}}$
(
 $E_{\text{back}}$
) denotes the electric field at the front (back) of the e bunch. The field dispersion could also be expressed as
$E_{\text{back}}$
) denotes the electric field at the front (back) of the e bunch. The field dispersion could also be expressed as
 $\unicode[STIX]{x0394}E_{x}=E^{\prime }l_{b}$
, where
$\unicode[STIX]{x0394}E_{x}=E^{\prime }l_{b}$
, where
 $E^{\prime }$
presents the wakefield slope. The phase space of the e-bunch would rotate in such a field and its energy spectrum evolves simultaneously, as shown in figure 1(c). Unlike in a plasma wake driven by a charged particle beam, the relativistic e-bunch accelerated in a LWFA would undergo dephasing because the group velocity of the laser pulse in the plasma is lower than the velocity of the e-bunch. Thus, the e-bunch would slip forward with respect to the wakefield, as shown in figure 1(a). The phase velocity of the plasma wave is
$E^{\prime }$
presents the wakefield slope. The phase space of the e-bunch would rotate in such a field and its energy spectrum evolves simultaneously, as shown in figure 1(c). Unlike in a plasma wake driven by a charged particle beam, the relativistic e-bunch accelerated in a LWFA would undergo dephasing because the group velocity of the laser pulse in the plasma is lower than the velocity of the e-bunch. Thus, the e-bunch would slip forward with respect to the wakefield, as shown in figure 1(a). The phase velocity of the plasma wave is
 $v_{p}\approx c[1{-}3\unicode[STIX]{x1D714}_{p}^{2}/(2\unicode[STIX]{x1D714}_{0}^{2})]$
(Lu et al.
Reference Lu, Tzoufras, Joshi, Tsung, Mori, Vieira, Fonseca and Silva2007), where
$v_{p}\approx c[1{-}3\unicode[STIX]{x1D714}_{p}^{2}/(2\unicode[STIX]{x1D714}_{0}^{2})]$
(Lu et al.
Reference Lu, Tzoufras, Joshi, Tsung, Mori, Vieira, Fonseca and Silva2007), where
 $c$
is the light speed in vacuum,
$c$
is the light speed in vacuum,
 $\unicode[STIX]{x1D714}_{p}$
is the plasma frequency and
$\unicode[STIX]{x1D714}_{p}$
is the plasma frequency and
 $\unicode[STIX]{x1D714}_{0}$
denotes the laser frequency. The slippage distance
$\unicode[STIX]{x1D714}_{0}$
denotes the laser frequency. The slippage distance
 $l_{s12}$
(
$l_{s12}$
(
 $t_{1}$
to
$t_{1}$
to
 $t_{2}$
),
$t_{2}$
),
 $l_{s23}$
(
$l_{s23}$
(
 $t_{2}$
to
$t_{2}$
to
 $t_{3}$
) after a corresponding acceleration length of
$t_{3}$
) after a corresponding acceleration length of
 $l_{a12}$
(
$l_{a12}$
(
 $t_{1}$
to
$t_{1}$
to
 $t_{2}$
),
$t_{2}$
),
 $l_{a23}$
(
$l_{a23}$
(
 $t_{2}$
to
$t_{2}$
to
 $t_{3}$
) can therefore be expressed as
$t_{3}$
) can therefore be expressed as
 $$\begin{eqnarray}\displaystyle & \displaystyle l_{s12}=l_{a12}\left(1-\frac{v_{p}}{c}\right)\approx \frac{3\unicode[STIX]{x1D714}_{p}^{2}}{2\unicode[STIX]{x1D714}_{0}^{2}}l_{a12}, & \displaystyle\end{eqnarray}$$
 $$\begin{eqnarray}\displaystyle & \displaystyle l_{s23}=l_{a23}\left(1-\frac{v_{p}}{c}\right)\approx \frac{3\unicode[STIX]{x1D714}_{p}^{2}}{2\unicode[STIX]{x1D714}_{0}^{2}}l_{a23}. & \displaystyle\end{eqnarray}$$
Inevitably, the bunch slippage would lead to a change of the acceleration field that the e-bunch witnesses, as shown in figure 1(b). For simplification, the deformation of the ion cavities during acceleration is neglected so that
 $E^{\prime }$
is a constant. Then, the wakefield slope
$E^{\prime }$
is a constant. Then, the wakefield slope
 $E^{\prime }$
could be deduced from the acceleration field variation together with the corresponding slippage distance,
$E^{\prime }$
could be deduced from the acceleration field variation together with the corresponding slippage distance,
 $$\begin{eqnarray}\displaystyle E^{\prime }\approx \frac{E_{3}-E_{1}}{l_{s12}+l_{s23}}=2\frac{(E_{3}+E_{2})/2-(E_{1}+E_{2})/2}{l_{s12}+l_{s23}}, & & \displaystyle\end{eqnarray}$$
where
 $E_{1}$
,
$E_{1}$
,
 $E_{2}$
and
$E_{2}$
and
 $E_{3}$
, which determine the evolution of the e-bunch’s peak energy
$E_{3}$
, which determine the evolution of the e-bunch’s peak energy
 $\unicode[STIX]{x1D700}_{p}$
, are the acceleration fields that the density peak of the e-bunch witnesses, as shown in figure 1(b). The average acceleration field, which is defined as the mean value of the electric field the e-bunch witnesses during the acceleration process, could be estimated from the variation of the peak energy
$\unicode[STIX]{x1D700}_{p}$
, are the acceleration fields that the density peak of the e-bunch witnesses, as shown in figure 1(b). The average acceleration field, which is defined as the mean value of the electric field the e-bunch witnesses during the acceleration process, could be estimated from the variation of the peak energy
 $$\begin{eqnarray}\displaystyle & \displaystyle \bar{E}_{12}=-\frac{\unicode[STIX]{x1D700}_{p2}-\unicode[STIX]{x1D700}_{p1}}{el_{a12}}\approx \frac{E_{1}+E_{2}}{2}, & \displaystyle\end{eqnarray}$$
 $$\begin{eqnarray}\displaystyle & \displaystyle \bar{E}_{23}=-\frac{\unicode[STIX]{x1D700}_{p3}-\unicode[STIX]{x1D700}_{p2}}{el_{a23}}\approx \frac{E_{2}+E_{3}}{2}, & \displaystyle\end{eqnarray}$$
 $\unicode[STIX]{x1D700}_{p1}$
,
$\unicode[STIX]{x1D700}_{p1}$
,
 $\unicode[STIX]{x1D700}_{p2}$
and
$\unicode[STIX]{x1D700}_{p2}$
and
 $\unicode[STIX]{x1D700}_{p3}$
are the corresponding peak energy of the e-bunch at
$\unicode[STIX]{x1D700}_{p3}$
are the corresponding peak energy of the e-bunch at
 $t_{1}$
,
$t_{1}$
,
 $t_{2}$
and
$t_{2}$
and
 $t_{3}$
,
$t_{3}$
,
 $e$
is the elementary charge.
$e$
is the elementary charge. On the other hand, the energy spread evolution is available from the detected energy spectra, and then
 $\unicode[STIX]{x0394}E_{x}$
can be estimated. Since the injected e-bunch is negatively chirped (lower energy at the tail), an e-bunch in a wakefield with
$\unicode[STIX]{x0394}E_{x}$
can be estimated. Since the injected e-bunch is negatively chirped (lower energy at the tail), an e-bunch in a wakefield with
 $\unicode[STIX]{x0394}E_{x}<0$
will undergo energy chirp compensation at the beginning of acceleration and consequently the energy spread is compensated. After the energy chirp compensation, the energy chirp of the e-bunch would be inverted and the energy spread would be enlarged, thus a broader spectrum would be measured, as shown in figure 1(c). We define energy spread
$\unicode[STIX]{x0394}E_{x}<0$
will undergo energy chirp compensation at the beginning of acceleration and consequently the energy spread is compensated. After the energy chirp compensation, the energy chirp of the e-bunch would be inverted and the energy spread would be enlarged, thus a broader spectrum would be measured, as shown in figure 1(c). We define energy spread
 $\unicode[STIX]{x0394}\unicode[STIX]{x1D700}$
as
$\unicode[STIX]{x0394}\unicode[STIX]{x1D700}$
as
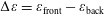
 $\unicode[STIX]{x0394}\unicode[STIX]{x1D700}=\unicode[STIX]{x1D700}_{\text{front}}-\unicode[STIX]{x1D700}_{\text{back}}$
, then the wakefield dispersion for the e bunch could also be expressed as
$\unicode[STIX]{x0394}\unicode[STIX]{x1D700}=\unicode[STIX]{x1D700}_{\text{front}}-\unicode[STIX]{x1D700}_{\text{back}}$
, then the wakefield dispersion for the e bunch could also be expressed as
 $$\begin{eqnarray}\displaystyle \unicode[STIX]{x0394}E_{x}\approx \frac{\unicode[STIX]{x0394}\unicode[STIX]{x1D700}_{1}-\unicode[STIX]{x0394}\unicode[STIX]{x1D700}_{3}}{e(l_{a12}+l_{a23})}, & & \displaystyle\end{eqnarray}$$
where
 $\unicode[STIX]{x0394}\unicode[STIX]{x1D700}_{1}$
,
$\unicode[STIX]{x0394}\unicode[STIX]{x1D700}_{1}$
,
 $\unicode[STIX]{x0394}\unicode[STIX]{x1D700}_{2}$
and
$\unicode[STIX]{x0394}\unicode[STIX]{x1D700}_{2}$
and
 $\unicode[STIX]{x0394}\unicode[STIX]{x1D700}_{3}$
are the energy spread of the e-bunch at different times. By integrating the above equations together with
$\unicode[STIX]{x0394}\unicode[STIX]{x1D700}_{3}$
are the energy spread of the e-bunch at different times. By integrating the above equations together with
 $\unicode[STIX]{x0394}E_{x}=E^{\prime }l_{b}$
, we can estimate the e-bunch length as
$\unicode[STIX]{x0394}E_{x}=E^{\prime }l_{b}$
, we can estimate the e-bunch length as
 $$\begin{eqnarray}\displaystyle l_{b}\approx \frac{3\unicode[STIX]{x1D714}_{p}^{2}}{4\unicode[STIX]{x1D714}_{0}^{2}}\frac{(\unicode[STIX]{x0394}\unicode[STIX]{x1D700}_{1}-\unicode[STIX]{x0394}\unicode[STIX]{x1D700}_{3})l_{a12}l_{a23}}{(\unicode[STIX]{x1D700}_{p2}-\unicode[STIX]{x1D700}_{p3})l_{a12}-(\unicode[STIX]{x1D700}_{p1}-\unicode[STIX]{x1D700}_{p2})l_{a23}}. & & \displaystyle\end{eqnarray}$$
3 Experimental results

Figure 2. Schematic of the experimental set up. (a) The transverse intensity distribution of the laser pulse at the focus, the spot size is measured as
 $32~\unicode[STIX]{x03BC}\text{m}$
at FWHM. (b) A typical spectrum for e-bunch detected from the spectrometer.
$32~\unicode[STIX]{x03BC}\text{m}$
at FWHM. (b) A typical spectrum for e-bunch detected from the spectrometer.
Figure 2 shows the experimental set up. Pulses from a high-repetition 200 TW Ti:sapphire (Xu et al.
Reference Xu, Lu, Li, Wu, Li, Wang, Li, Lu, Liu and Leng2016) laser facility (800 nm, 33 fs, 80–90 TW on target) are focused into the gas by an
 $f/30$
off-axis paraboloid mirror, and the full width at half-maximum (FWHM) spot size of was measured to be
$f/30$
off-axis paraboloid mirror, and the full width at half-maximum (FWHM) spot size of was measured to be
 $w_{\text{FWHM}}=32~\unicode[STIX]{x03BC}\text{m}$
in vacuum. The fractional laser energy contained within the laser spot was measured to be
$w_{\text{FWHM}}=32~\unicode[STIX]{x03BC}\text{m}$
in vacuum. The fractional laser energy contained within the laser spot was measured to be
 ${\sim}$
60 % at
${\sim}$
60 % at
 $1/\text{e}^{2}$
, and the normalized amplitude was estimated to be
$1/\text{e}^{2}$
, and the normalized amplitude was estimated to be
 $a_{0}\approx 1.2$
. The target was manipulated by a pulsed gas jet with an attached plate, the diameter of the jet is 1.5 mm. A wedge-roof block with a thickness of 0.8 mm, which was connected to a motorized precision translation stage to alter the distance from the block to the plate, could split the gas to the sides so that the plasma length could be controlled. Both the plate and the block were designed with a hole of radius of
$a_{0}\approx 1.2$
. The target was manipulated by a pulsed gas jet with an attached plate, the diameter of the jet is 1.5 mm. A wedge-roof block with a thickness of 0.8 mm, which was connected to a motorized precision translation stage to alter the distance from the block to the plate, could split the gas to the sides so that the plasma length could be controlled. Both the plate and the block were designed with a hole of radius of
 $250~\unicode[STIX]{x03BC}\text{m}$
to let the laser pass. The plasma density profiles were measured using a probe pulse, which is split from the main pulse, directed perpendicularly through the gas jet to a Michelson-type interferometer. The gas jet was filled with pure He atoms, and the plasma density was measured to be approximately
$250~\unicode[STIX]{x03BC}\text{m}$
to let the laser pass. The plasma density profiles were measured using a probe pulse, which is split from the main pulse, directed perpendicularly through the gas jet to a Michelson-type interferometer. The gas jet was filled with pure He atoms, and the plasma density was measured to be approximately
 $1.0\times 10^{19}~\text{cm}^{-3}$
with an accuracy of
$1.0\times 10^{19}~\text{cm}^{-3}$
with an accuracy of
 $\pm$
6 % after being totally ionized (Zhou et al.
Reference Zhou, Liu, Lu, Wang, Ju, Wang, Xia, Wang, Deng and Xu2010; Wang et al.
Reference Wang, Li, Liu, Wang, Chen, Zhang, Qi, Leng, Liang and Liu2013a
), as shown in figure 3(a,b).
$\pm$
6 % after being totally ionized (Zhou et al.
Reference Zhou, Liu, Lu, Wang, Ju, Wang, Xia, Wang, Deng and Xu2010; Wang et al.
Reference Wang, Li, Liu, Wang, Chen, Zhang, Qi, Leng, Liang and Liu2013a
), as shown in figure 3(a,b).

Figure 3. The snapshots of the measured interferogram (a) and the corresponding plasma density profile with different
 $l$
(b). (c–e) Spectrometer images of ten shots for each of three different runs with different
$l$
(b). (c–e) Spectrometer images of ten shots for each of three different runs with different
 $l$
of 0.8 mm (c), 1.0 mm (d) and 1.2 mm (e) from the LWFA. (f) Average integrated lineout and root-mean-square (grey area) of these shots.
$l$
of 0.8 mm (c), 1.0 mm (d) and 1.2 mm (e) from the LWFA. (f) Average integrated lineout and root-mean-square (grey area) of these shots.
The electron spectra were measured by using a 13 cm long 1 T dipole magnet which is 32 cm downstream of the gas target to bend the electron trace, and then imaged on a LANEX phosphor screen captured by an intensified charge-coupled device (ICCD). The energy resolution of the magnet spectrometer, which is determined by the transverse profile of the e-bunch, was 1.6 % at 100 MeV. The uncertainty of the measured electron energy was estimated according to a shot-to-shot e-bunch divergence of 1.0 mrad, which is derived based on the standard deviation of the positions of the straight through reference shots when the magnet was removed, leading to an error of [2.1 MeV,
 $-$
1.6 MeV] at 100 MeV. The e-bunch charge was cross-calibrated by using a calibrated imaging plate (Bonnet et al.
Reference Bonnet, Comet, Denis-petit, Gobet, Hannachi, Tarisien, Versteegen and Aleonard2013). The uncertainty of the measured e-bunch charge was estimated to be within
$-$
1.6 MeV] at 100 MeV. The e-bunch charge was cross-calibrated by using a calibrated imaging plate (Bonnet et al.
Reference Bonnet, Comet, Denis-petit, Gobet, Hannachi, Tarisien, Versteegen and Aleonard2013). The uncertainty of the measured e-bunch charge was estimated to be within
 $\pm$
12 %. The spectra are cut off at around 20 MeV due to the imaging range limitation of the ICCD, and only the shots for which the charge deviation between the experiment and the corresponding Gaussian fitting are less than 20 % are selected.
$\pm$
12 %. The spectra are cut off at around 20 MeV due to the imaging range limitation of the ICCD, and only the shots for which the charge deviation between the experiment and the corresponding Gaussian fitting are less than 20 % are selected.
In the experiments, we altered the distance
 $l$
(from the block front edge to the attached plate) from 0.8 to 1.2 mm by adjusting the position of the wedge-roof block,
$l$
(from the block front edge to the attached plate) from 0.8 to 1.2 mm by adjusting the position of the wedge-roof block,
 $l$
was chosen to be much less than the depletion length (approximately 2.5 mm under the experimental condition) to avoid the disruption of the e-bunch longitudinal bunch profile (Heigoldt et al.
Reference Heigoldt, Popp, Khrennikov, Wenz, Chou, Karsch, Bajlekov, Hooker and Schmidt2015), and the generated electron spectra are shown in figure 3(c–f). Although no special injection control techniques like ionization or density transition were applied in our experiment, the generated e-bunches were quasi-monoenergetic. This might be attributable to the first self-injection at the very front of the plasma (Corde et al.
Reference Corde, Thaury, Lifschitz, Lambert, TA PHUOC, Davoine, Lehe, Douillet, Rousse and Malka2013), where the injection process was confined within a very limited time. Ten shots of e-bunch spectra for each of three runs with different
$l$
was chosen to be much less than the depletion length (approximately 2.5 mm under the experimental condition) to avoid the disruption of the e-bunch longitudinal bunch profile (Heigoldt et al.
Reference Heigoldt, Popp, Khrennikov, Wenz, Chou, Karsch, Bajlekov, Hooker and Schmidt2015), and the generated electron spectra are shown in figure 3(c–f). Although no special injection control techniques like ionization or density transition were applied in our experiment, the generated e-bunches were quasi-monoenergetic. This might be attributable to the first self-injection at the very front of the plasma (Corde et al.
Reference Corde, Thaury, Lifschitz, Lambert, TA PHUOC, Davoine, Lehe, Douillet, Rousse and Malka2013), where the injection process was confined within a very limited time. Ten shots of e-bunch spectra for each of three runs with different
 $l$
are shown in figure 3(c–e), and the statistical spectra parameters are listed in table 1, the errors are root-mean-square (r.m.s.) deviations from the average value. For the spectra in figure 3(f) and the data in table 1, the later injected bunches at low energy were first removed for the multi-bunch shots, and then the average was performed. Since the later injected e-bunches (Corde et al.
Reference Corde, Thaury, Lifschitz, Lambert, TA PHUOC, Davoine, Lehe, Douillet, Rousse and Malka2013) which are located behind have no influence on the acceleration of the first injected bunches, for the multi-bunch shots, the obtained e-bunches with a much broader spectrum at the low energy level were not counted. The increase of the peak energy
$l$
are shown in figure 3(c–e), and the statistical spectra parameters are listed in table 1, the errors are root-mean-square (r.m.s.) deviations from the average value. For the spectra in figure 3(f) and the data in table 1, the later injected bunches at low energy were first removed for the multi-bunch shots, and then the average was performed. Since the later injected e-bunches (Corde et al.
Reference Corde, Thaury, Lifschitz, Lambert, TA PHUOC, Davoine, Lehe, Douillet, Rousse and Malka2013) which are located behind have no influence on the acceleration of the first injected bunches, for the multi-bunch shots, the obtained e-bunches with a much broader spectrum at the low energy level were not counted. The increase of the peak energy
 $\unicode[STIX]{x1D700}_{p}$
while lengthening the distance
$\unicode[STIX]{x1D700}_{p}$
while lengthening the distance
 $l$
indicated that the e-bunches witness a continuous acceleration before
$l$
indicated that the e-bunches witness a continuous acceleration before
 $l=1.2~\text{mm}$
. Meanwhile, the energy spread decreased from 5.7 to 3.4 MeV while the corresponding
$l=1.2~\text{mm}$
. Meanwhile, the energy spread decreased from 5.7 to 3.4 MeV while the corresponding
 $l$
changed from 0.8 to 1.0 mm, and then increased to 13.4 MeV while
$l$
changed from 0.8 to 1.0 mm, and then increased to 13.4 MeV while
 $l$
was increases to 1.2 mm. This energy spread compression at first and then the broadening during the acceleration were caused by the phase space rotation of the accelerated e-bunch in a wakefield. The energy chirp compensation obtained during the early acceleration, which is critical for acceleration optimization in a LWFA, could be applied for high-quality e-bunch generation such as compressing the relative energy spread of the accelerated e-bunch to the one thousandth level (Brinkmann et al.
Reference Brinkmann, Delbos, Dornmair, Kirchen, Assmann, Behrens, Floettmann, Grebenyuk, Gross and Jalas2017; Manahan et al.
Reference Manahan, Habib, Scherkl, Delinikolas, Beaton, Knetsch, Karger, Wittig, Heinemann and Sheng2017). Moreover, the obtained charge of the targeted e-bunch
$l$
was increases to 1.2 mm. This energy spread compression at first and then the broadening during the acceleration were caused by the phase space rotation of the accelerated e-bunch in a wakefield. The energy chirp compensation obtained during the early acceleration, which is critical for acceleration optimization in a LWFA, could be applied for high-quality e-bunch generation such as compressing the relative energy spread of the accelerated e-bunch to the one thousandth level (Brinkmann et al.
Reference Brinkmann, Delbos, Dornmair, Kirchen, Assmann, Behrens, Floettmann, Grebenyuk, Gross and Jalas2017; Manahan et al.
Reference Manahan, Habib, Scherkl, Delinikolas, Beaton, Knetsch, Karger, Wittig, Heinemann and Sheng2017). Moreover, the obtained charge of the targeted e-bunch
 $Q_{1}$
and the whole spectrum
$Q_{1}$
and the whole spectrum
 $Q_{2}$
with different
$Q_{2}$
with different
 $l$
were listed, a larger
$l$
were listed, a larger
 $Q_{2}$
compared with
$Q_{2}$
compared with
 $Q_{1}$
at
$Q_{1}$
at
 $l=1.0~\text{mm}$
and 1.2 mm suggested the existence of the later injected e-bunches at around
$l=1.0~\text{mm}$
and 1.2 mm suggested the existence of the later injected e-bunches at around
 $l=1.0~\text{mm}$
.
$l=1.0~\text{mm}$
.
Table 1. Comparison of e-bunch spectral parameters with different
 $l$
.
$l$
.

Table 2. Comparison of wakefield and e-bunch parameters between experiment and simulation.

Since the energy spread
 $\unicode[STIX]{x0394}\unicode[STIX]{x1D700}$
is defined as
$\unicode[STIX]{x0394}\unicode[STIX]{x1D700}$
is defined as
 $\unicode[STIX]{x0394}\unicode[STIX]{x1D700}=\unicode[STIX]{x1D700}_{\text{front}}-\unicode[STIX]{x1D700}_{\text{back}}$
,
$\unicode[STIX]{x0394}\unicode[STIX]{x1D700}=\unicode[STIX]{x1D700}_{\text{front}}-\unicode[STIX]{x1D700}_{\text{back}}$
,
 $\unicode[STIX]{x0394}\unicode[STIX]{x1D700}>0$
(
$\unicode[STIX]{x0394}\unicode[STIX]{x1D700}>0$
(
 $\unicode[STIX]{x0394}\unicode[STIX]{x1D700}<0$
) for e-bunches with negative (positive) energy chirp, the sign of
$\unicode[STIX]{x0394}\unicode[STIX]{x1D700}<0$
) for e-bunches with negative (positive) energy chirp, the sign of
 $\unicode[STIX]{x0394}\unicode[STIX]{x1D700}$
should be properly judged as the spectra only give the absolute values. Since the wakefield is supposed to be linear and the wakefield dispersion for the e-bunch
$\unicode[STIX]{x0394}\unicode[STIX]{x1D700}$
should be properly judged as the spectra only give the absolute values. Since the wakefield is supposed to be linear and the wakefield dispersion for the e-bunch
 $\unicode[STIX]{x0394}E_{x}$
stays constant during the acceleration, the variation of
$\unicode[STIX]{x0394}E_{x}$
stays constant during the acceleration, the variation of
 $\unicode[STIX]{x0394}\unicode[STIX]{x1D700}$
should be proportional to the acceleration length. Hence,
$\unicode[STIX]{x0394}\unicode[STIX]{x1D700}$
should be proportional to the acceleration length. Hence,
 $$\begin{eqnarray}\displaystyle \frac{\unicode[STIX]{x0394}\unicode[STIX]{x1D700}_{2}-\unicode[STIX]{x0394}\unicode[STIX]{x1D700}_{1}}{l_{a1}}\approx \frac{\unicode[STIX]{x0394}\unicode[STIX]{x1D700}_{3}-\unicode[STIX]{x0394}\unicode[STIX]{x1D700}_{2}}{l_{a2}}, & & \displaystyle\end{eqnarray}$$
where
 $l_{a1}=l_{2}-l_{1}$
,
$l_{a1}=l_{2}-l_{1}$
,
 $l_{a2}=l_{3}-l_{2}$
,
$l_{a2}=l_{3}-l_{2}$
,
 $l_{1}=0.8~\text{mm}$
,
$l_{1}=0.8~\text{mm}$
,
 $l_{2}=1.0~\text{mm}$
and
$l_{2}=1.0~\text{mm}$
and
 $l_{3}=1.2~\text{mm}$
. Moreover, the fact that the evolution of the energy spread undergoes a compression at first and then a growth indicates that the energy chirp of the e-bunch is negative (
$l_{3}=1.2~\text{mm}$
. Moreover, the fact that the evolution of the energy spread undergoes a compression at first and then a growth indicates that the energy chirp of the e-bunch is negative (
 $\unicode[STIX]{x0394}\unicode[STIX]{x1D700}>0$
) when
$\unicode[STIX]{x0394}\unicode[STIX]{x1D700}>0$
) when
 $l=0.8~\text{mm}$
. Therefore, the energy spread
$l=0.8~\text{mm}$
. Therefore, the energy spread
 $\unicode[STIX]{x0394}\unicode[STIX]{x1D700}$
should be given as:
$\unicode[STIX]{x0394}\unicode[STIX]{x1D700}$
should be given as:
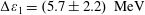 $\unicode[STIX]{x0394}\unicode[STIX]{x1D700}_{1}=(5.7\pm 2.2)~\text{MeV}$
,
$\unicode[STIX]{x0394}\unicode[STIX]{x1D700}_{1}=(5.7\pm 2.2)~\text{MeV}$
,
 $\unicode[STIX]{x0394}\unicode[STIX]{x1D700}_{2}=(-3.4\pm 2.0)~\text{MeV}$
,
$\unicode[STIX]{x0394}\unicode[STIX]{x1D700}_{2}=(-3.4\pm 2.0)~\text{MeV}$
,
 $\unicode[STIX]{x0394}\unicode[STIX]{x1D700}_{3}=(-13.4\pm 2.9)~\text{MeV}$
. Then the wakefield parameters such as
$\unicode[STIX]{x0394}\unicode[STIX]{x1D700}_{3}=(-13.4\pm 2.9)~\text{MeV}$
. Then the wakefield parameters such as
 $E$
,
$E$
,
 $\unicode[STIX]{x0394}E_{x}$
and the e-bunch length
$\unicode[STIX]{x0394}E_{x}$
and the e-bunch length
 $l_{b}$
could be estimated by integrating equations (2.1)–(2.5) together with (3.1); the results are listed in table 2,
$l_{b}$
could be estimated by integrating equations (2.1)–(2.5) together with (3.1); the results are listed in table 2,
 $l_{b}$
and the corresponding
$l_{b}$
and the corresponding
 $\unicode[STIX]{x0394}E_{x}$
are r.m.s. values since the e-bunch energy spread applied in our estimations were r.m.s. values. Therefore, we can gain insight into the longitudinal bunch dynamics in the plasma wake and predict the e-bunch performance in further acceleration. Compared with other LWFA experiments which explore the energy spectrum evolution during the self-injection and acceleration processes (Hsieh et al.
Reference Hsieh, Huang, Chang, Ho, Chen, Lin, Wang and Chen2006; Kim et al.
Reference Kim, Pathak, Hong Pae, Lifschitz, Sylla, Shin, Hojbota, Lee, Sung and Lee2017), the e-bunch phase space rotation was obtained and an important wake (e-bunch) parameter
$\unicode[STIX]{x0394}E_{x}$
are r.m.s. values since the e-bunch energy spread applied in our estimations were r.m.s. values. Therefore, we can gain insight into the longitudinal bunch dynamics in the plasma wake and predict the e-bunch performance in further acceleration. Compared with other LWFA experiments which explore the energy spectrum evolution during the self-injection and acceleration processes (Hsieh et al.
Reference Hsieh, Huang, Chang, Ho, Chen, Lin, Wang and Chen2006; Kim et al.
Reference Kim, Pathak, Hong Pae, Lifschitz, Sylla, Shin, Hojbota, Lee, Sung and Lee2017), the e-bunch phase space rotation was obtained and an important wake (e-bunch) parameter
 $E$
(
$E$
(
 $l_{b}$
) was estimated in a simple way in our results. There are also some works dealing with the e-bunch phase space rotation in a wakefield with beam loading taken into account in the colliding pulse injection case (Rechatin et al.
Reference Rechatin, Davoine, Lifschitz, Ismail, Lim, Lefebvre, Faure and Malka2009a
, Reference Rechatin, Faure, Davoine, Lundh, Lim, Ben-Ismaïl, Burgy, Tafzi, Lifschitz and Lefebvre2010), and the nonlinear fields in their experiments resulted in much more complicated bunch dynamics.
$l_{b}$
) was estimated in a simple way in our results. There are also some works dealing with the e-bunch phase space rotation in a wakefield with beam loading taken into account in the colliding pulse injection case (Rechatin et al.
Reference Rechatin, Davoine, Lifschitz, Ismail, Lim, Lefebvre, Faure and Malka2009a
, Reference Rechatin, Faure, Davoine, Lundh, Lim, Ben-Ismaïl, Burgy, Tafzi, Lifschitz and Lefebvre2010), and the nonlinear fields in their experiments resulted in much more complicated bunch dynamics.
4 Simulation results
In order to investigate the longitudinal dynamics of the e-bunch in the LWFA, and to further check out the accuracy of these estimations, we performed 3-D PIC simulations using the VORPAL code (Nieter & Cary Reference Nieter and Cary2004). The laser parameters listed in the caption of figure 4 were chosen to be close to the experimentally measured values, and the employed plasma density profile is presented in figure 4(a). The first injected e-bunch was self-injected with negative energy chirp into the plasma, and accelerated to a peak energy of 28.6 MeV with r.m.s. energy spread of 8.2 MeV at
 $x=0.83~\text{mm}$
, as shown in figure 4(c). Then, the e bunch was accelerated to 66.6 MeV at
$x=0.83~\text{mm}$
, as shown in figure 4(c). Then, the e bunch was accelerated to 66.6 MeV at
 $x=0.99~\text{mm}$
and its energy chirp was compensated and start to reverse, meanwhile, its r.m.s. absolute energy spread was compressed to 2.8 MeV. After that, the bunch was accelerated to 89.5 MeV at
$x=0.99~\text{mm}$
and its energy chirp was compensated and start to reverse, meanwhile, its r.m.s. absolute energy spread was compressed to 2.8 MeV. After that, the bunch was accelerated to 89.5 MeV at
 $x=1.19~\text{mm}$
before dephasing, and its energy spread was over compensated while increasing to 12.4 MeV. The corresponding spectra shown in figure 4(d) revealed that the energy spread of the e-bunch was compensated and then enlarged due to the phase space rotation. It is noticeable that later injection occurred at
$x=1.19~\text{mm}$
before dephasing, and its energy spread was over compensated while increasing to 12.4 MeV. The corresponding spectra shown in figure 4(d) revealed that the energy spread of the e-bunch was compensated and then enlarged due to the phase space rotation. It is noticeable that later injection occurred at
 $x=0.99~\text{mm}$
, and the energy of the later injected e bunches was always less than the first injected bunch before
$x=0.99~\text{mm}$
, and the energy of the later injected e bunches was always less than the first injected bunch before
 $x=1.19~\text{mm}$
. The total charge accelerated at the end of the simulation was 118.5 pC, and the charge of this first injected e-bunch was 46.2 pC, these results were consistent with the obtained charge in the experiment, as shown in table 1. Figure 4(e) shows the corresponding on-axis wakefield
$x=1.19~\text{mm}$
. The total charge accelerated at the end of the simulation was 118.5 pC, and the charge of this first injected e-bunch was 46.2 pC, these results were consistent with the obtained charge in the experiment, as shown in table 1. Figure 4(e) shows the corresponding on-axis wakefield
 $E_{x}$
at different propagation distances and the longitudinal profile of the accelerated e-bunch; it is clear that the located wakefields were approximately linear, and beam loading of the bunch was weak. This led to the phase space rotation of the bunch, then the energy spread compensation at the beginning of acceleration. The wakefield parameters (
$E_{x}$
at different propagation distances and the longitudinal profile of the accelerated e-bunch; it is clear that the located wakefields were approximately linear, and beam loading of the bunch was weak. This led to the phase space rotation of the bunch, then the energy spread compensation at the beginning of acceleration. The wakefield parameters (
 $E^{\prime }$
and
$E^{\prime }$
and
 $\unicode[STIX]{x0394}E_{x}$
are average values with a time span of 0.33 picosecond) and r.m.s.
$\unicode[STIX]{x0394}E_{x}$
are average values with a time span of 0.33 picosecond) and r.m.s.
 $l_{b}$
values are listed in table 2, which are in good agreement with the experimental results.
$l_{b}$
values are listed in table 2, which are in good agreement with the experimental results.

Figure 4. (a) Plasma density profile and laser amplitude
 $a_{0}$
evolution along the laser propagation direction
$a_{0}$
evolution along the laser propagation direction
 $x$
in the simulation. (b) Energy evolution (c) of the injected e-bunches along
$x$
in the simulation. (b) Energy evolution (c) of the injected e-bunches along
 $x$
and the corresponding energy spectra (d) of the first injected ones at different propagation distances, the dotted lines are the Gaussian fittings. (e) The on-axis wakefield
$x$
and the corresponding energy spectra (d) of the first injected ones at different propagation distances, the dotted lines are the Gaussian fittings. (e) The on-axis wakefield
 $E_{x}$
at different propagation distances together with the longitudinal profile of the accelerated e-bunch. The colours in (c–e) represent different propagation distances:
$E_{x}$
at different propagation distances together with the longitudinal profile of the accelerated e-bunch. The colours in (c–e) represent different propagation distances:
 $x=0.83~\text{mm}$
(blue),
$x=0.83~\text{mm}$
(blue),
 $x=0.99~\text{mm}$
(green) and
$x=0.99~\text{mm}$
(green) and
 $x=1.19~\text{mm}$
(red). (f) Comparison of the evolution of peak energy
$x=1.19~\text{mm}$
(red). (f) Comparison of the evolution of peak energy
 $\unicode[STIX]{x1D700}_{p}$
(○) and absolute energy spread
$\unicode[STIX]{x1D700}_{p}$
(○) and absolute energy spread
 $|\unicode[STIX]{x0394}\unicode[STIX]{x1D700}|$
(▫) between 3-D PIC simulations and the experimental results (with error bars). Laser parameters: wavelengths
$|\unicode[STIX]{x0394}\unicode[STIX]{x1D700}|$
(▫) between 3-D PIC simulations and the experimental results (with error bars). Laser parameters: wavelengths
 $\unicode[STIX]{x1D706}_{0}=0.8~\unicode[STIX]{x03BC}\text{m}$
, normalized amplitude
$\unicode[STIX]{x1D706}_{0}=0.8~\unicode[STIX]{x03BC}\text{m}$
, normalized amplitude
 $a_{0}=1.2$
, pulse durations
$a_{0}=1.2$
, pulse durations
 $\unicode[STIX]{x1D70F}=33~\text{fs}$
and FWHM spot size
$\unicode[STIX]{x1D70F}=33~\text{fs}$
and FWHM spot size
 $w_{\text{FWHM}}=32~\unicode[STIX]{x03BC}\text{m}$
. The linearly polarized Gaussian pulse was focused at the starting position of the plasma. Simulation parameters: numerical grid’s cell size
$w_{\text{FWHM}}=32~\unicode[STIX]{x03BC}\text{m}$
. The linearly polarized Gaussian pulse was focused at the starting position of the plasma. Simulation parameters: numerical grid’s cell size
 $\unicode[STIX]{x0394}x\times \unicode[STIX]{x0394}y\times \unicode[STIX]{x0394}z=0.04\times 0.2\times 0.2~\unicode[STIX]{x03BC}\text{m}^{3}$
, moving window size
$\unicode[STIX]{x0394}x\times \unicode[STIX]{x0394}y\times \unicode[STIX]{x0394}z=0.04\times 0.2\times 0.2~\unicode[STIX]{x03BC}\text{m}^{3}$
, moving window size
 $W_{x}\times W_{y}\times W_{z}=42\times 136\times 136~\unicode[STIX]{x03BC}\text{m}^{3}$
.
$W_{x}\times W_{y}\times W_{z}=42\times 136\times 136~\unicode[STIX]{x03BC}\text{m}^{3}$
.
Comparison of the spectral evolution between the PIC simulations and the experimental results are shown in figure 4(f), and the peak energy
 $\unicode[STIX]{x1D700}_{p}$
shows a discrepancy between the simulation and experiment as well as in the absolute energy spread
$\unicode[STIX]{x1D700}_{p}$
shows a discrepancy between the simulation and experiment as well as in the absolute energy spread
 $|\unicode[STIX]{x0394}\unicode[STIX]{x1D700}|$
. This could be attributed to the downward density ramp at the tail of the plasma, as mentioned above in the experiment. As shown in figure 4(f), the energy gain of the e-bunch in the simulation slowed down on propagating forward, thus the acceleration field was decreasing with the e-bunch dephasing. Therefore, the experimentally generated e-bunches with
$|\unicode[STIX]{x0394}\unicode[STIX]{x1D700}|$
. This could be attributed to the downward density ramp at the tail of the plasma, as mentioned above in the experiment. As shown in figure 4(f), the energy gain of the e-bunch in the simulation slowed down on propagating forward, thus the acceleration field was decreasing with the e-bunch dephasing. Therefore, the experimentally generated e-bunches with
 $l_{1}=0.8~\text{mm}$
would be further accelerated in the plasma downward ramp even when the wakefield period expands rapidly. However, for the e-bunches with
$l_{1}=0.8~\text{mm}$
would be further accelerated in the plasma downward ramp even when the wakefield period expands rapidly. However, for the e-bunches with
 $l_{3}=1.2~\text{mm}$
, these were decelerated in the plasma downward ramp and as such they were located at the deceleration phase. On the other hand, the absolute energy spread
$l_{3}=1.2~\text{mm}$
, these were decelerated in the plasma downward ramp and as such they were located at the deceleration phase. On the other hand, the absolute energy spread
 $|\unicode[STIX]{x0394}\unicode[STIX]{x1D700}|$
caused by the wakefield dispersion varies less in the plasma downward ramp because
$|\unicode[STIX]{x0394}\unicode[STIX]{x1D700}|$
caused by the wakefield dispersion varies less in the plasma downward ramp because
 $\unicode[STIX]{x0394}E_{x}$
decreased rapidly while the wake period expanded. Apart from the plasma density ramp in the experiment, there are some other factors which could also introduce uncertainties in the parameter estimations, such as deformation of the bubble during the acceleration (Kalmykov et al.
Reference Kalmykov, Beck, Yi, Khudik, Downer, Lefebvre, Shadwick and Umstadter2011).
$\unicode[STIX]{x0394}E_{x}$
decreased rapidly while the wake period expanded. Apart from the plasma density ramp in the experiment, there are some other factors which could also introduce uncertainties in the parameter estimations, such as deformation of the bubble during the acceleration (Kalmykov et al.
Reference Kalmykov, Beck, Yi, Khudik, Downer, Lefebvre, Shadwick and Umstadter2011).
5 Conclusion
In conclusion, we demonstrate the experimental observation of energy chirp compensation in a LWFA, and estimate the characteristic wake parameters which are correlated with the phase space rotation based on the evolution of energy spectra. These results reveal more details of the longitudinal dynamics of the accelerated e-bunch in a LWFA with the help of 3-D PIC simulation results, which will provide better control over a LWFA with tuneable ultrashort electron sources.
Acknowledgements
This work was supported by the National Natural Science Foundation of China (grant nos 11127901, 11425418, 61521093 and 11505263), Shanghai Sailing Program (grant no. 17YF1421100), Strategic Priority Research Program (B) (grant no. XDB16), Youth Innovation Promotion Association CAS and State Key Laboratory Program of the Chinese Ministry of Science and Technology.


