


Public sector pension reform is currently a topic of significant policy interest due to the poor financial condition of many public systems. In the USA, estimates peg the national shortfall in public sector assets relative to liabilities at several trillion dollars.Footnote 1 In Europe, there are similar concerns about the financial state of public pension systems and many countries have begun to explore reforms in order to increase the likelihood that they will be fiscally sustainable into the future (Börsch-Supan, Reference Börsch-Supan2012). The great majority of public employees are covered by defined benefit (DB) pension plans (National Education Association, 2010; OECD, 2013), and in the USA a number of policymakers and experts (see, for example, Institutional Investor, 2013) have proposed reforms that would move public pension systems toward defined contribution (DC) structures (which are by definition fully funded).Footnote 2 An aspect of the debate around pension reform that is not well understood is what the preferences of public employees for alternative versus traditional plan structures look like, and how reforms might affect the composition of the public sector workforce.
Most of the research on the pension choices of public sector employees focuses on one segment of the public sector workforce: university system employees (e.g., Clark et al., Reference Clark, Ghent and McDermed2006; Gerrans and Clark, Reference Gerrans and Clark2013; Brown and Weisbenner, Reference Brown and Weisbenner2014). These studies find that choice between a DB and DC system is dependent on age, gender, and salary. They also report only a modest ability to predict which types of employees will choose one type of system versus another, which is likely due to heterogeneity in preferences that is not captured by demographic or employment characteristics.Footnote 3 Attitudes about risk and financial knowledge and expectations about investment returns are, not surprisingly, important predictors of plan choice. This is made clear in Brown and Weisbenner (Reference Brown and Weisbenner2014), who find that survey information on employees’ beliefs and preferences dramatically increases the explanatory power of plan choice models.
An important issue that arises in the context of considering pension reform is whether changes to the pension system could affect workforce quality. Pension benefits represent an especially important component of overall compensation in the public sector (Lewin et al., Reference Lewin, Keefe and Kochan2012), and DB pension structures have long been thought to be an important tool to recruit and retain high-quality public sector employees (Dorsey, Reference Dorsey1995). However, recent theoretical research questions whether this compensation structure is in fact efficient or simply reflects the political process that determines public sector pay (Glaeser and Ponzetto, Reference Glaeser and Ponzetto2014). To our knowledge, there is only one published study that incorporates a measure of employee productivity in a choice model to see whether a DB or DC system may be more desirable to more effective workers. Reference Chingos and WestChingos and West (forthcoming) analyze pension choice among newly hired public school teachers in Florida who, when hired, are given a choice between a traditional DB plan (the default option) and a pure DC plan. The authors find that only about a quarter of teachers choose the DC plan, and that the likelihood of choosing this option is correlated with factors related to greater professional mobility, including having an advanced degree and academic backgrounds in mathematics or science subject areas. They find a weak positive relationship between productivity and the propensity to choose the DC plan.
The research presented here builds on the work referenced above in several ways. First, like Chingos and West, we analyze the pension preferences of a large and important sector of employees enrolled in public pension systems (both in the USA and in Europe) that to date has not been the subject of many empirical analyses: public educators.Footnote 4 Second, we analyze choices between a traditional DB plan and an alternative plan structure that has not been previously studied: a hybrid pension plan with both DB and DC components. Third, our study focuses on both the choices of newly hired employees, and existing employees who are offered a transfer payment if they opt into the hybrid plan (within a specific time window). This component of the analysis is particularly relevant to policy-makers considering reforms that would provide incumbent employees the opportunity to opt into a new system. Fourth, we explicitly model the financial tradeoffs between the two pension systems for each individual, which has not been done in the prior literature with the exception of Brown and Weisbenner (Reference Brown and Weisbenner2014), providing evidence on what it might cost states to induce incumbent employees to move into a hybrid plan. Finally, we estimate pension choice models that include a measure of employee productivity, adding to the currently sparse evidence on how pension reform may affect workforce quality.Footnote 5
We find that the majority of teachers prefer the hybrid DB–DC plan to the traditional DB-only system, and that teacher age is highly predictive of choice. The measure of relative financial value of enrollment in one system versus another is also significant, although the magnitude of the estimated impact of the financial inducement on system choice is small. Importantly, we find that higher performing teachers are slightly more likely to choose the hybrid plan. We conclude that the experience in Washington suggests that governments operating traditional DB plans can, through pension reform, reduce their financial exposure while providing employees with a retirement system that they highly value. These results expand the range of evidence on the pension preferences of employees enrolled in public pension systems and are specifically relevant to the large proportion of public employees who are employed in the education sector.
1 Background on pension choices in Washington State
In Washington state, two groups of teachers have been able to choose between two Teacher Retirement Systems (TRS); we refer to these as the 1997 and the 2007 choice cohorts.Footnote 6 Between 1977 and 1996 all newly hired teachers were enrolled in TRS2, a pure DB plan. In 1996, the state created TRS3, a hybrid DB–DC plan, and offered teachers employed as of July 1996 (henceforth referred to as the ‘1997 Choice Cohort’) an ongoing option to transfer to the new TRS3 plan. An important aspect of this opportunity is that between July 1, 1996 and December 31, 1997 teachers received a transfer bonus payment when switching to the new plan. Initially, the size of the transfer payment was equal to 20% of an employee's contributions to TRS2 plus accrued interest.Footnote 7 The size of the payment was increased by legislators to 40% on April 15, 1997, and to 65% in April 1998. Ultimately, all teachers who transferred to TRS3 prior to 1998 received the 65% transfer payment. While the option to transfer to TRS3 for the 1997 cohort is ongoing, the transfer bonus payment was only available to those who opted to transfer before the end of 1997, and the overwhelming majority of transfer decisions (over 98%) occurred between the July 1996 and December 1997.Footnote 8
All new teachers hired between July 1996 and June 2007 were enrolled in the new hybrid plan and in July 2007, TRS2 was reopened as an option to new hires (henceforth referred to as the ‘2007 Choice Cohort’). Although teachers in this choice cohort can choose between TRS2 or TRS3, they, unlike the 1997 Choice Cohort, did not receive any financial inducement to enroll in one or the other system. If an active enrollment decision is not made within the first 90 days of employment, the teacher is defaulted into the TRS3 plan.
The two primary differences between TRS2 and TRS3 (which are summarized in Table 1 below) are that (1) TRS3 has a DB benefit multiplier that is half that of TRS2 (0.01 versus 0.02), and (2) in TRS3 employee contributions are placed in a personal DC account rather than the pension system's fund. There are several other features of the plans that are important to comparing the plans’ relative value. First, the vesting period for TRS3 is twice as long as under TRS2 (10 versus 5 years).Footnote 9 Second, the rules governing contribution rates (i.e., the cost of the plans to the employee) are different for the two plans: under TRS2, the contribution rates are determined by the state, whereas TRS3 members must contribute at least 5% of salary into their DC accounts. Third, TRS3 employees who separate with 20 or more service credit years (SCY) see their DB annuity increase by approximately 3% each year between separation and retirement (up to age 65).Footnote 10
Table 1. Key features of Washington State teacher retirement system plans

1 The 5-year vesting period was grandfathered in for those in the 1997 cohort, so that the vesting period is 5 years for both TRS2 and TRS3. For the 2007 cohort, an employee is vested with five SCY if at least one SCY has been earned after the age of 44.
2 In the decade preceding 1997, the employee contribution rate averaged 6.6%, ranging between 6.9% and 6.03%. In the decade preceding 2008, employee contribution rates ranged between 0.15% and 4.26%.
2 Data
Confidential data on TRS choices that are maintained by the Washington State DRS are used to model teachers’ pension system choices. These data are merged with administrative records from the Washington State Office of Superintendent for Public Instruction (OSPI) and the Professional Education Standards Board (PESB). The administrative records are supplemented with school- and district-level information from the National Center for Education Statistics’ Common Core of Data (CCD). The DRS data provide record of every transaction between a teacher and DRS between the beginning of his or her career and 2010. The OSPI data include information on teacher demographics, position assignment, salary, and experience. Data on teacher endorsements (e.g., English, mathematics and science) and certifications are from PESB records. The CCD provides school-level data on size, demographics, passage rates of standardized tests, Title I status, and the percentage of students receiving free lunch. District-level data include test-passage rates, size, and type of locale (e.g., rural or urban).
The two populations of interest for this study are the two cohorts of teachers who were able to choose between the TRS2 and TRS3 pension plans in 1997 and in 2007–2010. Full-time classroom teachers are identified using the OSPI personnel data on the basis of duty codes, activity codes, and the percentage of FTE employment classified as a certificated position.Footnote 11 DRS administrative data is used to identify when a teacher was hired, and by extension, whether he or she belongs to the 1997 or 2007 choice cohort. The 1997 cohort is defined as teachers enrolled in TRS2 prior to July 1996; the 2007 cohort is defined as teachers hired after July 1, 2007.
The demographic composition of the choice cohorts and the proportions of teachers choosing TRS3 are summarized in Table 2 for different subgroups defined by teacher, school, and regional characteristics.Footnote 12 Teachers in the 1997 Choice Cohort, which is comprised of experienced teachers, are significantly older than those in the 2007 Choice Cohort, which is comprised of new hires. The proportion of male teachers is smaller in the 2007 Choice Cohort, but the samples are otherwise quite similar. Overall, teachers in both choice cohorts were more likely to choose TRS3 than TRS2, but the proportion of teachers choosing TRS3 is substantially higher in the 1997 cohort (75% versus 61%). This is not surprising given the transfer payments offered in 1997, but it is notable because the plan a teacher defaults into if not making an active choice is TRS2 in 1997 and TRS3 in 2007.
Table 2. Proportion choosing TRS3 by selected teacher and school characteristics
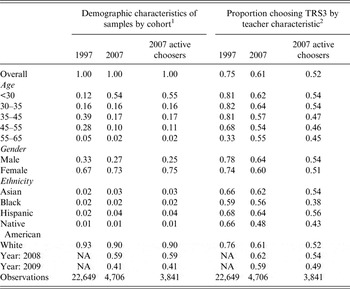
1 These proportions are calculated over the entire sample. For example, 12% of teachers in the 1997 Choice Cohort are under the age of 30.
2 These proportion are calculated within groups. For example, 81% of teachers under 30 in the 1997 Choice Cohort chose to transfer to TRS3.
3 A model of pension choice
Here we describe the pension choice faced by Washington teachers in terms of trade-offs provided by the two plans, advance a measure of the relative financial benefits provided by TRS2 and TRS3, and specify an empirical model that is estimated in the following section.
3.1 Tradeoffs between TRS2 and TRS3
3.1.1 Relative financial value
Central to a teacher's choice between TRS2 and TRS3 is comparison of the level of financial benefit the two plans are likely to provide in retirement. Numerous analyses have in fact found that employees (including public educators) respond to the financial incentives embedded in retirement benefits (Chan and Stevens, Reference Chan and Stevens2004; Asch et al., Reference Asch, Haider and Zissimopoulos2005; Furgeson et al., Reference Furgeson, Strauss and Vogt2006). As such, we expect estimates of the relative financial benefits of the two plans to be significant predictors of pension choice. While we anticipate relative financial value to predict teachers’ choices, there is also evidence that employees may hold inaccurate perceptions of their pensions, and act on their beliefs about financial benefits regardless of whether those beliefs are accurate (Chan and Stevens, Reference Chan and Stevens2008; Brown and Weisbenner, Reference Brown and Weisbenner2014). We of course do not directly observe these perceptions so must interpret the findings on relative financial value as the effect of value mediated through teachers’ understanding of its implications.
As a measure of relative financial value we use the internal rate of return (IRR), which is calculated for each teacher and each potential year of separation as the constant rate of return earned on DC assets that would be required to satisfy the equality: NPV TRS3 = NPV TRS2, where NPV * is the net present value of the pension plan at the point in time in which a pension choice is being made. Following Koedel et al. (Reference Koedel, Podgursky and Shi2013), the relative value measure for each potential teacher-separation year is weighted by the probability the teacher will separate in that year, given his or her current age and level of experience (see Appendix A for details on pension value calculations).
Teachers for whom the IRR is high should be relatively less likely to select TRS3 since they would have to assume a high rate of return on the DC portion of TRS3 to equate it to the discounted value of TRS2 and vice versa. We find that on average, the expected IRR is lower among teachers who choose to enroll in TRS3 (5.7 versus 7.0 for the 1997 Cohort and 6.9 versus 7.2 for the 2007 Cohort). The distributions of IRR values are substantially different for TRS2 versus TRS3 choosers among the 1997 cohort, but are essentially the same among the 2007 cohort. Given these patterns we expect relative pension wealth to be predictive of pension choice among the 1997 cohort, but to have less predictive power among the 2007 cohort.
3.1.2 Portability
Because the relative value of TRS2 and TRS3 varies with length of tenure, a teacher's expectations about tenure may play a role in pension preference. Generally speaking, TRS3 provides more flexibility in terms of separation and retirement timing, but TRS3 has a longer vesting period than TRS2 (10 versus 5 years) for those whose vesting status was not grandfathered in. We do not directly observe teachers’ expected tenures, but teacher mobility has been the subject of labor market analyses that identify several teacher and work-environment characteristics that are strongly related to tenure length. Those with better labor market opportunities outside of teaching, such as those with math and science training, are less likely to enter the teaching profession (Goldhaber and Liu, Reference Goldhaber, Liu and Fowler2003), and having become a teacher, more likely to leave the profession (Murnane and Olsen, Reference Murnane and Olsen1989). A number of studies show that the demographics and achievement levels of students in a school are important determinants of teacher mobility (e.g., Boyd et al., Reference Boyd, Lankford, Loeb and Wyckoff2005; Scafidi et al., Reference Scafidi, Sjoquist and Stinebrickner2007; Goldhaber et al., Reference Goldhaber, Gross and Player2011) with teachers being more likely to attrit from schools serving more economically disadvantaged student populations. Finally, a number of studies show that teacher mobility and attrition from the profession varies along the effectiveness distribution (Hanushek et al., Reference Hanushek, Kain and Rivkin2004; Krieg, Reference Krieg2006; Boyd et al., Reference Boyd, Grossman, Lankford, Loeb and Wyckoff2007; Chingos and West, Reference Chingos and West2012), with the general finding that more effective teachers are less likely to leave the profession.
3.1.3 Risk
While both pension plans provide a guaranteed benefit for life to those teachers who are vested, the guaranteed benefit (although not necessarily the total benefit) is roughly half as large under TRS3. As such, TRS3 is less likely to appeal to teachers who are more risk averse. A number of teacher characteristics may be related to risk aversion. Studies suggest that women are more risk averse than men in regards to the structuring of compensation (Croson and Gneezy, Reference Croson and Gneezy2009; Dohmen and Falk, Reference Dohmen and Falk2011). Higher income individuals are more able to accommodate financial risk and are likely to be less risk averse.Footnote 13 Risk aversion has also been found to increase with age (Hallahan et al., Reference Hallahan, Faff and McKenzie2004). Analyses of the trade-offs between DB and DC plans have found that DB plans become relatively attractive as an employee ages due to the lower probability of the employee changing jobs (Childs et al., Reference Childs, Fore, Ott and Lilly2002) and because it allows employees to increase diversification of financial assets by reducing exposure to financial market risk (McCarthy, Reference McCarthy2003). Other analyses of pension choice find that minorities are more likely to choose DB plans (Reference Chingos and WestChingos and West, forthcoming; Clark et al., Reference Clark, Ghent and McDermed2006) and there is evidence that risk aversion varies with ethnicity (Gutter et al., Reference Gutter, Fox and Montalto1999; Yao et al., Reference Yao, Gutter and Hanna2005).
3.2 Empirical specification
As discussed above, factors related to relative financial value, portability, and risk are likely to influence an individual's choice between TRS2 and TRS3, and these factors are likely to be related to a number of teacher and work-environment characteristics. But while empirical links between our control variables and risk preferences and teacher mobility may justify the inclusion of these variables in the empirical model, it does not fully support the interpretation of the coefficients on these variables as evidence of why teachers choose a particular plan.Footnote 14 That said, an important question for any policymaker considering pension reform is how reform might affect the composition of the workforce. In this sense, the relationship between teacher characteristics and pension choice are of interest in and of themselves, even if the mechanisms underlying these relationships cannot be illuminated by the available data.
Of particular interest is the relationship between pension choice and teacher quality, as a primary function of pension benefits is to recruit and retain the highest quality workers. There is significant policy concern about the overall quality of the teacher workforce and, in particular, whether the profession is drawing talented college graduates (Hanushek and Pace, Reference Hanushek and Pace1995; Lakdawalla, Reference Lakdawalla2001; Goldhaber and Liu, Reference Goldhaber, Liu and Fowler2003; Corcoran et al., Reference Corcoran, Evans and Schwab2004; Goldhaber and Walch, Reference Goldhaber and Walch2014). Several studies suggest that the decline over time in the academic caliber of the teacher workforce may be related, at least in part, to compensation structures in the teaching profession (e.g., Hoxby and Leigh, Reference Hoxby and Leigh2004; Goldhaber, Reference Goldhaber2006; Chingos and West, Reference Chingos and West2012). In an analysis of the ‘push’ and ‘pull’ incentives created by DB pension structures in Missouri, Koedel et al. (Reference Koedel, Podgursky and Shi2013) conclude that these incentives have a negative, but small, influence on the overall effectiveness of the teacher workforce. These studies suggest that preferences for different compensation structures (including type of pension plan) may vary with teacher effectiveness. Given the debate around whether pension reforms would be likely to have a positive (e.g., Doherty et al., Reference Doherty, Jacobs and Madden2012; Aldeman and Rotherham, Reference Aldeman and Rotherham2014; Mahler et al., Reference Mahler, Chingos and Russ2014) or negative (e.g., Boivie, Reference Boivie2011; Weller, Reference Weller2011) influence on the quality of the teacher workforce, these findings should be of significant policy interest.
We estimate models that control for measures of teacher effectiveness (used interchangeably with ‘teacher productivity’). The effectiveness measure we employ is value-added, which is a statistical measure of individual teachers’ contributions to student learning as measured by performance on standardized tests.Footnote 15 Value-added is now being used in a number of states and localities as a component measure of teachers' job performance (Goldhaber, Reference Goldhaber2010) and allows us to rank teachers according to an output measure of productivity. We estimate models using a continuous value-added score as well as models with an indicator of having an above-average score. Specifications that include these measures are estimated separately because the measure of teacher effectiveness is available for a subset of teachers who can be matched to their students during the 2007–2010 school years. It is possible to estimate value-added job performance measures for this subset of teachers – 2,363 teachers in the 1997 cohort and 665 teachers in the 2007 cohort.Footnote 16 For more detail on the econometric specification of the value added models we employ, see Appendix B.
The primary difference between the overall study sample and the subset of teachers with value-added scores is that they teach only in grades 4–6 (where teachers can more readily be linked to the individual students in their classes), and were employed during at least one of the 2007–2010 school years (the years for which data are available). Teachers in the value-added sub-sample are slightly more likely to be women and to teach in suburban districts, but overall the demographics of the sub-sample looks very similar to the full sample of teachers. However, two factors may limit the generalizability of the coefficients on teacher effectiveness. First, among the 1997 cohort, score availability is restricted by teacher attrition and retirement during the time period between 1997 and 2007. Second, the value-added estimates are determined after teachers’ pension choices. For the 1997 model in particular, this introduces potential selection problems related to the relationship between teacher effectiveness, pension choice, and attrition.
A teacher's pension choice is characterized by the following model:
 $$Y_i^\ast \, = \,E[U_i (TRS3)]\, - \,E[U_i (TRS2)],$$
 $$Y_i = \left\{ {\matrix{ {1,\; \; Y_i^\ast \ge 0,} \cr {0,\; \; Y_i^\ast < 0,} \cr}} \right.\; $$
where Y i* is a latent variable equal to the difference between employee i's expected utility under TRS2 and her expected utility under TRS3, and Y i is the observed pension choice (equal to one if the employee chooses TRS3). Y i* is assumed to be a function of the expected relative financial value of TRS2 and TRS3 and teacher and work-environment characteristics for teacher i:
 $$Y_i^{\ast} = \alpha + \beta _1^{\prime} {x_{1i}} + \beta _2^{\prime} {x_{2i}} + {u_i}\;,$$
where x 1i is a measure of employee i's relative pension wealth and x 2i is a vector of teacher, work-environment, and geographic characteristics. From these equations, we obtain a binary choice model:
 $${\rm Prob}(y_i = 1) = {\rm Prob}\left( {u_i \gt - \left( {\beta _1^{\prime} x_{1i} + \beta _2^{\prime} x_{2i}} \right)} \right).$$
The binary choice model is estimated separately for each of the choice cohorts as a logit model. There are several reasons for modeling pension choice separately for these two groups (a Chow Test confirms that it would be inappropriate to model the pension choice on a pooled sample). First, the plan a teacher defaults into is different (TRS2 in the 1997 cohort and TRS3 in the 2007 cohort), and there is substantial evidence that which choice is the default option is important (Thaler and Sunstein, Reference Thaler and Sunstein2008). Second, the contexts under which choices were made are different: teachers in the 1997 cohort choose whether or not to switch out of a plan they had been enrolled in (some for long periods of time), while those in the 2007 cohort make first-time enrollment decisions. Finally, there are significant differences between the two time periods in terms of the teacher labor market and the investment environment.Footnote 17 These issues also make it difficult to identify what is driving different behavior across cohorts: our data do not allow us to disentangle the effects of default settings, the choice context, and dynamic factors that might differently influence investment choices in time periods that are 10 years apart.
4 Results
The results for the pension choice models are reported in Tables 3 and 4 and are estimated with district fixed-effects.Footnote 18Table 3 presents the primary regression results for both choice cohorts, and Table 4 presents models estimated with controls for teacher effectiveness.Footnote 19
Table 3. Pension Choice Logit Models: Average Marginal Effects

*** Significant at the 0.1% level.
** Significant at the 1% level.
*Significant at the 5% level.
Notes: All models are estimated with school district fixed effects. The table does not report the complete set of covariates. These models also included the following: indicator of years of service credit being 0–5 years, 5–10 years, and 10+ years (1997 Choice Cohort only); indicators of holding an endorsement in the math/science, elementary, PE/health, arts, and special education subject areas; school-level indicators (elementary, middle, high, and other); locale-type indicators (urban, suburban, town, and rural). The full regressions are available upon request.
Table 4. Average marginal effects of teacher effectiveness on pension choice

*** Significant at the 0.1% level.
** Significant at the 1% level.
* Significant at the 5% level.
The proportion of teachers choosing TRS3 is significantly higher for the 1997 Choice Cohort than the 2007 Cohort: 75% versus 61%. But, as we noted above, teachers in these groups are quite different from one another demographically (e.g., in terms of age and experience, see Table 2) and given the way the choice of pension system was introduced to each cohort. To explore underlying differences in the propensity to choose TRS2 versus TRS3 between the two cohorts we estimate a model on a sample pooled across both cohorts, but restricted to teachers with two years or less of experience. We find that even controlling for relative financial value and teacher characteristics, teachers in the 1997 Choice Cohort are approximately 8% more likely to choose TRS3. One possible explanation for this is the shorter vesting period for TRS3 for the 1997 Cohort (because its 5-year vesting period was grandfathered in), but as discussed above, the differing choice contexts and time periods faced by the two choice cohorts do not allow us to pin down what combination of influences might be driving the differing popularity of TRS3.
4.1 Factors predicting system choice
Selected coefficients from the logit model estimations for the 1997 and 2007 cohorts are presented in Table 43 as marginal effects. The explanatory power of the 1997 models is modest, but consistent with what has been reported in other empirical studies of pension choice (e.g., Brown and Weisbenner, Reference Brown, Weisbenner, Brown, Liebman and Wise2009, Chingos and West, forthcoming, Yang, Reference Yang2005) that do not include survey data (as in Brown and Weisbenner, Reference Brown and Weisbenner2014), but the control variables explain less of the variation in pension system choice for the 2007 Choice Cohort.Footnote 20 For both cohorts, the inclusion of school district fixed effects significantly improves model fit but has little impact on the magnitudes of the estimated coefficients.
We find a significant relationship between plan choice and our measure of relative financial value. For both choice cohorts, the coefficient on IRR is significant and negative, although its magnitude differs across cohorts: a one-percentage-point increase in the IRR is estimated to decrease the probability of choosing TRS3 by about 2.2 percentage points for the 1997 choice cohort but only by about 1.4 percentage points for the 2007 cohort. When age is excluded from the 1997 Choice Cohort model (column 2), the marginal effect of the IRR increases from 2.2 percentage points to 3.8 percentage points.
Given the large proportions of teachers choosing TRS3 (75% and 60% for the 1997 and 2007 Choice Cohorts, respectively), large changes in relative pension value are associated with relatively small changes in the proportion choosing a plan. However, other analyses have found similarly small effect sizes. Brown and Weisbenner (Reference Brown and Weisbenner2014) obtain a coefficient of −7.2 on the ratio of the NPVs of the DB and DC plans. Yang (Reference Yang2005), who also models pension choice controlling for an IRR measure of relative financial value, reports a coefficient of −0.0191. Several factors are likely to limit the extent to which IRR predicts plan choice. First, we do not observe each individual's expected length of tenure, which can have a large influence on the value of IRR. Second, it is likely that some teachers did not take the time to carry out a careful financial comparison of the two plans.Footnote 21 Third, unobserved attitudes about risk, personal control over investments, and preferences for non-financial retirement system attributes may play a larger role in pension choice than relative financial value for many individuals (e.g., Brown and Weisbenner, Reference Brown and Weisbenner2014).
As described in Section 1, teachers in the 1997 Choice Cohort received a transfer bonus payment equal to the 65% of the their accrued contributions into TRS2. Our results suggest that the size of the bonus payment (i.e., whether it was 20, 40, or 65%) might not have had a large influence on the proportion of teachers who transferred to TRS3. Washington is estimated to have paid about US$200 million to teachers who transferred from TRS2 to TRS3 in 1996, but we estimate that the effect of the 65% transfer bonus only increased enrollment in TRS2 by about 3 percentage points.Footnote 22 This suggests that a similar proportion of the 1997 Choice Cohort would have transferred to TRS3 even if the transfer bonus not been offered.Footnote 23
Teacher characteristics that have been interpreted in the literature as being associated with greater risk aversion (see Section 3.1) are associated with a lower probability of choosing TRS3. Among the 1997 cohort, older, lower-salary, and non-white teachers are significantly less likely to choose TRS3. For the 2007 cohort, we cannot include both age and IRR controls due to collinearity, and cannot disentangle the effects of age and relative financial value on pension choice. The other findings, however, are generally in line with those of the 2007 Choice Cohort. Males are significantly more likely to choose TRS3, and salary has a positive but statistically insignificant influence. Teachers hired in the 2008–2009 school year are significantly less likely to choose TRS3, suggesting that the 2008 financial crisis may have influenced teachers’ perceptions of the riskiness of TRS3.
Somewhat surprisingly, we find little consistent evidence for either cohort that pension system choices are associated with the teacher and workplace characteristics related to teacher mobility. Teachers with math or science endorsements are no more likely to choose the hybrid plan. A school's grade level is not predictive of pension choice, nor is the proportion of disadvantaged students.Footnote 24
4.2 Pension choice and teacher effectiveness
The models in Table 4 add measures of teacher effectiveness for the subsample of teachers for whom they are available.Footnote 25, Footnote 26 In the 1997 cohort, the coefficient on the continuous measure of teacher effectiveness is significant and positive: A one standard deviation change in teacher effectiveness (0.14 for the 1997 Choice Cohort) is associated with an approximately 2–3 percentage point increase in the predicted probability of choosing TRS3. When an indicator of above average effectiveness is used in place of the continuous measure of achievement we obtain similar results: above average teachers are approximately 4% more likely to choose TRS3 than below average teachers.
In the 2007 cohort, a similar pattern is observed, but with larger marginal effects and less statistical significance. A one standard deviation change in effectiveness (0.14 for the 2007 Choice Cohort) is associated with a 6-percentage-point increase in the predicted probability of choosing TRS3. When we specify the model with an indicator of above-average effectiveness, the above average teachers are 8–10 percentage points more likely to choose TRS3 teachers with below-average value-added scores.Footnote 27
5 Policy implications and conclusions
We study two periods of time during which public school teachers in Washington State have been able to choose between a hybrid plan (TRS3) and the state's traditional DB plan (TRS2). At a basic level, we find substantial support for the notion that teachers are willing to consider a move from a traditional DB to a hybrid DB–DC system: approximately 75% of teachers in the 1997 choice cohort transferred from the traditional DB plan to the hybrid plan. The overall popularity of the hybrid plan in 1997 is notable for the fact that the default (i.e., the result of taking no action) was to remain in TRS2. Among new hires, approximately 60% of teachers enroll in TRS3 during the study period, despite the fact that new hires face a longer vesting period under TRS3.
While our findings speak most directly to the public education sector in the USA, they also add to the existing body of evidence on public-sector pension preferences, which has tended to be informed by analysis of pension choice among university system employees (e.g., Clark et al., Reference Clark, Ghent and McDermed2006; Gerrans and Clark, Reference Gerrans and Clark2013; Brown and Weisbenner, Reference Brown and Weisbenner2014). The extent to which these results can be generalized to the public sector workforce may be limited given that the teacher workforce in Washington (as in most other US states) is relatively homogenous in terms of their education (all have a bachelor's degree or higher) and compensation (teacher are paid on a salary schedule defined primarily by degree and experience) compared to the overall public-sector workforce. Teachers’ relatively high level of education attainment, for instance, may correspond with above average financial literacy (Lusardi and Mitchell, Reference Lusardi and Mitchell2007) and different pension preferences than public sector employees in general. But we would argue that the findings on teachers are of interest given their large share of the public sector workforce and outsized influence on public pensions.
We find that teachers are responsive to the relative financial value of the plans, but the average marginal effects, while statistically significant, are modest (particularly for the 2007 choice cohort). It is somewhat speculative to consider what would have happened had the state not offered a transfer bonus to teachers in 1997, since the publicity and discussion of the bonus might have generated interest in TRS3 independent of its financial influence, but our estimates suggest that a great majority of those receiving the transfer bonus would have transferred to the new hybrid system even had the bonus not been offered.
Our analysis is one of the first studies to incorporate a direct measure of employee productivity into pension choice and we find evidence that more effective teachers are more likely to choose the hybrid pension plan. The general popularity of the hybrid system and the findings on teacher effectiveness provide suggestive evidence that the pension reform in Washington might increase the quality of recruits to the teacher workforce (at least as measured by value-added) by making compensation structures more desirable to high-performing teachers. That said, we wish to be cautious about this conclusion since the teachers for whom we have a performance estimate represent only a small slice of the workforce, and these findings may not generalize to the workforce in general. Moreover, the quality of the workforce could also be affected by impacts of the pension system on teacher retention (Koedel et al., Reference Koedel, Podgursky and Shi2013).Footnote 28
Policy debates about public pension system reform tend to be contentious and polarizing. This is unfortunate because the experience in Washington State demonstrates that traditional pension systems can be restructured in ways that are desirable to both employees and states. The majority of employees in our analysis exhibit a preference for the hybrid plan. At the same time, this plan is desirable from the state's perspective in that it lessens its exposure to investment risk and the potential for future funding shortfalls.
Appendix
Appendix A: Calculation of Relative Financial Value
Following several recent analyses of retirement incentives in defined benefit (DB) pensions (Yang, Reference Yang2005; Chan and Stevens, Reference Chan and Stevens2008; Costrell and Podgursky, Reference Costrell and Podgursky2009), we approach the comparison of relative pension plan value in terms of the net present value (NPV) of pension wealth provided by selecting TRS2 or TRS3. Putting pension value in NPV terms expresses estimated DB and defined contribution (DC) pension benefits as lump sum values that are comparable at the point in time that teachers are making a pension choice. We calculate the NPV of TRS2 and TRS3 for each teacher and each potential tenure length and solve for the internal rate of return on DC assets that would equate the NPV of the two plans.
(i) Net present value of TRS2
An enrollee earns the right to an annual benefit defined by the level of experience accrued at the time of separation (SCY S) and average final compensation at the time of separation (AFC S):
 $$B_t (TRS2) = 2\% \cdot SCY_S \cdot AFC_S \cdot \mathop \prod \limits_{65}^{A_t} (1 + COLA_t ),$$
where the size of the benefit is increased by a cost of living adjustment indexed to inflation (COLA t). The NPV of the benefit is equal to the total stream of benefits received in retirement (discounted by inflation and mortality probability) less the stream of contributions paid into the plan (also discounted by inflation):
 $$NPV(TRS2) = \mathop \sum \limits_{t \,=\, 65}^{110} B_t (TRS2) \cdot P_{A_t \vert A_0} \cdot (1 + r)^{(A_0 - A_t )}, $$
 $$ - \sum\limits_{t \,=\, {A_0}}^{{A_s}} {Cont{r_t} \cdot Sa{l_t} \cdot {{(1 + r)}^{\left( {{A_0} - {A_t}} \right)}.}} $$
The variable A 0 is age during the pension decision, A s is age at separation, r is the rate of inflation, and P A t|A 0 is the probability of surviving to age t given one's current age.Footnote 29 The contribution rate, Contr t is determined by the state, and contributions made prior to the pension decision (1997 cohort only) are considered a sunk cost and excluded from the calculation. Teachers are assumed to begin collecting retirement benefits at age 65.Footnote 30
(ii) Net present value of TRS3
The NPV of the DB component of TRS3 is calculated similarly to the TRS2 benefit, but with two important differences. First, the multiplier on the DB portion of the pension plan is 1% rather than 2%. Second, when a teacher separates with 20 or more SCY the size of the TRS3 DB increases by approximately 3% during each year between separation and retirement:
 $$B_t (TRS3) = 1\% \cdot SCY_S \cdot AFC_S \cdot \mathop \prod \limits_{65}^{A_t} (1 + COLA_t )\quad {\rm if}\quad SCY_S \lt 20,$$
 $$B_t (TRS3) = 1\% \cdot SCY_S \cdot AFC_S \cdot (1 + 0.03)^{(65 - A_S )} \cdot \mathop \prod \limits_{65}^{A_t} (1 + COLA_t )\quad {\rm if}\quad SCY_S \ge 20.$$
The NPV of TRS3's DC component is evaluated at age 65 (discounted by inflation and survival probability) and the contributions are evaluated in the time period in which each is made:
 $$NPV(DC) = \left[ {\mathop \sum \limits_{t \,=\, A_0} ^{64} Contr_t \cdot Sal_t \cdot (1 + inv)^{65 - t}} \right] \cdot (1 + r)^{(A_0 - 65)} \cdot P_{A_{65} \vert A_0}, $$
 $$ - \sum\limits_{r \,=\, {A_0}}^{64} {Cont{r_t} \cdot Sa{l_t} \cdot {{(1 + r)}^{\left( {A - {A_t}} \right)}.}} $$
We assume that teachers contribute 5% of total salary (the default and most common option), which is assumed to grow at a rate of 3%. The variable inv is the constant annual rate of return on investments.
The value of TRS3 is more complicated for teachers in the 1997 cohort. For these teachers we must incorporate the value of accrued contributions made to the TRS2 account that are transferred into the DC component of TRS3 along with the transfer bonus payment. In the choice-period year, where t = A, we modify the calculation of NPV(DC) for teachers in the 1997 cohort:
 $$NPV(DC)_{1997} = \left[ {\mathop \sum \limits_{t \,=\, A_0} ^{64} Contr_t \cdot Sal_t \cdot (1 + inv)^{65 - t} + trans \cdot (1 + inv)^{(65 - A_0 )}} \right] \cdot $$
 $$(1 + r)^{(A_0 - 65)} \cdot P_{A_{65} \vert A_0} - \mathop \sum \limits_{t \,=\, A_0} ^{64} Contr_t \cdot Sal_t \cdot (1 + r)^{(A - A_t )}, $$
where
 $$trans = (1 + Bonus) \cdot \mathop \sum \limits_{t \,=\, A_0 - A_H} ^{A - 1} Contr_t \cdot Sal_t \cdot \left( {1 + \displaystyle{{0.055} \over 4}} \right)^{4(A - t)}, $$
and Bonus is the size of the transfer bonus payment (paid as a percentage of accrued teacher contributions), and A H is the teacher's age when hired. Teacher contributions into TRS2 accrue interest at a fixed rate of 5.5% compounded quarterly. The size of the transfer can be calculated with some precision using individual salary data from the S275 administrative data (which dates back to the 1985 school year).Footnote 31
(iii) Pension value parameters
A number of the parameters that enter into the pension wealth calculations are not directly observable. In our teacher-level estimations of pension value we make assumptions about these parameters based on what we think teachers’ expectations may have been when choosing a pension plan. Table 3 lists the values assumed for these parameters. We rely on several documents provided to teachers by DRS to inform our assumptions: TRS2 to TRS3? A Guide to Your Transfer Decision (Educational Technologies 1996), Plan Choice Booklet: 90 Days to Choose your Plan (Washington DRS 2011), and an online pension wealth calculator (ICMA-RC, 2012).Footnote 32 In the table below, we refer to these documents as ET (1996), DRS (2011), and ICMA (2012).
Table A.1. Assumptions in calculation of the NPV of TRS2 and TRS3 pension wealth

(iv) Expected internal rate of return
For each potential teacher-separation year, we generate an [n × 1] vector of relative pension values for each teacher, where n = 65−A 0, and A 0 is current age. The relative pension value we use is the internal rate of return (IRR), which is calculated for each teacher as the constant rate of return earned on DC assets required to satisfy the equality: NPV TRS3 = NPV TRS2, where NPV * is the net present value of the pension plan at the point in time in which a pension choice is being made.
Expected relative financial values of the pension plans are obtained by calculating the weighted sum of the vector of relative financial values for each teacher and financial measure. Following Koedel et al. (Reference Koedel, Podgursky and Shi2013), the relative value measure for each teacher-separation year is weighted by the probability the teacher will separate in that year, given his or her current age and level of experience. To calculate the probability of exiting at a given age, we first estimate a discrete hazard model of teacher attrition from Washington State public schools using data on teachers from 1989 to 1996 for the 1997 cohort and 1989 to 2007 for the 2007 cohort. We model teachers’ first spell teaching in Washington state public schools using the binary outcome model:
 $$Pr (Y_{at} = 1\; \vert A = a,\,T = t) = F(\lambda _a + \; \gamma _t + \epsilon _{at} ),$$
where Y is an indicator that the teacher exits the Washington public school system at the end of the school year, T is an indicator for preparation program, γ t is an experience fixed effect, and λ a is an age fixed effect. We assume a constant hazard for 11 or more years of experience and for teachers aged 25 or less. We then calculate the probability of separation at each age for teachers in each cohort with the assumption that all remaining teachers retire at age 65.
Appendix B: Value-Added Models of Teacher Effectiveness
The models presented in Table 4 utilize value-added scores estimated using the model described in equation (B.1), with standard errors estimated using Empirical Bayes procedures as described in Aaronson et al. (Reference Aaronson, Barrow and Sander2007).
 $$A_{ijkst} = \alpha A_{i(t - 1)} + X_{it} \beta + C_{\,jt} \gamma + \tau _j + G_{it} + \varphi _t + \varepsilon _{ijkst}. $$
In (B.1), i represents students, j represents teachers, k represents schools, s represents subject area (math or reading), and t represents the school year. Student achievement is normed within grade and year, and A ijkst, is regressed against the following: prior student achievement in math and reading, A i(t−1); a vector of student and family background characteristics (e.g., race and ethnicity, special education status, gifted status, and free or reduced-price lunch status), X it; class size (C jt); grade effects (G it); and year effects (φ t) The remaining teacher fixed-effect (τ j) is the VAM estimate for teacher j pooled across all years the teacher is observed in the dataset.
In Table B.1 below, we present additional results utilizing value-added scores estimated using the models in equations (B.1) as well as (B.2)–(B.4). The estimates presented in Table B.1 are from the earliest year available, which is the year closest to the point in time when a pension choice was made. The model described by equation (B.2) modifies equation (B.1) by dropping school and classroom-level variables, controlling only for student covariates. This specification is used in columns 2 and 6 of Table B.1.
 $$A_{ijkst} = \alpha A_{is(t - 1)} + X_{it} \beta + \tau _{\,jt}^n + \varepsilon _{ijkst}. $$
The model described by equation (B.3) modifies (B.1) by adding a school fixed effect, λ k. The teacher fixed effect is then measured relative to other teachers in the same school. This specification is used in columns 3 and 7 of Table A.4.
 $$A_{ijkst} = \alpha A_{i(t - 1)} + X_{it} \beta + C_{\,jt} \gamma + \tau _j + G_{it} + \varphi _t + \lambda _k + \varepsilon _{ijkst}. $$
The model described by equation (B.4) substitutes a student fixed effect for the observed student covariates in the first model. This specification is used in columns 4 and 8 of Table B.1.
 $$A_{ijkst} = \alpha A_{i(t - 1)} + \eta _i + C_{\,jt} \gamma + \tau _j + G_{it} + \varphi _t + \varepsilon _{ijkst}. $$
The student achievement measures are test scores on the Washington Assessment of Student Learning within year and grade, which are standardized by year and grade.
Table B.1. Average marginal effects of teacher effectiveness on pension choice: alternative value-added specifications


