1 Introduction
Annuity markets around the world are playing a growing role in pension provision as defined-contribution personal pension systems are introduced and mature (World Bank, 1994; Holzmann and Hinz, Reference Holzmann and Hinz2005; European Commission, 2009). In the UK, defined-contribution pensions with compulsory annuitization are likely to replace occupational defined-benefit pension schemes altogether in the next few decades (Pensions Commission, 2004, Chapter 3) and large annuity markets such as those in the UK and Chile have been analysed extensively (e.g., Cannon and Tonks, Reference Cannon and Tonks2011; Ruiz and Mitchell, Reference Ruiz and Mitchell2011). In much of continental Europe, however, generous public pensions are likely to dominate pension provision for a significant period and defined-contribution pensions are being introduced to complement existing pension schemes (and to compensate for existing schemes being less generous). For example, Germany has a small voluntary annuities market (Kaschützke and Maurer, Reference Kaschützke and Maurer2011), but DC schemes are growing due to the Riester reforms of 2001 (Schnabel, Reference Schnabel2004). In Italy, the TFR reforms of 2004 have resulted in the birth of a small DC pension system with compulsory annuitization of at least part of the pension wealth on retirement (Aben, Reference Aben2011; Rinaldi, Reference Rinaldi2011) and there is continued discussion about how the annuitization option could be improved (Paci et al., Reference Paci, Contaldo, Fiorentino, Nocera, Spotorno and Vallacqua2010). Holzmann and Hinz (Reference Holzmann and Hinz2005) describe how many countries in Central and Eastern Europe introduced defined-contribution pensions to complement existing state pensions after the collapse of communism.
Despite theoretical reasons for believing that annuities can be utility enhancing (Yaari, Reference Yaari1965; Sheshinski, Reference Sheshinski2008), it is well-known result that where annuities are purchased voluntarily the market tends to be small (Brown et al., Reference Brown, Mitchell, Poterba and Warshawsky2001). Cannon and Tonks (Reference Cannon and Tonks2008) suggest that plausible reasons for this market failure are either that adverse selection prevents a market equilibrium or that individuals do not fully understand how an annuity works (since annuity purchase is a once-and-for-all decision there is no opportunity for agents to learn about the product). A possible solution to these problems is to make annuitization compulsory, preventing moral hazard, namely individuals deliberately falling back on state benefits, and is a reasonable quid pro quo for tax relief that has been received in the accumulation phase. However, compulsion does not remove all problems and may create additional ones if the market is imperfect (Mackenzie, Reference Mackenzie2006).
Nearly all of these analyses accept that the annuity decision depends on the institutional details of the annuity market and other features of the pensions system. A corollary of this is that studies of different annuity markets allow economists to get a better idea of what is likely to work in practice and in different contexts. Mitchell, Piggott and Takayama (Reference Bateman and Piggott2011) survey ten countries' annuity markets in various stages of development. They draw a distinction between countries with compulsory annuitization (UK, Sweden), countries with mandatory accumulation plans but without compulsory annuitization (Australia, Chile, Switzerland), and other countries in which retirement income depends on traditional social security in which the annuity market is small (Germany, Japan). The Dutch system lies between these, with a pay-as-you-go first pillar and a well-established mandatory occupational second pillar, much like Switzerland (Bütler, Reference Bütler2009), but with only a small annuity market more like Germany (Kaschützke and Maurer, Reference Kaschützke and Maurer2011), even though in the Netherlands annuitization of the small DC pension market is compulsory. Life insurers providing DC pensions and annuities, are also typically involved with the management of the occupational second pillar, so that even though the annuity market is small, these providers will have a sufficient large pool to make idiosyncratic longevity risk negligible.
In this paper, we provide the first empirical analysis of prices in the Dutch annuity market.Footnote 1 Although this market is growing, it is currently a good example of a small mature annuity market existing alongside a large defined-benefit public and occupational pension system. As with the UK, annuitization of personal pensions is compulsory, although participation in a personal pension is voluntary, making it more similar to the system enacted in Italy from 2004. In Section 2, we introduce the Dutch pension system and describe the institutional and qualitative features of the annuity market. Section 3 reports annuity price data for the Netherlands in the last decade and Section 4 reports our money's worth calculations.
2 Description of the Dutch annuity market
The Netherlands has a three-pillar pension system. Pensions in the Netherlands are financed by a PAYG scheme for the state pension and capital-based schemes for the mandatory occupational pension and voluntary retirement savings. The aim of many employees is to have a gross replacement rate at retirement of approximately 70%, which is approximately a net replacement rate of 90% due to tax incentives. The Dutch have a long history in saving for retirement, with the first private pension funds founded in the 19th century.
The first pillar is the state pension (General Old Age Pension Act or AOW) with a yearly premium income of €21 billion in 2011, financed on a Pay As You Go basis. Eligibility for benefits is based on residence and is independent of working history. After living in the Netherlands for 50 years (between age 15 and 65) every citizen receives a full-state pension (€1,501 per month for couples and €1,085 per month for individuals in 2013).Footnote 2 The retirement age is due to increase gradually to 66 by 2019 and 67 by 2023.Footnote 3
The second pillar is the mandatory collective occupational pension scheme, which is based on work history. This second pillar is funded. The yearly premium income of pension funds was €30 billion in 2009 and in 2010 there were a total of 514 pension funds. Pension funds can either manage the pension fund and portfolio management themselves or contract it out to an external implementing body, usually a specialized pension scheme administrator or an insurer. In 2010, 93% of pension fund members belonged to a defined-benefit pension scheme. Only 4.5% of members had a defined-contribution scheme and 2.3% of members had a combination of a defined-benefit and a defined-contribution plan. Dutch law prohibits the commutation of pension entitlements, except for small entitlements (€417 per annum in 2009), which is due to the relative high administrative cost associated with it. Members in DC pension plans are required to use their DC pension capital to purchase annuities, i.e., a lump sum withdrawal is not allowed.
The third pillar is voluntary pension insurance, mainly provided through insurers, although since 2008 tax-exempt accrual pension saving has also been possible through a bank, called ‘banksparen’.Footnote 4 Individuals purchase a capital sum insured before retirement and then convert this to an annuity upon retirement. In the last years of the past decade, some of the capital sum insured products received negative press coverage because of high costs, especially for the included insurance components. After public and political pressure the insurers reached an agreement with the insured to pay back the excessive fees, which had been charged. Another noteworthy change was the introduction of the tax favoured ‘Levensloop’ scheme in the Netherlands in 2005. This scheme allowed for a reduction in savings during periods of low income arising from being in education or having to take care of one's dependant, etc. Although indented otherwise, in practice it was mainly used to finance early retirement through this scheme, which led to regulatory changes to the scheme to reduce that possibility in 2012. Those schemes were mainly managed by pension funds.
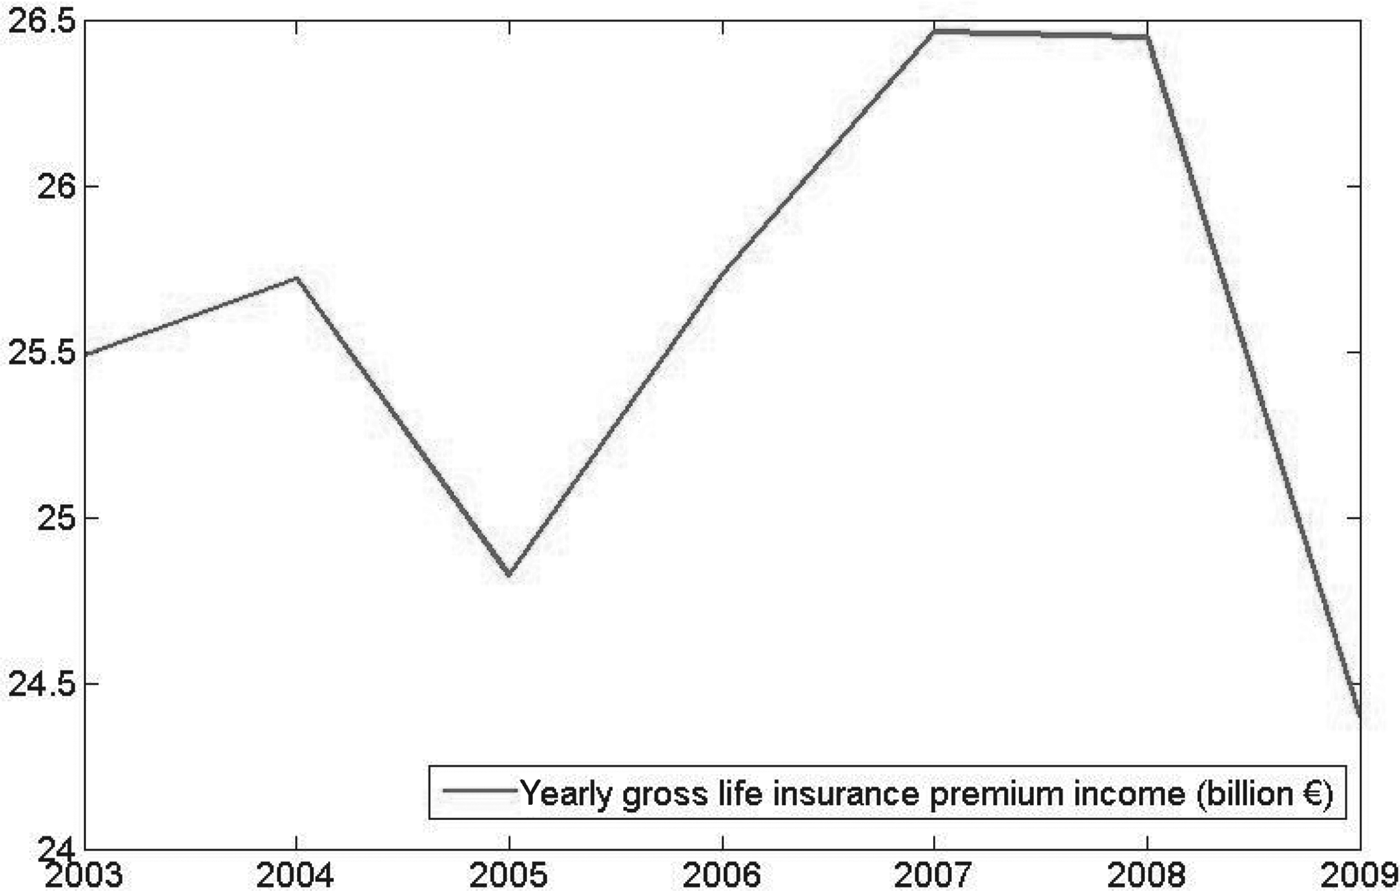
Life insurance companies play a role in the Dutch pension system in both the second and the third pillar. Insurance companies manage approximately 20% of the pension contracts. The third pillar has been managed by insurers only. The yearly gross life insurance premium income is given in Figure 1, and has been about €25 billion during the past decade.

Figure 1. Yearly gross life insurance premium income. Source: Dutch insurance industry in figures, 2005–2011, Dutch Association of Insurers.
Of the €21 billion gross direct life premium business income about €15 billion was from individual policies, and about €6 billion was from group policies. These group policies are mainly due to the management of second pillar pensions. Although the total value of the annuities is almost €36 billion (about 4% of GDP), it is much smaller than the total sum of capital sum insured, which was €658 billion in 2009. Over €29 billion of the annuities are in group insured contracts, of which 44% is unit-linked and 56% is euro insurance. For individual contracts the value of the annuities was over €6 billion Euros in 2009, of which only 11% was unit-linked, the other 89% was euro insurance.
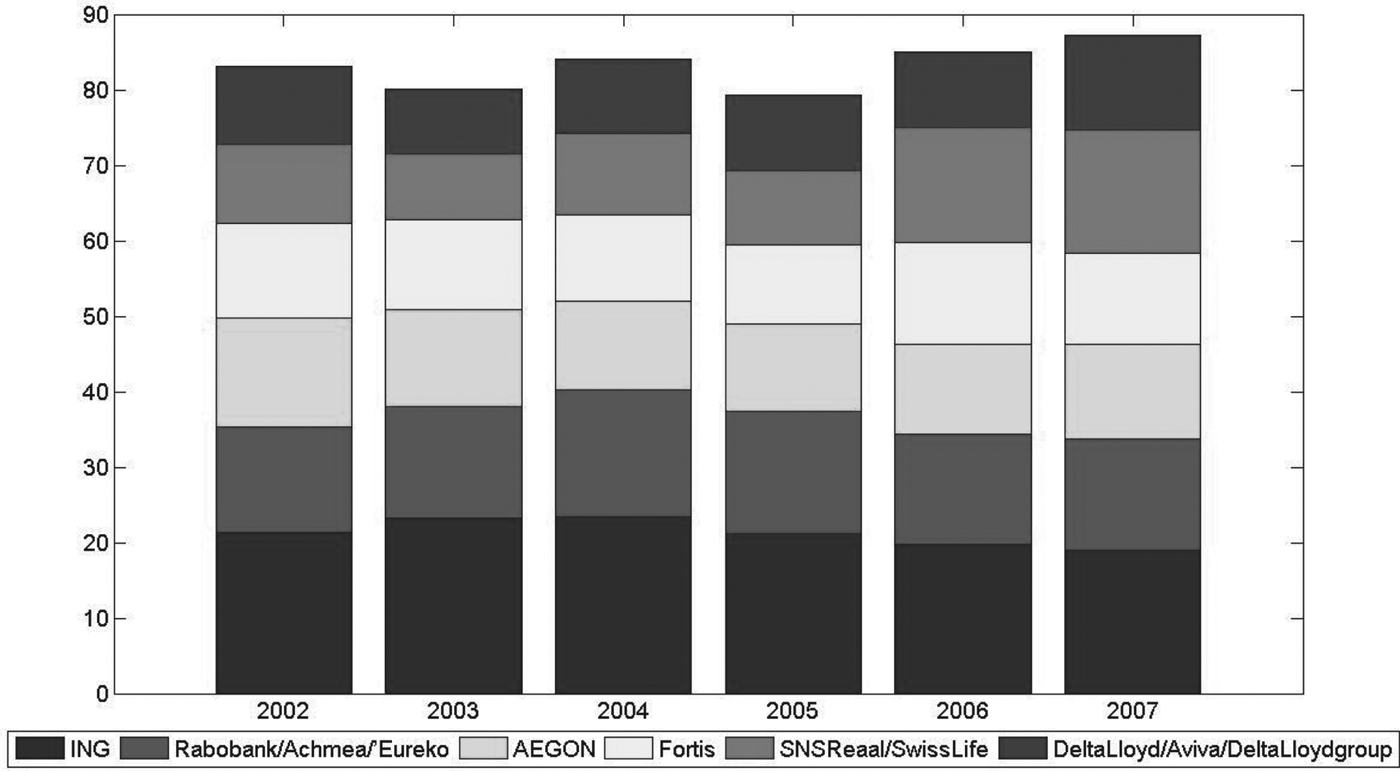
The Dutch life insurance market is dominated by six to eight insurance concerns, which have a market share of about 85%. Figure 2 illustrates the market share of the premium income of the largest insurance concerns during 2002–2007. During that period there have been two mergers between large insurance concerns, namely in 2004 the insurance part of Rabobank merged with Achmea to form Eureko and in 2007 SNS Reaal took over SwissLife. Aside from these mergers, the fluctuations in the share of premium income do not fluctuate too much.

Figure 2. Market share of the premium income of the largest insurance concerns. Source: AM Insurance Magazine, Dutch Central Bank.
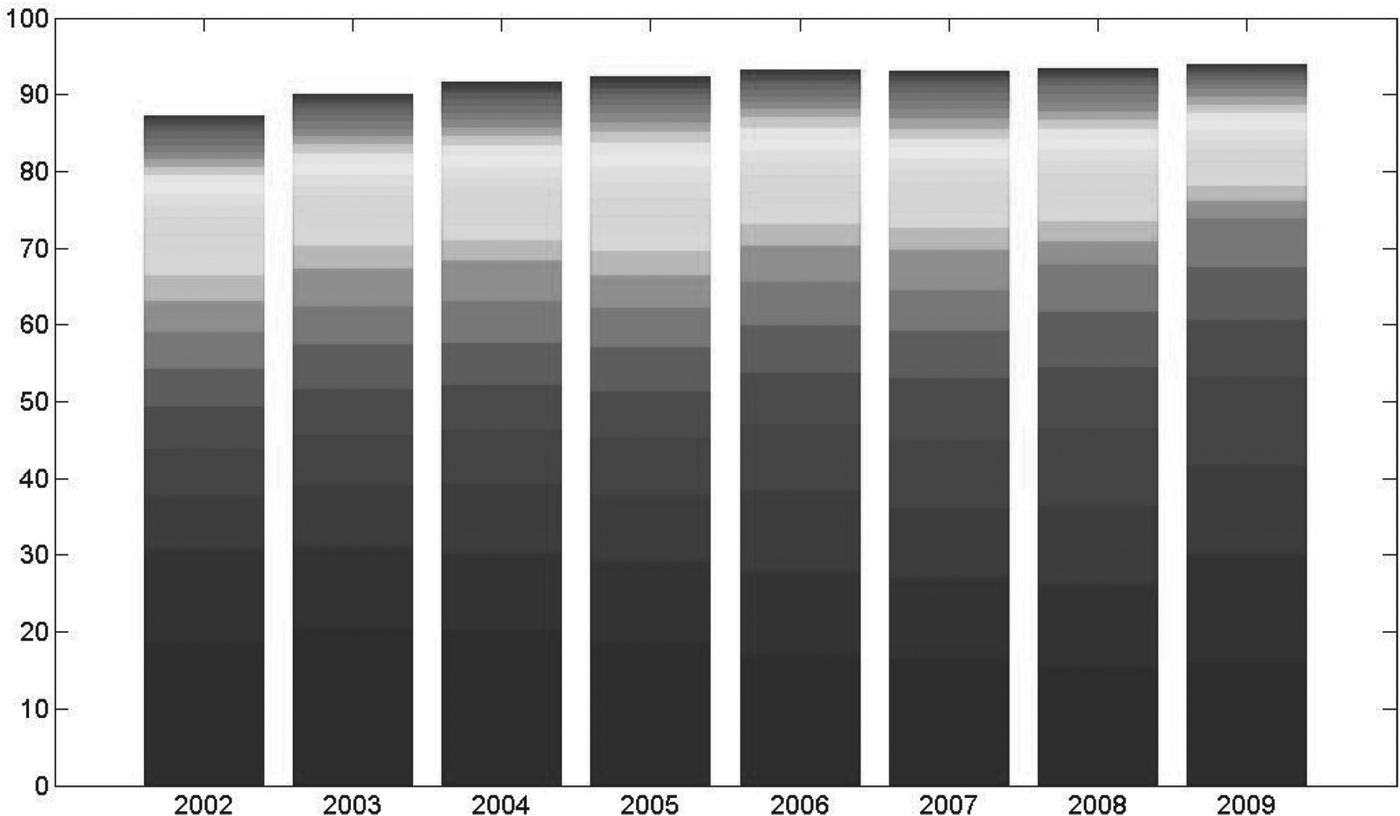
In Figure 3, the distribution of the market share of premium income of the top 25 life insurance companies in the Netherlands is given from 2002 to 2009. From this we see that the top ten life insurance companies have 70–80% of the market share and the top 25 have a combined market share of 88–94%. Moreover, we see that the market share is becoming more concentrated, suggesting the possibility of increased market power.

Figure 3. Market share of premium income of the top 25 life insurance companies. Source: Dutch insurance industry in figures, 2005–2011, Dutch Association of Insurers.
3 Description of annuity price data
All of the annuity prices we analyse here are from the Dutch compulsory purchase market and are for men only (data for women are unavailable). The data were provided by Money View, which is an organizsation collecting annuity rates for price comparisons (see http://www.moneyview.nl/). Annuity prices are reported for a total of 32 different named companies throughout the period, but because some of the companies merged or changed name the total number of actual companies is only 28 and one of these (Univé) only quoted for a short period: the total number of price quotes that we have is illustrated in Figure 4.

Figure 4. Number of firms quoting an annuity rate.
For each firm we have data on purchase prices for men aged 60 and 65 for amounts of €50,000 and €125,000. There are two small structural breaks in 2002 and 2010: before 2002 the annuity rates were for purchase prices in Dutch Guilders, with purchase prices of ƒ100,000 (€45,378 given an exchange rate of 2.20371) and ƒ250,000 (€113,445); in the mid-2010, the annuity rates change from annuities paying quarterly to annuities paying monthly. Annuity rates are conventionally defined as the annual payment relative to the purchase price, and so we use the relevant definitions that
 $${\rm Annuity\ rate} \equiv \left\{{\matrix{{\displaystyle{{4 \times {\rm quarterly\ annuity\ payment}} \over {{\rm annuity\ purchase\ price}}}} \;{{\rm up\ to\ July\ 2010}} \cr {\displaystyle{{12 \times {\rm monthly\ annuity\ payment}} \over {{\rm annuity\ purchase\ price}}}} \; {{\rm from\ August\ 2010}} \cr} } \right.$$
The annuity rates before and after the two potential structural breaks are almost identical, so we do not make further adjustments.
Many life insurance company quotes two prices, an internal price for annuitants who have also saved their pension fund with the company (called ‘maatschappij’) and another external price for annuitants who are transferring their pension fund from another company (called ‘elders’). With annuity prices for two ages, two purchase prices and two types of purchase this means that we have eight annuity prices per firm.
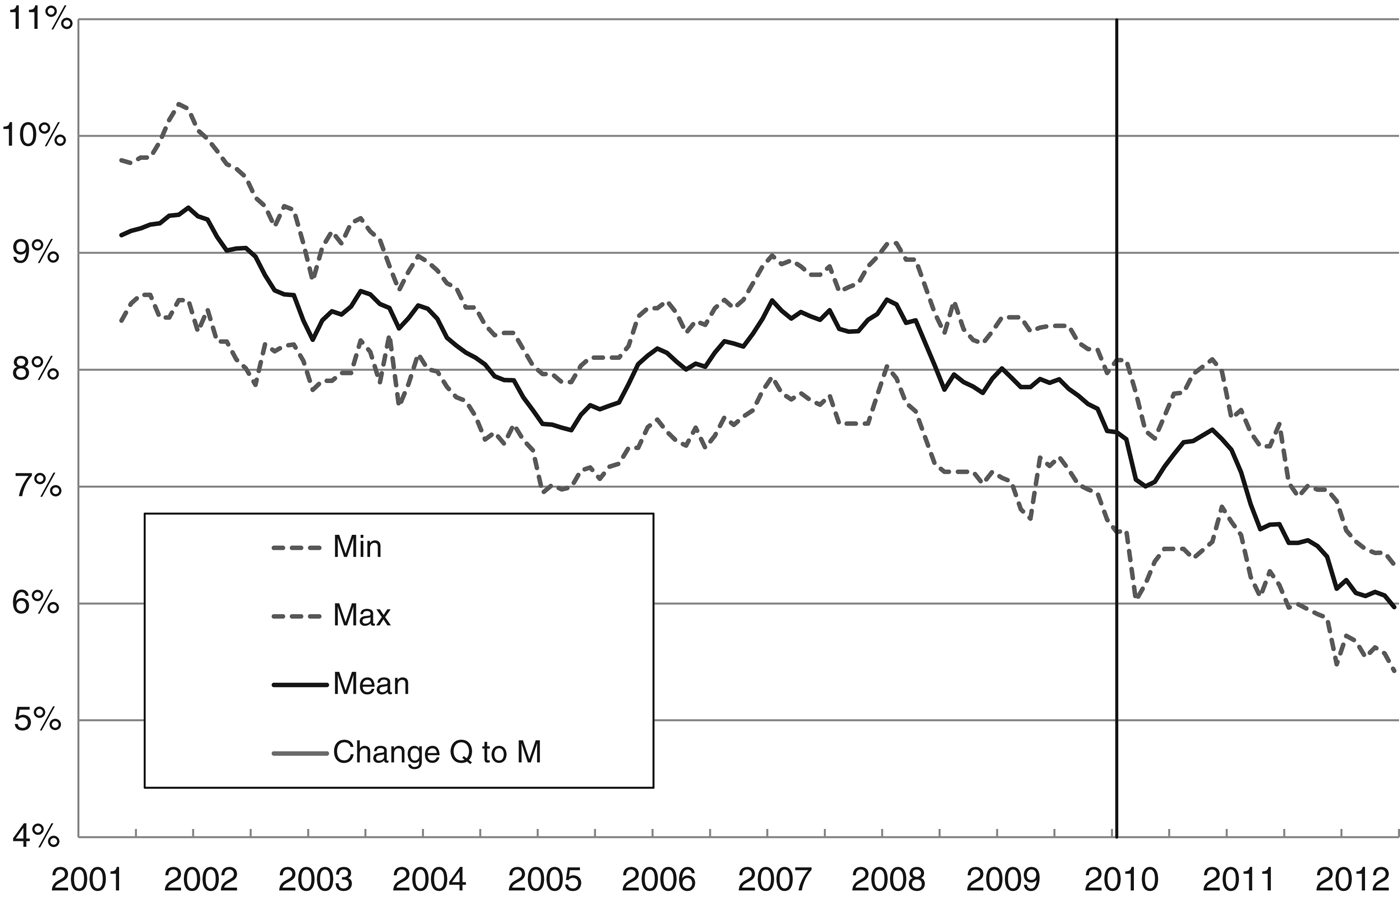
Annuity rates for internal purchase for a 65-year old man with a purchase price of €50,000 are illustrated in Figure 5; the analogous annuity rate for a 60-year old man is almost identical except for being about 1 percentage point lower.Footnote 5

Figure 5. Annuity rates, Male 65, internal purchase (maatschappij): €50,000 purchase price (annuity payments quarterly until 2010, thereafter monthly).
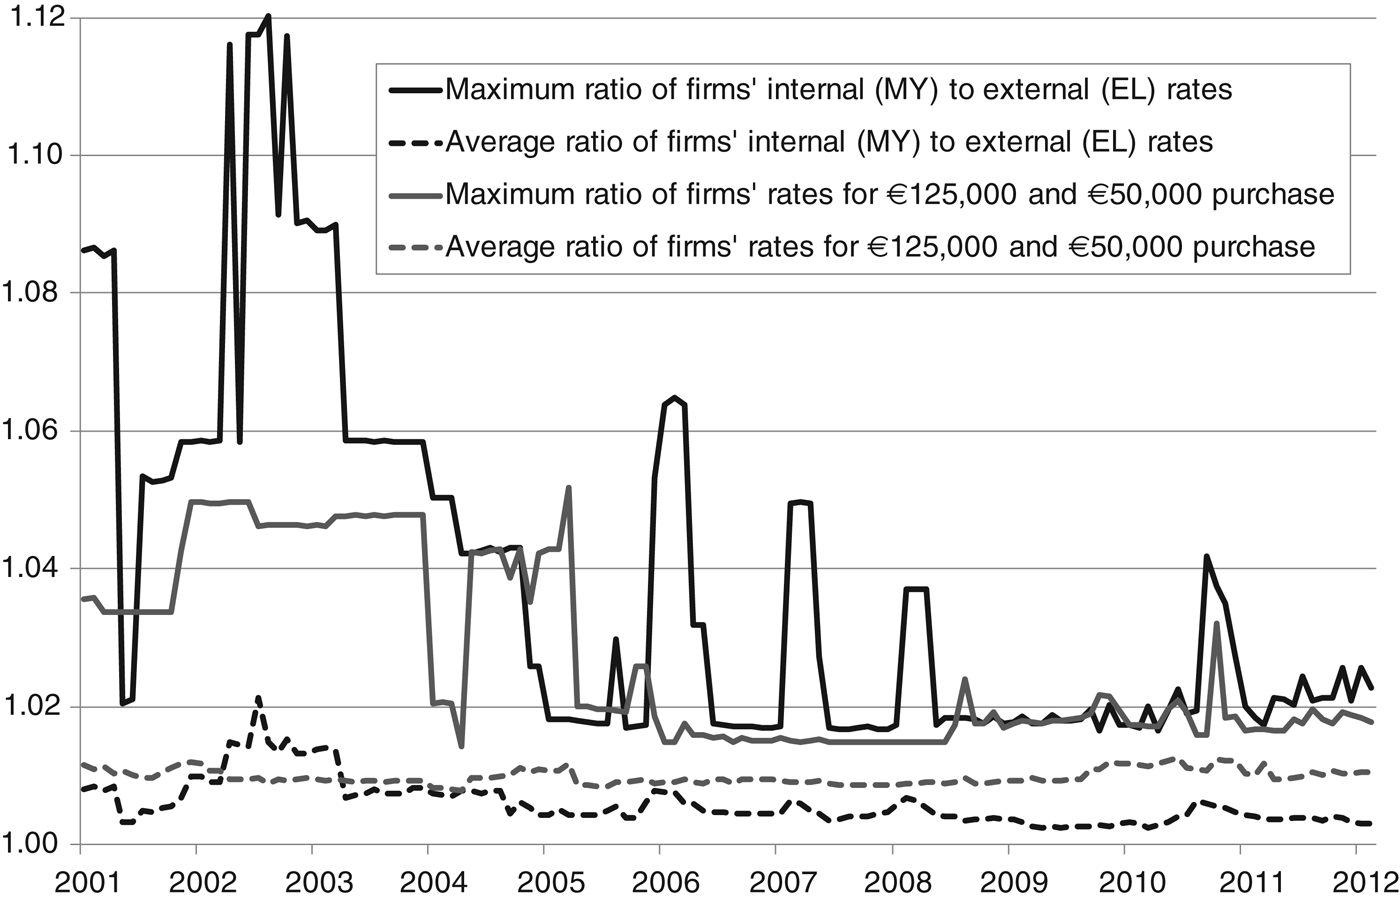
Two issues are how annuity rates depend on the purchase price and internal/external purchase. For each firm we calculate the ratio of the larger purchase price to the smaller and the ratio of the internal to the external purchase price and we summarize the corresponding ratios in Figure 6. The dashed lines show the average ratio across all firms: for the whole period a larger purchase price typically results in an annuity rate about 1% higher (not 1 percentage point) with a similar but smaller effect for internal versus external purchase. However, until about 2005, some firms offered much higher annuity rates for larger purchase prices or for internal purchase. After this time, however, the variation in annuity rate by purchase price became much smaller. This appears to be due to the opening of the pension administrator market to other European institutes. The IORP directive (2003/41/EG), accepted in the European Parliament in June 2003 and had to be implemented before 23 September 2005, resulted in the ‘Pensioen en Spaarfondsenwet’ at 8 February 2006. This led to an increase in competition between the pensions administrators.

Figure 6. Comparisons of firms' different annuity rates.
From Figure 5 it can be seen that the range of annuity rates on offer at any point in time was about 1 percentage point, suggesting that the difference between the best and worst pension income available was quite significant: an annuitant at the company with the lowest annuity rate would have had a pension income up to one-sixth higher if they had been at the company offering the best annuity rate, translating into a difference of €1,250 per year for the larger purchase price. Of course, to move to another annuity provider would have meant facing the external price rather than the internal price. For a 65-year old with an annuity purchase of €50,000 the average benefit over the period from moving company would be €202 per year on a pension income of €4,159; for a corresponding annuitant with an annuity purchase of €125,000 the increase would be €488 on an income of €10,494. This suggests that there are significant benefits from moving company for many annuitants.
We do not have data on the volume of business transacted by the different companies, and so we are unable to calculate a weighted average of annuity rates. The fact that firms frequently change rates is prima facie evidence of competition. There are two further indirect ways that we can judge the competitiveness of the Dutch annuity market.
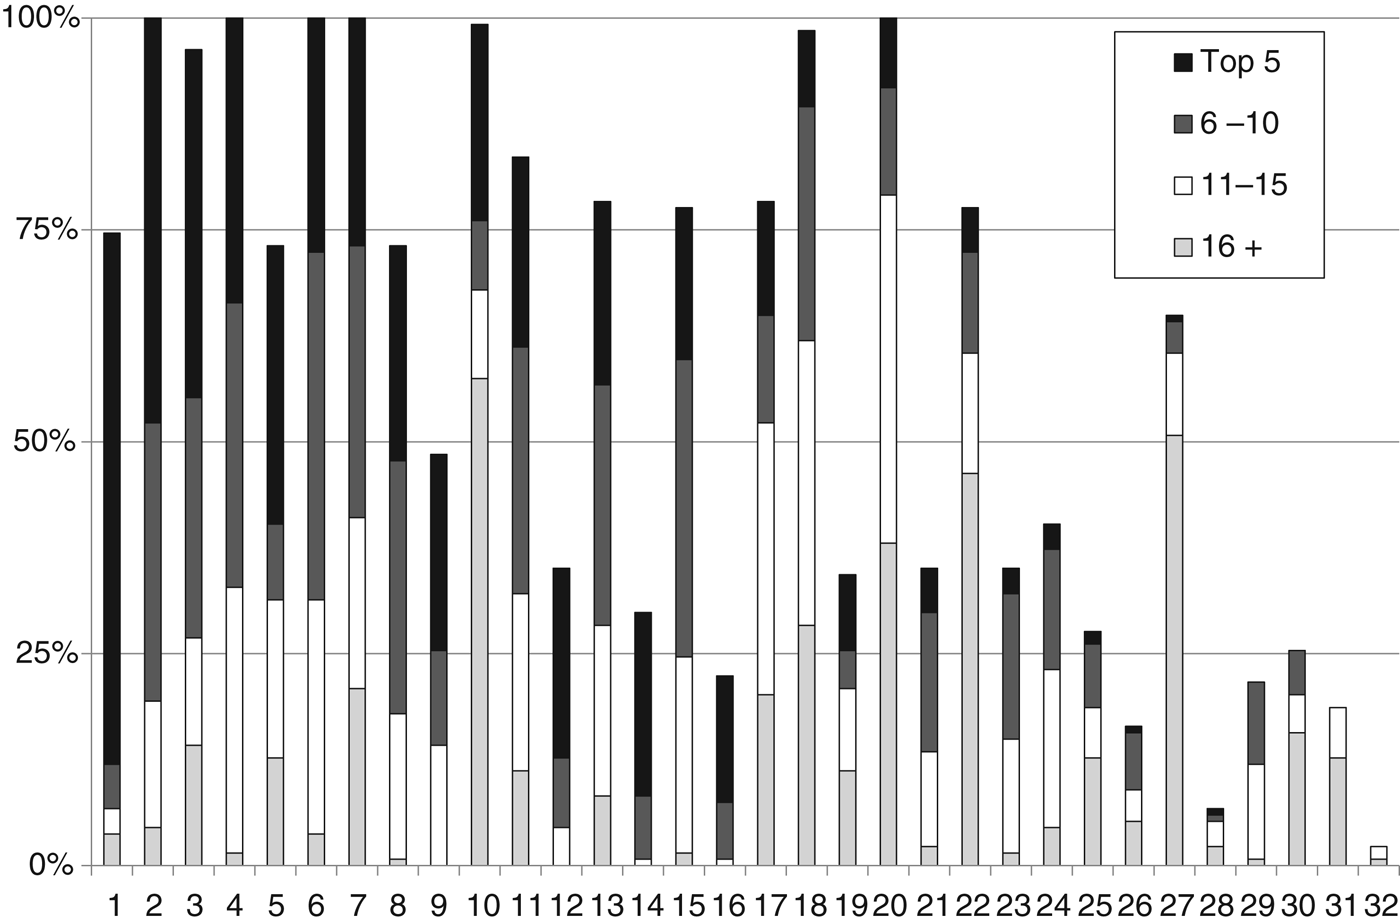
One measure of the competitiveness of a market is the proportion of time that individual firms' annuity rates are high or low compared with the market as a whole. If the relative prices of different firms never changed then that might be taken as evidence that the market was sclerotic, since firms would never be attempting to improve their relative position. Our chosen measure of a firm's relative price is the quartile of prices that the firm's price is in at a given point in time. Figure 7 shows the proportion of the time that companies were at different points in the ranking of annuity rates (companies with very few observations were omitted and companies involved in mergers, takeovers or name changes were treated as one company). The firms are ranked by how often they are in the top five: since some companies leave the industry they sometimes have no ranking The most competitive firm (on the left of the diagram) had a top-five annuity rate in the top for about 63% of the time, but it withdrew from the market altogether in 2011. Clearly some firms were consistently at the top or the bottom of the distribution. However, in the middle of the diagram there are a number of firms whose position changes considerably over the period: a jostling for position which may be indicative of competitive behaviour. With the exception of firm 1, firms with annuity rates that were poor value tended to drop out of the market.

Figure 7. Firms' competitiveness and survival. Graph shows the proportion of time that a firm's annuity rates were in a given position relative to the whole market.
Another measure of competition is the extent to which firms offer better annuity rates to annuitants coming from other companies (external purchase or ‘elders expirerend kapitaal’), which we have already illustrated in Figure 6. Since the internal rates tend to be higher than the external rates, this is evidence against firms competing for additional purchases.
4 Money's worth calculations
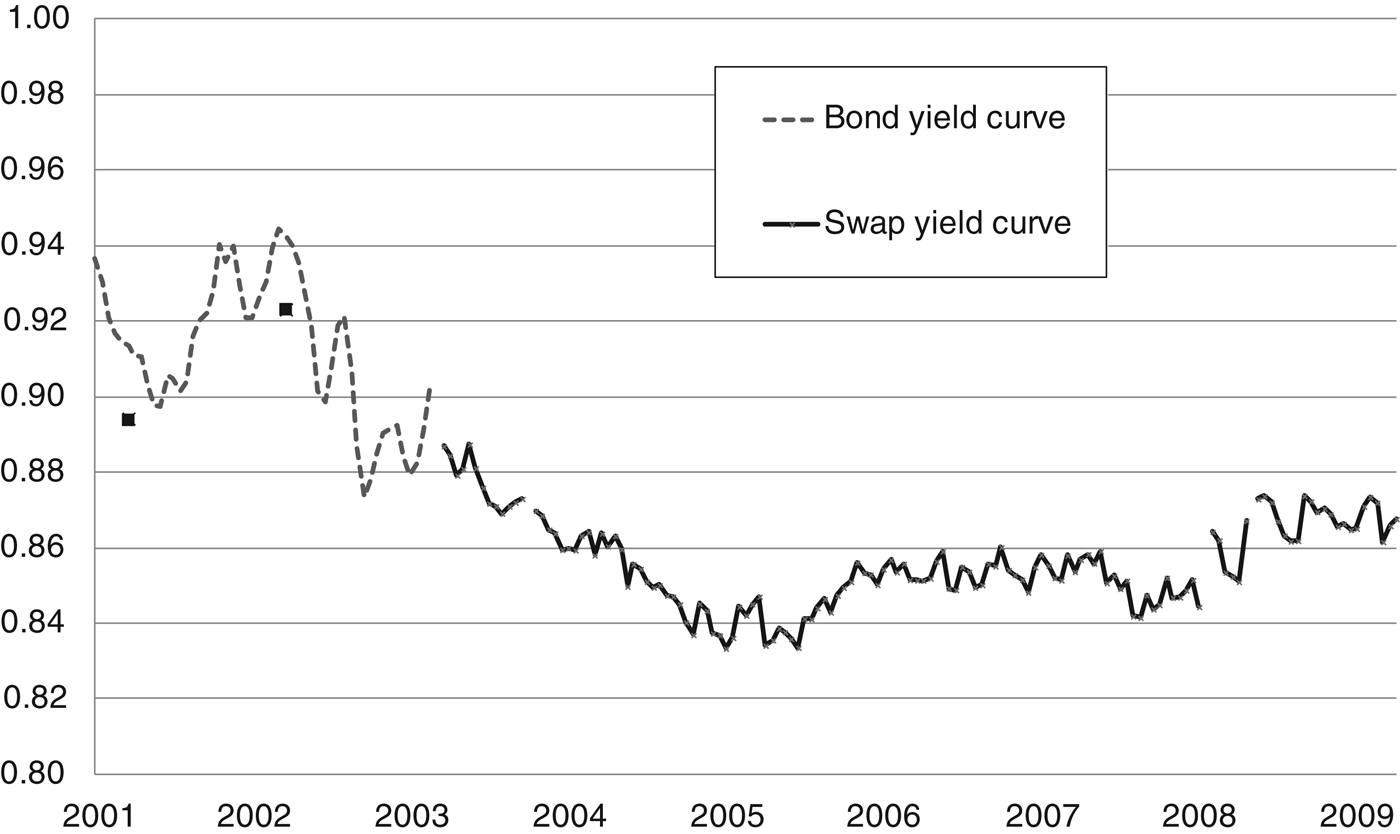
A key determinant of the annuity rate, especially when considering short run movements in annuity rates, is the interest rate. Formally, the annuity rate should be compared with the whole term structure of interest rates, since it consists of contingent payments made at a variety of points in the future. However, for a first look at the data we compare the annuity rate to the 10-year government bond yield, with data on Dutch long-term interest rates taken from Bloomberg. The Bloomberg data are based on interest rate swaps that provide a good indicator of the hypothetical yield on a pure discount bond issued by the Dutch government. Unfortunately these data are available for only two isolated observations in the first few years, so we supplement our data with yields based on 10-year coupon bearing bonds: where a comparison is possible the swap rate is a bit higher. We graph the data for long-term interest rates and selected annuity rates in Figure 8.

Figure 8. Comparison of annuity rates and long-term interest rates. Source: authors' calculations and Bloomberg.
The difference between the annuity rate for 60-year olds and the 10-year bond yield is fairly constant at about 3 percentage points. This is unsurprising: interest rates do not change a huge amount over the period and we should not expect large increases in life expectancy over the relatively short period of 10 years. The sudden drop in yields in the autumn of 2010 coincides with a sudden drop in annuity rates at the same time; so the co-movement is strong at high frequencies.
Apart from data availability, our justification for using the swap curve is based on the regulatory framework in the Netherlands, which is described in Actuariel Genootschap and Actuarieel Instituut (2009) . From about 2003 the swap curve became the official yield curve for valuation of pension fund liabilities under Section 126(2)(a) of the Pension Act. This was because the swap market was highly liquid and rates on swaps were only marginally higher than those on Dutch government bonds (typically 0.1% to 0.2%), resulting in a consensus between the financial regulator and the insurers to use this curve. However, AG&AI (2009) argue that the financial crisis at the end of 2008 led to the swap curve becoming unreliable. Premia on swaps relative to the government curve became highly variable (daily movements of up to 0.5%) and deficient supply of long-dated swaps led to swap yields being lower than bond yields (AG&AI, 2009, Figure 2, suggests the implied yield on swaps was 0.75% lower than on bonds at a term of 30 years). For this reason, the Dutch Central Bank allowed firms to use alternative discount factors from 2009 onwards.
A formal comparison of annuity rates requires the use of the money's worth, which compares the expected present value of the annuity payments to the purchase price. The money's worth is defined as:
where t is the date at which the money's worth is being measured, x is the age of the annuitant, At(x) is the annuity rate, Rt(i) is the discount factor (taken from the yield curve) relevant at time t for a payment at period t+i, and St(x+i|x) is the probability that someone alive at age x in period t will live another i periods.
In our analysis, we use survival probabilities based both on data for the population as a whole and also for pensioners (who are a select group). In each case, survival probabilities are based on predicted 1-year death probabilities from the formula
where qt +j(x+j) is the probability of someone aged x+j in period t+j dying in that period (equivalently, the probability that someone aged x in period t who survives to period t+j then dying in that period). Since survival probabilities are a non-linear function of the mortality, the expected survival probability is not quite the same as the survival probability calculated from the expected mortalities (Cannon, Reference Cannon2009), but we follow the standard actuarial practice in ignoring this issue. To calculate the money's worth we need to evaluate equation (3) using the best information available at time t, but retrospectively it is neither always clear precisely when new data became available, nor how life assurance companies adjusted publicly available information in the light of their own mortality experience.
One possible indicator of the survival probabilities we should use is the fact that the Money View data include an internal rate of return calculation to evaluate annuities (called the ‘effectieve rendement’), which is based on population mortality tables GBM9500 (Actuarieel Genootschap, 2002), which is a simple period life table, so that the money's worth is calculated using
where q*(x+j) is the 1-year death probability for someone aged x+j in period t (not period t+j) and the superscript P emphasizes that this is thus a period table. On this basis, the life expectancy for a 60-year old man would be 78 years, 8 months; the life expectancy for a 75-year old man would be 79 years, 10 months. Our hard copy of the GBM9500 table is dated March 2002, although life assurers may have started using this table before or after that date. On the basis of an international survey, Watson-Wyatt (2006) reports that defined-benefit pension schemes were still using this table at the end of 2005. This is some anecdotal evidence that this is the appropriate table, at least for the beginning of the period under consideration. In Figure 9, we report our money's worth calculations based on this population table. The money's worth has declined over the period, although, some of the apparent decline is because of using different interest rate data early on: recall that we have only two observations of yield data from swaps for the period 2001–2003, which are denoted by the black squares in the figure.
Recall that the money's worth is the ratio of the expected present value of the payouts compared with the purchase price; so in a utopian world the money's worth would equal one. In fact the money's worth should be less than this, both because there are real costs to providing annuities and annuity providers must provide reserves to allow for the possibility that mortality might fall faster than expected. In addition, the results in Figure 9 are subject to two additional problems: they are biased down because we have not taken into account the likelihood of mortality improvements; and they are biased down because annuitant life expectancy is likely to be longer than population life expectancy: annuitants tend to have a higher life expectancy than the population, since individuals with a pension tend to be richer and healthier than average.

Figure 9. Money's worths based on constant GBM9500 mortality table. Calculations based on the Male 65, €125,000, average internal purchase.
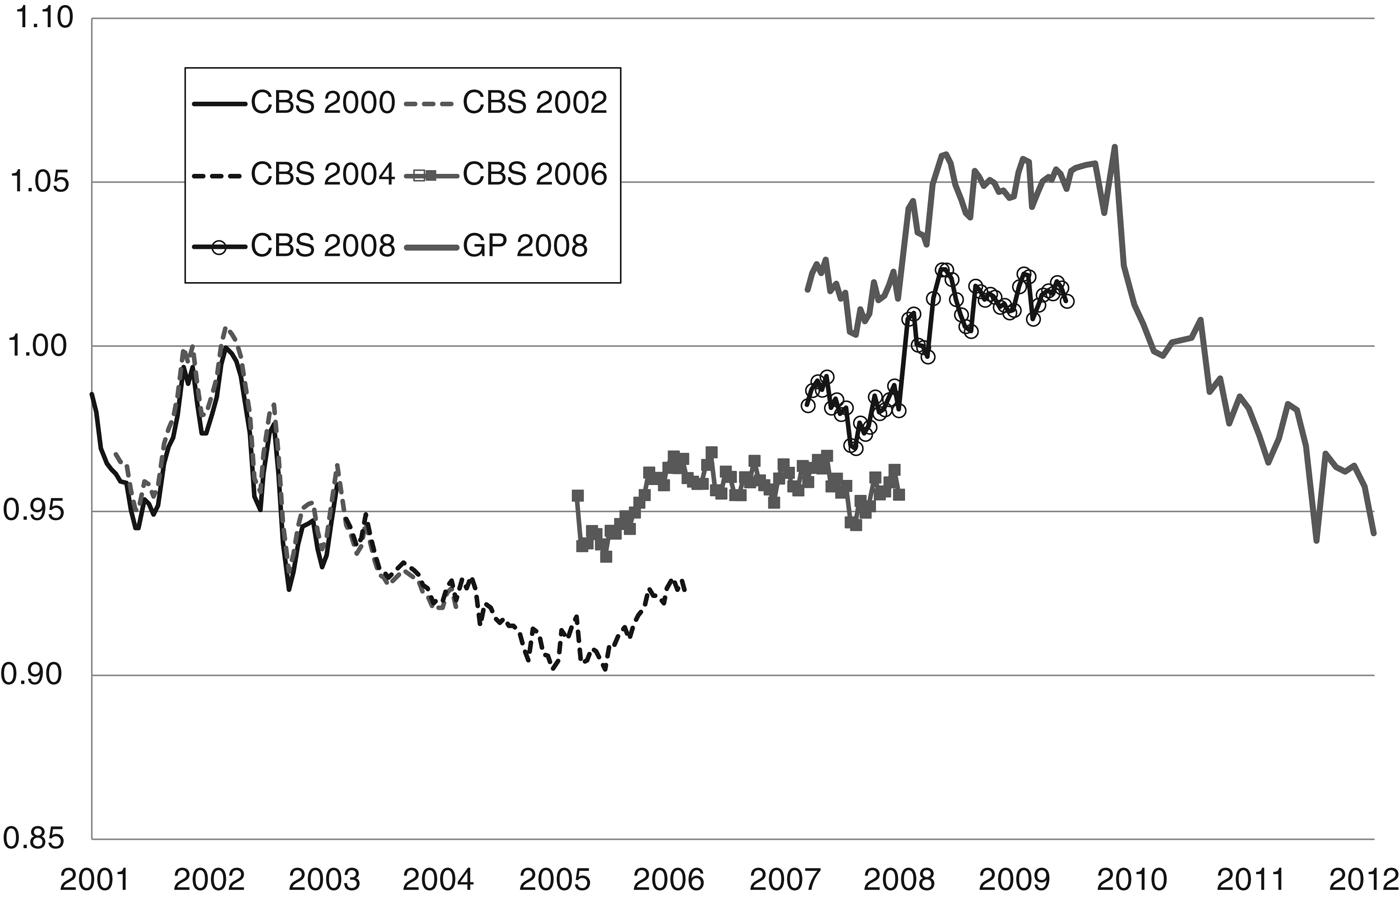
In Figure 10, we use alternative 1-year death probabilities that take account of projected increases in life expectancy. The first set of death probabilities are taken from the CBS 2000 Statistics Netherland table. This table is based on population mortality but has official projections of death probabilities for years 2001–2049. We cannot say with certainty when the information in any of the life tables became available to life insurers (note that life insurers have private information on their own pensioners, which is available earlier than official publications) and so use rough guesses. There was very little change between the CBS 2000, CBS 2002 and CBS 2004 tables and so the calculated money's worths are nearly the same for all three tables. Compared to the GBM9500 table the money's worths are about 5 percentage points higher, due to the incorporation of mortality improvements.

Figure 10. Money's worths based on mortality tables with projected improvements in life expectancy. Calculations based on the Male 65, €125,000, average internal purchase.
The money's worth is initially in the range 0.95–1.0, declining to between 0.90 and 0.93 in 2004–06. However, using updated mortality table CBS 2006 the money's worth rises to 0.95 and the switch to CBS 2008 results in a further rise of the money's worth to about (or even above) unity. These results are similar to those of Cannon and Tonks (Reference Cannon and Tonks2013), where apparent falls in the money's worth based on a particular life table are then revealed to be due to increases in projected life expectancy when a revised life table is published. Furthermore, the fall in the money's worth almost invariably anticipates the publication of the new table, suggesting that life insurers' annuity pricing is based on private information, which arrives earlier than publication of official data.
The final life table that we use is labelled GP 2008, which is based on CBS 2008 with explicit adjustments to allow for longer life expectancy of pensioners than the whole population (Actuarieel Genootschap, 2007, 2010). Using this life table the money's worth is substantially above one, averaging 1.04 and with a maximum of 1.06, suggesting that life insurers are making a loss. There are two possible explanations for this. First, life insurers may be able to earn higher rates of return than on government bonds, perhaps because they are holding corporate bonds, in which case we would be using too low a discount rate in calculating the money's worth. As an ad hoc approach to this problem, we recalculate the money's worth with a discount rates 0.5% higher. This would result in the average money's worth for this period falling to an average of 0.99, with a maximum value of 1.01. Although this still seems very high, James and Song (Reference James and Song2001) note that many countries have high money's worths for annuity products. James and Song (Reference James and Song2001) hypothesize that this is due to firms being able to arbitrage risk by holding risky assets (corporate bonds or even equity) against less risky annuity liabilities and recover the risk premium as profit. This is consistent with regulatory constraints if annuity providers have sufficiently large and diversified portfolios.
Alternatively, it may be that insurance companies sell annuities as a loss and cross-subsidize the product from profits earned in the accumulation phase of the private pension. This would be consistent with many firms offering lower annuity rates to external purchase as firms would only wish to cross-subsidize the existing customers.
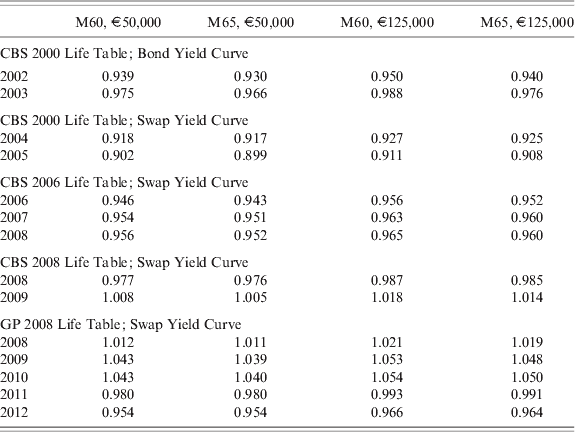
To see the effect of purchase price and age on the money's worth, we report annual average money's worths in Table 1: to save space we only include calculations for selected years and we omit calculations for the CBS 2002 and 2004 tables (as they are almost identical to CBS 2000). The money's worth of an annuity purchase price €125,000 is about 1% higher than for €50,000, which follows directly from the fact that annuity rates are about 1 higher for the larger purchase prices as illustrated in Figure 6. The money's worth for 60-year olds is always higher than for 65-year olds, but rarely by more than 1%, consistent with what Cannon and Tonks (Reference Cannon and Tonks2008) report for the UK, but inconsistent with other results where money's worth declines significantly with age (e.g., Finkelstein and Poterba, Reference Finkelstein and Poterba2002).
Table 1. Annual average money's worths using different mortality tables

5 Summary and discussion
In this paper, we have described the workings of annuity markets in the Netherlands and analysed the pricing of annuity products. Unlike the markets in Germany and Switzerland but like the UK, the Dutch market is a compulsory market in that pension wealth must be annuitized. Unlike the UK market, the Dutch market complements a large funded occupational pension sector and a relatively generous first-pillar pay-as-you-go state pension. The Dutch market is not very large but it is mature and within the context of a large and modern financial sector.
Annuities are purchased out of individual pension funds from life insurance companies and pensioners have the option to move their fund from the company with which the fund was accumulated to an alternative company (an external purchase). Our analysis of prices shows that companies do not offer higher rates to external purchases and so do not appear to be actively competing for business, although there is enough inter-company variation in prices that some pensioners would benefit by moving to a different annuity provider: on average a 65-year old with a pension fund of only €50,000 could still benefit by about €200 per year by moving to the provider with the highest external annuity rate.
Annuity rates move over time with the long-term government bond yield and are typically 4 percentage points higher. A formal evaluation of annuity rates using money's worth calculations depends on the assumptions made about life expectancy. Over the period 2002–2010 projected life expectancy for a Dutch 65-year old male has risen from 15 years and 11 months to 18 years and 4 months, an increase of almost two-and-a-half years, or a 15% increase in the amount of annuity payments that would have to be made. In addition to this, life expectancy of a 65-year old male pensioner is 11 months greater than for an average 65-year old male.
Our money's worth calculations suggest that Dutch annuities are fairly priced, with the money's worth being above 0.9 for the entire period. During the period 2008–2010 the money's worths appear to be greater than one. This may be an artefact of using new mortality tables before they were used by Dutch annuity providers or it may be that Dutch insurance companies felt confident that they could earn higher rates of return than on government bonds, consistent with explanations for high money's worths suggested by James and Song (Reference James and Song2001) . Mitchell et al. (Reference Mitchell, Piggott and Takayama2011) report that MWs in Switzerland and Chile are high which in part explains the large size of the voluntary annuity market in these countries, although Bütler and Staubli (Reference Bütler and Staubli2011) also emphasize that behavioural factors – such as an emphasis on the consumption-frame (Brown et al., Reference Brown, Kling, Mullainathan and Wrobel2008) – are also important. In contrast, the market for annuities in Australia has disappeared, and Bateman and Piggott (Reference Bateman and Piggott2011) argue that this is in part due to a framing effect where financial advisors are incentivized to promote investment-style products. However, high money's worth does not guarantee a large demand for annuities. The voluntary markets in the UK (Cannon and Tonks, Reference Cannon and Tonks2011), Sweden (Palmer and Larson, Reference Palmer and Bo Larsson2011) and Germany (Kaschützke and Maurer, Reference Kaschützke and Maurer2011) are small even though the money's worth of voluntary annuities in each of these countries is high. Our finding of high money's worths in the Dutch annuity market is not surprising in light of this international evidence, although what is more surprising are the sudden jumps in the money's worths when a new life-table is introduced for the second half of the period. We note from the time series patterns that annuity rates and interest rates are declining smoothly and move closely together. So any jumps in money's worths with a new mortality table must be due to revised mortalities being lower. Cannon and Tonks (Reference Cannon and Tonks2008) suggest that as mortality improves, companies continuously update annuity rates, and so money's worths calculated using a given table will appear to decline (because the researcher continues to use an old table); following the introduction by the researcher of a new table reflecting lower mortalities, the money's worth will jump up. For the Netherlands, however, although we observe this pattern for the switch from CBS 2004 to CBS 2006, in the case of the switch from CBS 2006 to CBS 2008 annuity rates, money's worths do not decline in anticipation of the new table. Further, the money's worth appears to increase after the introduction of the new table. This suggests that Dutch annuity providers failed to incorporate new mortality projections in a timely manner in 2008.
We do not have data on a wide variety of annuity types, but what information we do have provides conflicting evidence for the existence of asymmetric information in the Dutch annuity market. Finkelstein and Poterba (Reference Finkelstein and Poterba2002) suggest that the theory of adverse selection predicts money's worths should be lower at higher ages and for larger purchases; on the basis that older persons have better estimates of their own mortalities, and individuals who expect to live longer will annuitize a larger percentage of their pension wealth. Finkelstein and Poterba (Reference Finkelstein and Poterba2002) find this pattern for the UK annuity rates in 1998, although time-series studies for Germany (Kaschützke and Maurer, Reference Kaschützke and Maurer2011), for the UK (Cannon and Tonks, Reference Cannon and Tonks2013) and for Chile (James et al., Reference James, Martinez and Inglesias2006) report a positive relationship between money's worths and age. In these data for the Netherlands, we find that money's worths are higher for larger purchases – in contrast to the adverse selection prediction; although we do find lower money's worths for higher ages – supporting the asymmetric information assumption. So although these data do not allow us to perform powerful tests for adverse selection, what little evidence that they might provide is conflicting.


