


Pension reforms are under way in many countries, including France (Bozio et al., Reference Bozio, Rabaté, Rain and Tô2018). In general, these reforms increase the retirement age and/or the required contribution period for obtaining a full pension, thus strengthening the link between work history and pension level. Their impacts will thus differ by gender, but pension reforms may be more detrimental for women as they generally work part-time and interrupt their careers more often than their male counterparts do, thus making their average earnings and in the end their pensions lower (Ponthieux and Meurs, Reference Ponthieux, Meurs, Atkinson and Bourguignon2015). On the other hand, new generations of women have become more educated and achieved higher rates of participation in the labour market than previous female generations, which should lead to their pensions being higher. As a result of these two diverging trends, the evolution of the gender pension gap – in most countries, women's pensions are on average roughly half that of men (Betti et al., Reference Betti, Bettio, Georgiadis and Tinios2015 for a comparative study, Marin and Zólyomi, Reference Marin and Zólyomi2010), remains uncertain and then deserves to be addressed (Stahlberg et al., Reference Ståhlberg, Cohen, Kruse, Sunden, Gilbert and Parent2006; Bonnet and Hourriez, Reference Bonnet and Hourriez2012a; Vara, Reference Vara2013).
In theory, persistent gender inequalities in pensions are counterbalanced by monetary transfers within the household. The rationale behind this is that the household is traditionally viewed as an economic unity with role specialization, namely that the man serves as the breadwinner while the woman takes charge of domestic chores and cares for the children and/or elderly parents. In this framework, household incomes are pooled together and the lower own pensions received by women are a consequence of having chosen to dedicate their participation to the household. However, changes in family behaviours will also have adverse impacts on the incomes of retired women. The number of separations and of non-marital unions is growing (Bonnet and Hourriez, Reference Bonnet and Hourriez2012b), so the future economic independence of elderly women will be more strongly linked to their own pension entitlements than to their husband's income or to a survivor's pension (reserved for married couples only) if widowed.
This context explains why gender inequality in retirement pensions has become an important issue in research (Ginn et al., Reference Ginn, Street and Arber2001; Jefferson, Reference Jefferson2009) and political debate (OECD 2012; Betti et al., Reference Betti, Bettio, Georgiadis and Tinios2015). These spheres attempt to assess the extent to which the rules of the contributory regime affect women and men differently, depending on their differences in labour market participation. In a context of pension reforms, it is necessary to identify the determinants of the gender gap in pensions and to quantify their relative impacts. Moreover, given the higher risk of poverty among retired women, it is important to focus on the gender gap at the bottom of the distribution in order to assess the role that minimum pension policy plays in reducing this risk.
So far, few studies have sought to quantify the sources of the average gender pension gap, and most of them analyse the mean difference between men's and women's private pension income in terms of pension coverage rates and average pension amount. The strong relationship between the gender pension gap and differences in labour market histories has been proved for the USA (Even and Macpherson Reference Zhao and Zhao1994; Johnson, Reference Johnson1999; Levine et al., Reference Levine, Mitchell and Phillips1999), more recently for Finland (Kuivalainen et al., Reference Kuivalainen, Nivalainen, Järnefelt and Kuitto2018), China (Zhao and Zhao, Reference Zhao and Zhao2018), and on European data (Möhring, Reference Möhring2015). In general, the fact that women's pensions are roughly half those of men is explained by differences in education and career patterns (occupation, employment sector, and length of work history). Bardasi and Jenkins (Reference Bardasi and Jenkins2010) reached different conclusions for the UK, however, attributing the gender pension gap to the fact that women's characteristics are less well rewarded than men's. However, this difference was mainly due to data limitations on earnings histories: the differences in returns on personal characteristics observed in the British case correspond in part to differences in earnings in other studies. In the particular case of Finland, the gender pension gap is less pronounced (women's pensions are three-quarters those of men), due to more gender-equal policies on the labour market; yet, even in this favourable situation, occupational segregation generates gender pension inequalities.
As men's and women's pension distributions also differ in shape, limiting the analysis to the average pension gap provides little information about its components. Yet, the gender differences in pension distributions have rarely been examined. One exception is Hänisch and Klos (Reference Hänisch and Klos2014), who use unconditional quantile regressions to decompose the gender pension gap. In line with the previous literature, they find that it can be explained mainly by differences in labour market and education. They also find that the gap is especially wide at the lower end of the pension income distribution, and that different labour market experiences contribute very strongly to the explained gap for retirees with low pensions.
The present article contributes to this limited literature in three ways. First, we focus on the French case to estimate the relative contributions of contribution periods and earned income to the gender pension gap, looking not only at the mean but also at different points along the distribution. Second, we identify the levels of the distribution at which minimum pensions reduce the gap between men and women. Third, contrary to most studies, our analyses are not limited to the private sector and include public sector retirees. This extension is justified by the large share of the female workforce employed in the public sector and by the fact that the gender pension gap is smaller in the public sector than the private sector.
Different indicators may be used to measure the gender pension gap: pension levels, duration of retirement, duration of earnings history (and contributions) or internal rate of return that sums up these different dimensions. In this article, we focus on the gender differences in pension levels as we are interested in living standards during retirement and aim to analyse how differences in the various components of earnings history translate into differences in pension levels.
We use an extremely extensive database for 2012, which covers all retirees and allows us to trace their working histories and earned wages. This allows us to distinguish between those who worked in the public and the private sectors as well as to know their personal characteristics (current age, retirement age, and origin) and family details (number of children), all of which influence the level of their pensions. In this paper, we focus on the private and public sector wage employees. These data allow us to analyse the determinants of pension levels very precisely and to thereby elucidate the causes of the observed pension gaps between men and women.
We begin by performing a standard mean decomposition, as developed by Oaxaca (Reference Oaxaca1973) and Blinder (Reference Blinder1973). As the distribution of pensions is quite irregular and marked by threshold effects, we describe the factors explaining the pension gap at different points along the distribution. To this end, we use the decomposition method proposed by Firpo et al. (Reference Firpo, Fortin and Lemieux2007, Reference Firpo, Fortin and Lemieux2009). We show that the pension gap in the first deciles is essentially due to differences in contribution periods. This effect gradually weakens and is replaced by differences in the reference wage as the main explanatory factor. We also show that contributory minimum pensions play an important role in limiting the gender pension gap in the first deciles, essentially for the private sector. Last, we find that the configurations differ between the two sectors, with the gender pension gap being much narrower in the public sector. This is because public sector careers are less discontinuous than those in the private sector, and calculation of the reference wage does not penalize career interruptions so heavily. Alongside the factors habitually cited, such as type of occupation (teaching, nursing, administrative tasks), family-friendly working conditions and job security, this relative advantage with respect to the private sector is probably an additional factor that explains women's over-representation in public employment (Blank, Reference Blank1985).
The following section outlines the conceptual framework and the main institutional characteristics of retirement schemes in France (Section Conceptual framework and general approach). We then describe the database and the methodology we use (Section Data and methodology) . A decomposition of mean differences in pensions is presented in Section Results of the decomposition of the average gender pension gap, while Section Results of the decomposition along the distribution presents a decomposition of differences over the whole distribution. The paper ends with a discussion that places our results in the context of the future pension reform in France.
Conceptual framework and general approach
Conceptual framework
We essentially carry on a descriptive analysis of the gender pension gaps by decomposing them in order to identify the contribution to these gaps of the main determinants of retirement pensions (length of working history, reference wage, etc.). The objective is to shed light on the potential evolution of these gaps in the context of future pension system reforms planned in France. However, we do not limit our analysis to the average gaps and we provide a decomposition of the gaps throughout the distribution of retirement pensions. We can thus assess the contribution of differences in length of working history, salary, and retirement age for different pension levels.
Different indicators to measure pension inequalities between men and women
Different indicators may be used to measure the gender pension gap, depending on the dimension in which we want to assess disparities between men and women. Since the 2010 pension reform in FranceFootnote 1 (confirmed by the 2014 reformFootnote 2), one of the objectives assigned to the pension system is to ‘reduce the gender pension gap’. To pursue this objective, different indicators are monitored: differences in pension levels, in the duration of retirement, and in the duration of work history. The first one, we chose to focus on in this article, is in line with our interest in living standards during retirementFootnote 3. The second one, the length of the retirement period is a way to take into account the lifecycle dimension of pensions. It is higher for women compared to men, resulting from two combined elements: the retirement age, with French women retiring currently a bit later than men, and life expectancy, higher for women than for men. This dimension of the life cycle can be extended to the whole work history, and this is the objective of the third indicator, taking into account the length of work histories. Due to the increase in women's labour force participation since the late 1970s, there is a convergence of this last indicator between men and women. These different indicators may lead to different conclusions regarding pension inequalities between men and women. A way to get a global perspective on the differences between men and women is to use a measure to sum up these different dimensions. The internal rate of return (IRR) does so, taking contributions, pension levels and retirement durations into accountFootnote 4. The French literature using the IRR concludes that a gender pension gap exists in favour of women, resulting from fewer contributions paid compared to the pension benefits received. Dubois and Marino (Reference Dubois and Marino2015) also indicate that more than half of the gender IRR gap in France results from differences in life expectancy, with the remaining share coming from non-contributory mechanisms. Higher IRRs are found for women in the lower part of the wage distribution (Walraet and Vincent, Reference Walraet and Vincent2003), largely due to the minimum pension. Some drawbacks of this synthetic measure should be highlighted. Very high IRR may be associated with very small levels of pension, for example for people benefiting from minimum pensions with very low contribution periods or with unemployment periods. Moreover, IRR does not tell anything about pension benefits at retirement and gender differences. Each of these dimensions, and the associated indicators, has its own advantages and limits and we may use each of them to highlight a different dimension of retirement inequalities. In this article, we choose to focus on one of them, the pension level with the objective of linking this level to the different elements of the work history and to analyze how the differences in these components translate into differences in pension levels.
The second important choice we made is to address the gender pension gap only at the individual level and we do not take into account the household dimension, mainly because of the individual dimension of our data (see below). The household dimension is nevertheless important for two main reasons. First, an individual pension is only one component of one's living standard during retirement; other incomes are also important, in particular the incomes of other members of the household (spouse/partner). In the case of couples with full income pooling, gender inequalities at retirement might be linked solely to the degree of homogamy in society (who marries whom) and to the gender differences in the relation between retirement pension and marital status. Second, the pension of one partner, in particular women, may be in part the result of a couple's past choices regarding labour supply or savings behaviour. In addition, research has shown that retirement decisions can be made jointly by the couple, which has an impact on pension levels (Baker, Reference Baker2002; Michaud, Reference Michaud2003; Hospido and Zamarro, Reference Hospido and Zamarro2014). In some cases, as in the case of Belgium, the retirement pensions received by both members of the couple may even depend mechanically on each other (Jousten and Lefebvre, Reference Jousten and Lefebvre2019). Yet, looking at the individual level seems to be all the more important in a context of increasing divorce ratesFootnote 5; uncertainty about the pooling of resources during retirement; and imperfect mechanisms for sharing pension rights between ex-spouses in cases of divorce/separation, the evolution of the benefits linked to couple's situation being currently debated in France (Bonnet et al., Reference Bonnet, Bozio and Tréguier2019).
The French pension system
The French pension system is quite complex, with separate pension schemes for different occupational groups. We present here the main features of this system, with a focus on the private and public employment sectors.
Private-sector retirees receive pensions under several schemes: the General Scheme (‘Régime Général’), often referred to as the ‘basic scheme’; and one or more complementary schemes (ARRCO, for private-sector blue- and white-collar employees; AGIRC, for white-collar employees only; and IRCANTEC for non-titular public sector employees). Retired civil servants receive their pensions from one of two schemes, depending on their former employer: the State Pension Service (SRE), for those employed by the central government; and CNRACL, for those employed by local authorities and public hospitals. As the principles of career development and pension calculation are similar, all public sector retirees will be grouped together.Footnote 6 There are a number of other pension plans, particularly for self-employed people, but they are not included in our study because of the great difficulty in estimating members' lifetime earnings. Retirees who have spent their entire working lives in one sector are called ‘single-sector retirees’ (monopensionnés), while those who have worked in several sectors and therefore receive pensions from more than one scheme are called ‘multi-sector retirees’ (polypensionnés).
The minimum retirement age in the private sector is 60 years.Footnote 7 In the public sector, it is also 60 years in most cases but is reduced to 55 years for some groups of workers and even to 50 years for certain very physically demanding occupations.Footnote 8 Note that, before the 2010 reform, in order to receive a pension from one of the public sector schemes, the minimum contribution period was 15 years (it is now 2 years). Below this cut-off point, the corresponding pension is paid out from the private wage sector scheme, even for employees who contributed to a public sector scheme.
The pensions received under the General Scheme (private sector) are calculated as the product of three terms: a rate; a prorated coefficient that reduces the pension proportionately when the contribution period is shorter than the duration required for a full pension; and a reference wage.
More specifically, the pension formula before the 2010 reform was as follows:

The terms in the first bracket give the rate. The full rate is 50% (when d = s = 0). The rate is reduced (d > 0) for people who either retire before age 65 (see footnote 7) or do not have enough quarters of contributions for a full pension (D required). The penalty is proportional to the time missing relative to the requirements for the full rate, that is, the number of quarters still needed to either reach age 65 or to attain the required number of quarters of contributions, which depends on the birth cohort. The maximum number of missing quarters considered is 20, corresponding to the 5 years between age 60 (the minimum retirement age) and age 65 (the full-rate age). The rate reduction d for one missing quarter varies between 1.25% (cohorts born after 1953) and 2.5% (cohorts born before 1944)Footnote 9, depending on the birth cohort; so the rate (50% × (1 − d) ) is between 25% and 50% for cohorts born before 1944, and between 37.5% and 50% for cohorts born after 1953. Since 2003, workers who retire after reaching the minimum age and the required number of quarters of contribution receive a bonus that depends on the number of quarters worked after fulfilling the two conditions (s > 0). Finally, to calculate the full rate, the number of quarters considered is the number acquired under all basic schemes, but with a maximum of four quarters per calendar year.
It is important to note that a quarter is not defined as a duration in the private sector: a worker acquires a quarter as soon as he or she has made contributions corresponding to 200 hours (150 since 2014) at the minimum wage.Footnote 10 In several other schemes, particularly in the public sector (see below), quarters correspond to periods actually worked. This is particularly important for women, as they more often work part-time. This calculation method offsets the impact of part-time work on the durations used to compute pensions.Footnote 11
The second term is the prorated coefficient. This is based on the number of quarters acquired under the scheme (D scheme). Note that in addition to quarters of actual employment, this number may also include quarters awarded for periods of unemployment, sick leave or maternity leave. In addition, mothers’ contribution periods are increased by one quarter for each year devoted to bringing up a child, up to a maximum of eight quarters per child. They are not conditional on any career break, are not linked to a particular year, and are added to the total number of quarters when the mother retires.
Finally, the third term (w ref) is the reference wage. It is calculated as the average of the worker's highest yearly wages capped by the Social Security ceiling (€36,372 per year in 2012 and €39,732 in 2018) and adjusted for inflation. A total of between 10 and 25 years are taken into account, depending on the birth cohort (Bonnet et al., Reference Bonnet, Meurs and Rapoport2018).
This pension is complemented by one or several complementary schemes. All compulsory complementary schemes in the private sector are points-based schemes in which the pension is equal to the number of ‘points’ acquired by the worker, multiplied by the value of the point. The number of points acquired in a given year is equal to the product of the employee's wage and the contribution rate of the scheme divided by the ‘price’ of a point defined by the scheme. Complementary pension schemes may represent a large share of the total pension for employees with high wages. This is because the basic pension scheme is capped at 50% of the Social Security ceiling, while the complementary schemes allow individuals to contribute up to eight times the social security ceiling. Employees who retire without the full rate receive only a proportionate fraction of the number of points.
In the public sector, the pension is basically the product of the reference wage, which is: the wage earned in the last position held (for at least 6 months), excluding bonusesFootnote 12; the level of the maximum rate (the ‘full’ rate, generally 75%, but up to 80% in some cases, particularly for parents of several children); and a factor that measures duration in the scheme (D scheme) in comparison to a reference duration (D required). Before the 2003 reform, the formula was the following:

The general pattern of the formula is now similar to that of the private sector, although the parameters differ.

Note that the full pension rate is 50% under the General Scheme and 75% for civil servants. While it is lower in the basic scheme for private-sector workers, they also receive additional pensions from complementary schemes.
In both the private and public sectors, most parameters vary according to the birth cohort, generally with the aim of encouraging people to delay retirement. In particular, the reforms adopted since the early 1990s in the private sector and since 2003 in the public sector have gradually increased the contribution period required for a full pension (D required).
Minimum pensions and pension entitlements linked to family situation
These schemes are backed up by two main public policies: minimum pensions and pension entitlements linked to the family situation (bonus for children and survivor's pension). These policies affect pension levels and are intended to limit pension inequalities.
The General Scheme for private-sector employees guarantees a minimum pension to retirees who are entitled to a full pension, that is, those who retire at age 65 or whose contribution period exceeds the requirement for a full pension after counting all the sectors they have worked in. If an individual's pension rights fall below this minimum, their pension is brought up to the minimum and is thus called the ‘contributory minimum’ (minimum contributif). The full contributory minimum is paid to retirees who satisfy the contribution period requirement for a full pension. The contributory minimum is prorated for retirees with a shorter contribution period. Note that the minimum pension pertains only to the basic scheme (General Scheme), not the complementary schemes (although white-collar workers in the AGIRC scheme receive a minimum number of points each year).
There is a similar mechanism called the ‘guaranteed minimum’ (minimum garanti) for civil servants. Until the 2003 reform, the guaranteed minimum was granted in full to retirees with 25 years or more of service, and a partial minimum was paid to retirees with between 15 and 25 years of service. With 15 years of service, civil servants were entitled to 60% of the full guaranteed minimum. This contrasts with the private-sector contributory minimum, which is proportional to the individual contribution period. In order to move towards harmonization of private and public sector rules, the 2003 reform increased the contribution period required for a full public sector minimum pension from 25 to 40 years. As of 1 January 2013, civil servants with 15 years of contributions in the public sector get 57.5% of the full guaranteed minimum. The minimum increases by 2.5 percentage points per year for each additional year up to 30, and by 0.5 percentage points for each year above 30, reaching 100% of the minimum for 40 years of service.
The original rationale for minimum pensions was quite different in the public and private sectors. The contributory minimum in the private sector was originally designed to enhance pensions for workers with long work histories and low wages, while the guaranteed minimum in the public sector was designed to increase pensions for civil servants with short careers. The pensions of those with long careers, calculated as a proportion of the end-of-career wage, rarely fall below the guaranteed minimum.
Finally, pension rights linked to retirees’ work histories can be supplemented by rights linked to their family situations. A pension bonus is awarded to parents who have brought up three or more children. The bonus depends on the scheme and may vary with the number of children. In the General Scheme, it is 10%. The ARRCO private-sector complementary scheme awards a 5% bonus for three or more children; the AGIRC private-sector complementary scheme gives 8% for three children, plus 4% for each additional child, up to a maximum of 24% for seven or more children.Footnote 13 In the public sector, the bonus is 10% for three children, plus 5% for each additional child; however, the total pension, including the bonus for parents, cannot exceed the end-of-career gross wage (bonuses excluded) that is used to calculate the pension.
Widows and widowers may get a survivor's pension, which is calculated as a percentage of the pension rights of the deceased spouse. Divorcees are also entitled to the survivor's pension. Some conditions exist – they differ from one scheme to another – but the principle is quite general. If the ex-spouse is from only one marriage, she is entitled to the full survivor's pension. If her ex-husband remarried, she shares the survivor's pension with the surviving spouse (in proportion to the duration of each marriage). This is a way (even if it is imperfectFootnote 14) to ‘compensate’ the divorced spouse for having made some investments during the marriage, specifically those that may have an influence on a future pension level (for example, withdrawal from the labour market).
Data and methodology
Data
Individuals may receive a retirement pension from more than one basic scheme if they have worked in more than one sector during their work history (for example, someone who started as a private-sector employee before becoming self-employed or someone who worked in two sectors at the same time). As pension schemes are managed independently in France, it was nearly impossible until the late 1990s to link an individual's retirement income to his or her entire contribution history. The exception to this was self-reported surveys, with the downside to them being that retirees themselves needed to recall information on the beginning of their working lives. Similarly, as there was no centralized pension information system, it was very difficult to obtain a complete picture of all the pensions paid out to a single retiree. However, since 1997,Footnote 15 a French administrative database called the EIR (Echantillon Interrégimes de Retraités; inter-scheme sample of retirees) now makes it possible to calculate total pensions for an anonymous and representative sample of the whole population of retirees, doing so by matching individual data on pensions from the various compulsory retirement schemes. The EIR also collects information used to compute pensions: contribution periods, pension rates, the situation at retirement, increases or reductions in pension rates due to early or delayed retirement, reference wages, etc.
The 2012 EIR survey was designed to represent the population aged 35Footnote 16 and over as of 31 December 2012. The sample includes all individuals who are receiving a retirement pension, either directly or through indirect entitlement to a deceased spouse's pension, i.e., a survivor's pension.Footnote 17 Virtually all obligatory retirement schemes participate in the EIR, except for some very small ones. More than 70 took part in the 2012 EIR survey, including the General Scheme and other basic schemes, schemes for public sector employees, and mandatory complementary schemes.
All told, the 2012 EIR includes 306,839 individuals who are receiving at least one pension of their own, with some of them also receiving a survivor's pension.
We have chosen to focus on schemes for private-sector employees and civil servantsFootnote 18. We thus consider two groups of retirees:
• Private-sector employees who are covered by the General Scheme (RG); this group includes non-titular public sector employees;
• central government civil servants who are covered by the Service des Retraites de l’État (SRE) and civil servants working for local authorities or hospitals who are covered by a separate scheme (CNRACL).
These retirees may be single-sector or multi-sector retirees. Those who receive a retirement pension from the private-sector scheme (General Scheme) and from one of the two public sector schemes (SRE or CNRACL) are considered public sector pensioners here since the vast majority of them spent most of their working lives in the public sector. Finally, note that we consider here all the pensions received by pensioners within the scope of our study, even if they are paid out by another scheme. All told, our sample includes 109,966 men in the private sector and 19,485 in the public sector (i.e., 84.8% of male retirees in 2012) and 113,665 women in the private sector and 31,383 in the public sector (i.e., 94.0% of female retirees in 2012). The only pensioners excluded here are those who do not receive any pension from at least one of the three schemes considered. In the rest of this article, we present our results for the private and the public sectors.
Descriptive statistics
As expected, the distribution of women's own pensions remains clearly to the left of men's, indicating more frequent small pensions and less frequent high pensions (Figure 1). The situation is better when survivor's pensions are included (total pensions), but the distribution is still to the left of men's. The gender differences in the distribution are much larger in the private sector than in the public sector, while heterogeneity is greater in the private sector (Figure 1). In the public sector, the women's curve corresponds essentially to a leftward shift of the men's curve while, in the private sector, the same shift occurs with the addition of a thicker left tail for women. This reflects a much larger accumulation of small pensions for women than for men. Furthermore, it illustrates the fact that women's careers in the public sector are relatively similar to those of men, but with less access to high positions, while women's working history heterogeneity in the private sector is much greater.
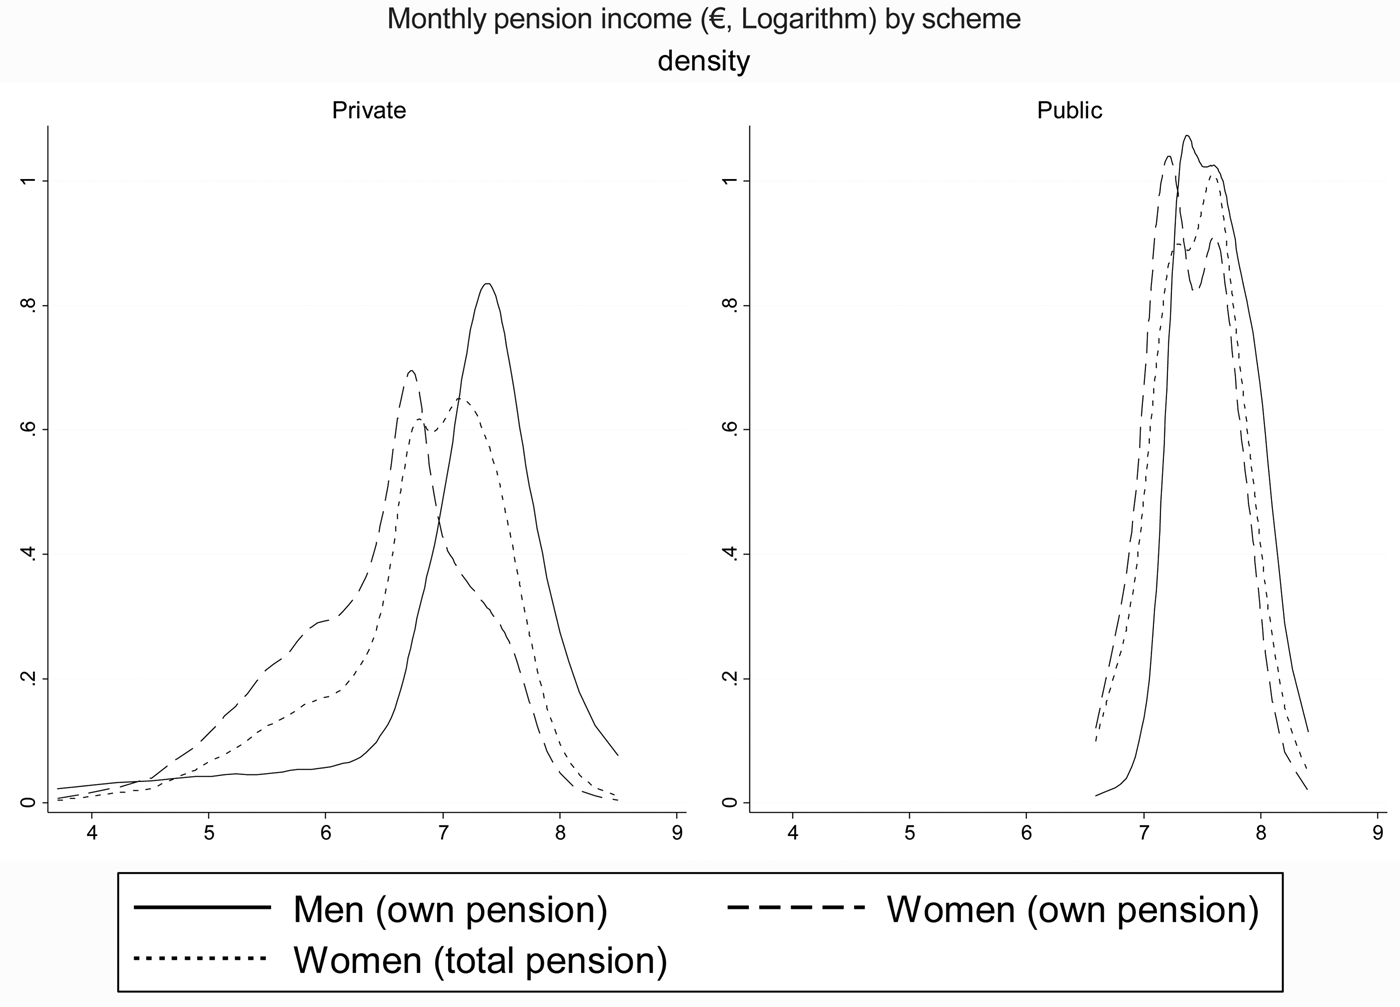
Figure 1. Distribution of pensions by sex and type of retiree.
Note: The distributions differ significantly at any usual threshold (nonparametric Somers' D statistic; somersd stata command, see Newson, Reference Newson2002).
Source: EIR 2012, Retirees with own pensions, as of 31 December 2012
When calculating pensions, the gender gap that is revealed may stem from several factors, as described below:
-
− The variables that directly link work history characteristics to pension level, namely contribution period and reference wage. Intuitively, since women have shorter contribution histories and lower wages on average, they will, therefore, receive lower pensions. These are the two most important variables for explaining pension levels. The contribution period will be measured by the number of quarters considered, which is the number acquired under all basic schemes; and the reference wage is a measure of the average wage in the private sector and the final wage in the public sector.
-
− The variables that correspond to public policies designed to raise the pension level of specific groups. In order to take those policies into account, we will use a dummy variable indicating that the retiree has had three or more children (since this gives rise to a bonus) and another dummy indicating that the retiree retired as a disabled person (since this automatically entitles him or her to the full rate from age 60).
-
− A dummy variable indicating whether or not the retiree receives a minimum pension.
-
− The retirement age. This plays a role because it is the result of a trade-off between earlier retirement and a larger pension. It differs considerably between men and women, especially in the private sector.
-
− The year of birth, in order to take cohort structure into account. As the legislation has changed over time and different cohorts may be subject to different rules, the link between contribution period, wages, etc. and pension level depends on the year of birth. Moreover, because of differential mortality, the survivors of the oldest generations are often the people with the highest pensions.
-
− A dummy variable indicating whether or not the retiree was born in France, not because this affects the pension, but because work histories of foreign-born people have particular characteristics, and this indicator enables us to reduce measurement error.
The following graphs present – separately for men and women, and for each scheme – the distributions of the two variables that have the largest effects on pension level: the contribution periods used in the calculation of pension levels; and the reference wages.
In the private sector, we find that the distribution of contribution periods is more concentrated for men, with a strong peak at around 160 quarters; while that of women is more scattered, with many female retirees having contribution periods below 50 quarters (Figure 2). The curves have a very different shape for civil servants (single- or multi-sector), for whom the gender difference in contribution periods is much smaller (Figure 2).Footnote 19 However, even in the public sector, women are more likely to have short periods.

Figure 2. Distribution of contribution periods by sex and type of retiree.
Note: The distributions differ significantly at any usual threshold (nonparametric Somers' D statistic; somersd stata command, see Newson, Reference Newson2002).
Source: EIR 2012, Retirees with own pensions, as of 31 December 2012.
Turning our attention to the reference wage (Figure 3), the wage distribution of women in the General Scheme is considerable to the left of men's, clearly indicating that women have both lower contribution periods and lower wages. For public sector retirees, the wage distributions of men and women are more similar. They are also more irregular, and the disadvantage in terms of the reference wage for women is not so clear, even though the women still have lower wages. The numerous peaks observed in the public sector are certainly due to the existence of pay scales that cause employees in the same category to reach the same final pay grade.

Figure 3. Distribution of reference wages by sex and type of retiree.
Note : The distributions differ significantly at any usual threshold (nonparametric Somers' D statistic; somersd stata command, see Newson, Reference Newson2002).
Source: EIR 2012, Retirees with own pensions, as of 31 December 2012.
Decomposition of the mean gender pension gap (Oaxaca-Blinder)
To decompose the mean gender pension gap, we begin with the classic method of Oaxaca (Reference Oaxaca1973) and Blinder (Reference Blinder1973). Formally, in the case of wage differences, this standard decomposition can be written as:

where $\bar{W}_m$ (resp. $\bar{W}_f\;$
 ) represents the estimated mean wage of men (resp. women), $\bar{X}$
 the observed individual characteristics, and β* the norm used to value those characteristics. Ideally, β* represents the return to these characteristics in a non-discriminatory labour market (Oaxaca and Ransom, Reference Oaxaca and Ransom1994).
Statistically, the same calculation can be used for the gender pension gapFootnote 20, although the interpretation will be different. This is because the formulas used to calculate pensions are gender-neutral and unaffected by an individual's current preferences. Some of the values used to calculate an individual's pension may be the result of personal choices (retirement age, for example); but once these values are known, the calculation is totally deterministic. So, whereas an employer might seek to promote men rather than women, a pension fund cannot refuse to give a monetary advantage to a woman if she is entitled to it. Likewise, the individual behaviour of retirees cannot affect the level of pension received. A man and a woman with exactly the same characteristics will get the same pensions, as the returns to characteristics are identical by nature.
Consequently, the share of the pension gap explained by composition effects should, in theory, reach 100% if we can take into account all the constituent elements of pensions. Even though we will endeavour to achieve this 100%, our interest lies not in the share that can be explained, but in its composition. Thus, we seek to determine which of the elements linked to work history (including past discrimination against women) are the most important in explaining the gender pension gap.
In practice, however, there remains an ‘unexplained’ part in the decomposition of the mean pension gap. What are the exact origins of this unexplained part?
First of all, it stems from the way the decomposition is performed. The pension calculation formulas are strongly non-linear because of the contributory/guaranteed minimum, the way the payment rate is calculated for the General Scheme, and various ceilings. Consequently, the average returns to characteristics may potentially differ if their distributions between the two groups differ when the non-linearities affect each group differently. Furthermore, while the variables we use to explain the pension level are indeed variables that determine the pension, the link between the two may not be direct. Thus, in the private sector, we use the contribution periods to all schemes in order to measure the duration of the activity. However, some quarters are ‘more useful’ than others, in the sense that they generate higher entitlements. For mothers, for example, part of the contribution period is actually a supplement added for each child, and it has no effect on either the yearly average wage or the rights accrued in complementary schemes. For this reason, a quarter may be more rewarding for men than for women because it is more often associated with the working activity.
To limit the effects of non-linearities, the continuous variables are finely discretized before being introduced into the empirical analysis in the form of sets of dummy variables. A dummy variable is created for each band of 5 quarters (for the contribution period), for each band of €100 (for the reference wage), for each year of birth, and for each quarter for the retirement date.Footnote 21 This allows, for example, each band of duration to have a different effect on the pension and does not require the transition from 50 to 55 quarters to have the same (marginal) effect on the pension as the transition from 150 to 155 quarters. In the results presented below, the effect of one factor (say, contribution period, for example) is calculated by grouping together the contributions of all the dummy variables describing that factor.
Measurement errors may also play a role in the unexplained part. The reference wage that we determine for the calculation of an individual's pension approximates the life cycle wage. The more linear the career, the more realistic it is; the more fragmented the career (which is more often the case for women), the less realistic. Two people with the same reference wage can, therefore, have different pensions in the complementary schemes. The risk of measurement error in the reference wage is greatest for multi-sector retirees who have spent a large share of their career in a scheme other than those included in our analysis, and this is because we do not model the wage reference for these schemes. This measurement error on wages will affect men more than women because they are more likely to be multi-sector retirees.
Decomposition of the gender pension gap at different quantiles
The distribution of pensions is quite irregular, as shown in Figure 1. This is notably due to non-linearities in the calculation formulas, threshold effects and, in the case of the public sector, accumulation points resulting from pay scales.
For this reason, the decomposition of mean differences is not sufficient for analysing the pension gaps in their entirety. To identify the most important factors at different points along the distribution, we use the decomposition method proposed by Firpo et al. (Reference Firpo, Fortin and Lemieux2007, Reference Firpo, Fortin and Lemieux2009). It is not possible to directly apply the Oaxaca-Blinder decomposition method to other characteristics of the distribution, such as quantiles, because the coefficients obtained after a classic quantile regression do not correspond to the marginal effects of the different explanatory variables. However, Firpo et al. (Reference Firpo, Fortin and Lemieux2007, Reference Firpo, Fortin and Lemieux2009) show that if we transform the functional variable (for example, the median of the considered distribution) with the help of the recentred influence function, we can apply the Oaxaca-Blinder decomposition to this transformed variable. Then, the coefficients determined by a linear regression applied to this transformed variable correspond to the marginal effects of the explanatory variables on the unconditional quantile being considered.
More specifically, consider a variable of interest (the dependent variable) Y with distribution F Y and marginal density f Y(.). Here, Y is the (logarithm of the) pension level. Consider a statistic of interest ν. Here, ν is a given quantile, but the method can be applied to other distributional statistics, such as the Gini. Let IF(y;ν) be the influence function for an observed y for the statistic ν(F Y). The recentred influence function (RIF) is the sum of the distributional statistic considered and of the influence function:

For the quantile $Q_\tau$ of level τ, the influence function ${\rm IF}( {y; \;Q_\tau } )$
 is given by:

where ${\rm {\opf I}}_{\left\{ . \right\}}$ is the indicator function. Thus, the recentred influence function for the quantile of level τ is:

Firpo et al. (Reference Firpo, Fortin and Lemieux2009) show that the marginal effects of a set of explanatory variables X can be recovered simply by using OLS to regress the recentred influence function of the quantile of level τ on X. In this case, the classic Oaxaca-Blinder decomposition can be applied to the recentred influence function to obtain the decomposition for a given distributional statistic (quantiles or others) – see Firpo et al. (Reference Firpo, Fortin and Lemieux2007). Note that the recentred influence function of the mean is the mean itself.
So, the method used is the following:
-
− For each quantile in the distribution (quartiles, deciles, etc.), and for each individual, we determine the recentred influence function of the quantile.
-
− We then apply the Oaxaca-Blinder method to this quantile by regressing, for men and for women, the recentred influence function of the quantile on the different variables (the same ones that were used for the mean).
-
− We can thus determine the composition effects of each variable and the unobservable effects on gender gaps for distribution characteristics other than the mean.
The contribution of a given factor at a given quantile indicates the share of the gap at this quantile that is explained by the gender differences in the distribution of this factor.
Even more so than when decomposing mean differences, how to take into account the explanatory variables – especially the contribution period and the reference wage – is important and can lead to different results, depending on the choices made. At the lower end of the distribution (for example, the first decile), one would expect to find that gender differences in the proportion of short contribution histories and low wage levels are the main drivers of the gender pension gap, as these groups of pensioners probably have little effect on the pension gap in quantiles at the top of the distribution. Consequently, we keep the same very fine discretization of wages and durations as previously.
Results of the decomposition of the average gender pension gap
Table 1 presents the results separately for both private and public sector retireesFootnote 22. We take into account all the variables that affect pensions: main characteristics of work history (wages and contribution periods), retirement age, cohort, and year of birth. We also introduce the main variables representing public policies: bonus for children, disability, and, especially, minimum pension – whose role in the gender pension gap is of particular interest to us. The fits are of very good quality. The R 2 of the regressions used to calculate the decomposition are high – between 80% (men from the private sector) and 91% (public sector), which is not surprising since we include the main determinants of retirement pensions and use very flexible functional forms to take non-linearities into account.
Table 1. Decomposition of the average gender pension gap (Women – Men pension in log points) by sector of retirees

Source: EIR 2012, Retirees with own pensions, as of 31 December 2012
For retirees from the private sector, 86% of the mean difference of 0.648 (in log points) can be ascribed to composition differences (Table 1). Out of this total, the contribution period and the wage level are by far the most important explanatory factors, since they account for, respectively, 41% and 64% of the mean difference. The effects of the bonus for children and of the birth cohort are close to zero, reflecting the fact that the male and female samples do not differ with respect to both those dimensions. The other composition effects (disability, retirement age, and origin) tend to reduce the gender pension gap, although to a rather limited extent. Foreign-born retirees are more likely to receive lower pensions, all other things being equal. As more men than women are foreign-born, this component reduces the mean gender pension gap (4% of the total). The effect of retirement age can be explained by the pension rules. Retiring at age 65 cancels the penalty on the pension rate (see the section on the French pension system). For workers with short careers, it is thus generally more advantageous to retire at age 65 rather than earlier, and more women indeed do retire at that age.Footnote 23 Lastly, disability also reduces the gender pension gap, although to a very limited extent. Disability entitles retirees to the full pension rate from age 60, even with short contribution periods, resulting in a higher pension, ceteris paribus. This positive effect is combined with a higher proportion of women who were disabled at the time of retirement.Footnote 24
The gender pension gap is much lower on average in the public sector than in the private sector (−0.255 versus −0.648) (Table 1). The effect of the contribution period is slightly smaller in the public sector (36% of the gap) than in the private sector (41%). This is in part because, as explained, short careers are transferred to the General Scheme, but also because female civil servants tend to have full careers, whereas, on the other hand, women in the private sector are more likely to have fragmented and low-paid work histories – including periods of inactivity. Overall, wage levels and contribution periods make a smaller contribution to the pension gap in the public than in the private sector, due to the careers of male and female civil servants being more similar than in the private sector. In both sectors, wage differences make a greater contribution than do differences in contribution periods. The other composition effects are virtually nil in the public sector.
In both sectors, there remains a residual – or unexplained gap that represents around 14% of the total in favour of men. As argued above, this unexplained gap cannot be attributed to discrimination, as the rules are the same for men and women. This, in particular, explains why it is much smaller than the unexplained gap generally found when studying gender wage gaps. This residual gap can be largely explained by pension rules and by how the elements used for the decomposition are built (see the section Methodology). The fact that the unexplained gap tends to increase the gender gap was expected. Indeed, durations related to fewer rights (that is, mainly durations that do not generate any rights in the complementary schemes) are more frequent among female retirees, as those durations mainly correspond to caregiver credits. This factor primarily concerns the private sector. In the public sector, another factor plays an important role: part-time work. Indeed, in the public sector, part-time work has an impact on the prorated coefficient (see above: it reduces D scheme), as it is computed based on working time (not in the private sector). Part-time work implicitly reduces the ‘return’ of quarters in the public sector while this factor that contributes to the unexplained part of the gap favours men, who are less likely to be employed part-time. Finally, a part of the unexplained gap comes from the fact that certain retirees are multi-sector retirees: our regressions partly explain pension benefits in other schemes (for example, schemes for self-employed people) by using the reference wage computed for the main sector (public or private), although it is only a proxy of earnings that generate pension benefits in other schemes. As men are more likely to be multi-sector retirees, this contributes to increasing the unexplained gender gap. When studying mono-sector and multi-sector retirees separately, we can clearly see that the unobserved gap is much larger among the latter than among the former.
Lastly, the effect of the minimum on the gender pension gap is particularly strong in the private sector (Table 1). Since a higher proportion of women compared to men receive the contributory/guaranteed minimumFootnote 25 and since, all else being equal, the contributory minimum increases the pension, it is not surprising to observe that these differences benefit women by reducing the total pension gap (Table 1). The effect of the contributory minimum represents 8% of the total gap (see Figure 4).Footnote 26 This means that without this safety, the gender pension gap would be even larger (especially for single-sector retirees) in the private sector. In the public sector, the contribution of differences in the guaranteed minimum to the total gender pension gap is close to zero, meaning that the shares of men and of women receiving the guaranteed minimum are indeed very similar. An analysis available in the online Appendix (Table A1) presents the results of the decomposition without including the minimum pension. Indeed, the contributory/guaranteed minimum is certainly the strongest generator of non-linearities. For people with a long employment history but low wages, it is likely to quite strongly decorrelate the retirement pension and the reference wage. In every case, we expect the introduction of the contributory/guaranteed minimum to increase the explained share of the model, insofar as far more women than men benefit from this measure. We also expect contributions of wages to be different in the decompositions with and without minimum pension. We observe (see Table A1, online Appendix) that omitting this variable generates a bias that leads to underestimating the effect of wages on pensions (omitted variable bias), which leads to a stronger contribution of wage gaps when taking into account receipt of a minimum pension. Indeed, the contributory minimum and the reference wage are negatively correlated, and receiving the contributory minimum has a positive effect on the pension. This bias is particularly strong for the private sector, due to the importance of the contributory minimum for these retirees (and especially for women).

Figure 4. Explained contributions to the gender pension gap, by type of retiree.
Source: EIR 2012, Retirees with own pensions, as of 31 December 2012. Interpretation: in the private sector, the respective contributions of career duration, wages, retirement age, children, disability, origin, cohort and minimum pension to the total gender pension gap are 41%, 64%, −4%, 0%, −2%, −4%, −1% and −8%.
Results of the decomposition along the distribution
We now go beyond the decomposition at the mean in order to fine-tune our results and identify which element plays a role at which part of the distribution. This is important if we want to measure the impact of public policies on gender pension gaps while taking into account inequality issues.
First of all, we observe that the gender pension gap is not uniform along the distribution (Figure 5), especially in the private sector. At the bottom part of the distribution, the pension gap is lower than in the other quantiles, which is consistent with the presence of the minimum pensionFootnote 27. The gender pension gap is the highest around the first quintile (Figures 5 and 6) and then narrows sharply along the distribution. We observe a small increase again in the last few centiles (Figure 6). The gender pension gap is then particularly pronounced at the bottom of the distribution for the private sector. This means that, compared to men, women with low pensions are relatively much worse off than women with higher pensions.

Figure 5. Gender pension gap at different quantiles (differences in the logarithms of pensions (women minus men)).
Source: EIR 2012, Retirees with own pensions, as of 31 December 2012.
The story is completely different in the public sector. The gap is relatively large and the widest for the first centiles then becomes quite uniform along the distribution. We note a further increase in the gap for only the very last centiles (Figure 6).
Note that the differences are much smaller at every point along the distribution in the public sector scheme compared to the private one, due to greater homogeneity in work histories. The gap at the median pension (for logarithms of pensions) is 3 times smaller in the public sector than in the private one.
In both sectors, the unexplained share (differences linked to unobservable factors and measurement errors) is lower than the explained one (differences in composition on the observable determinants of pensions) along the whole distribution (Figure 6). It is even close to zero in the private sector from the 7th to 9th decileFootnote 28, and above the second decile in the public one. This means that at these points of the distribution, the gender gap is totally explained by differences in the observable characteristics we consider in the decomposition. For the public sector, the fact that the contribution of the unexplained share is significant only in the first two deciles is explained by the fact that, beyond the second decile, we find men and women who have completed their careers and reached the highest grade in their pay scale. There is no non-linearity, since the pension is mostly the product of the final pay grade and the pension rate (which is more or less identical for everyone). In both sectors, the unexplained part favours men, which is consistent with what we observe for the average (Figure 6), with the exception of the first centiles of the distribution in the private sector. In the first decile in the private sector, the unexplained share is very high and represents 70% of the total gap, in favour of women (Figures 6 and 7). This can probably be associated with measurement errors in the pensions of some men at the low end of the distribution, whose pensions are incomplete. Some men end up towards the bottom of the distribution despite having ‘good characteristics’ (wage and career duration), because part of their pensions (which are paid by schemes not included in the EIR) is missing from the data; thus, they are considered single-sector retirees when computing their pensions. Men are more often affected by this phenomenon because they are more likely to be multi-sector retirees.
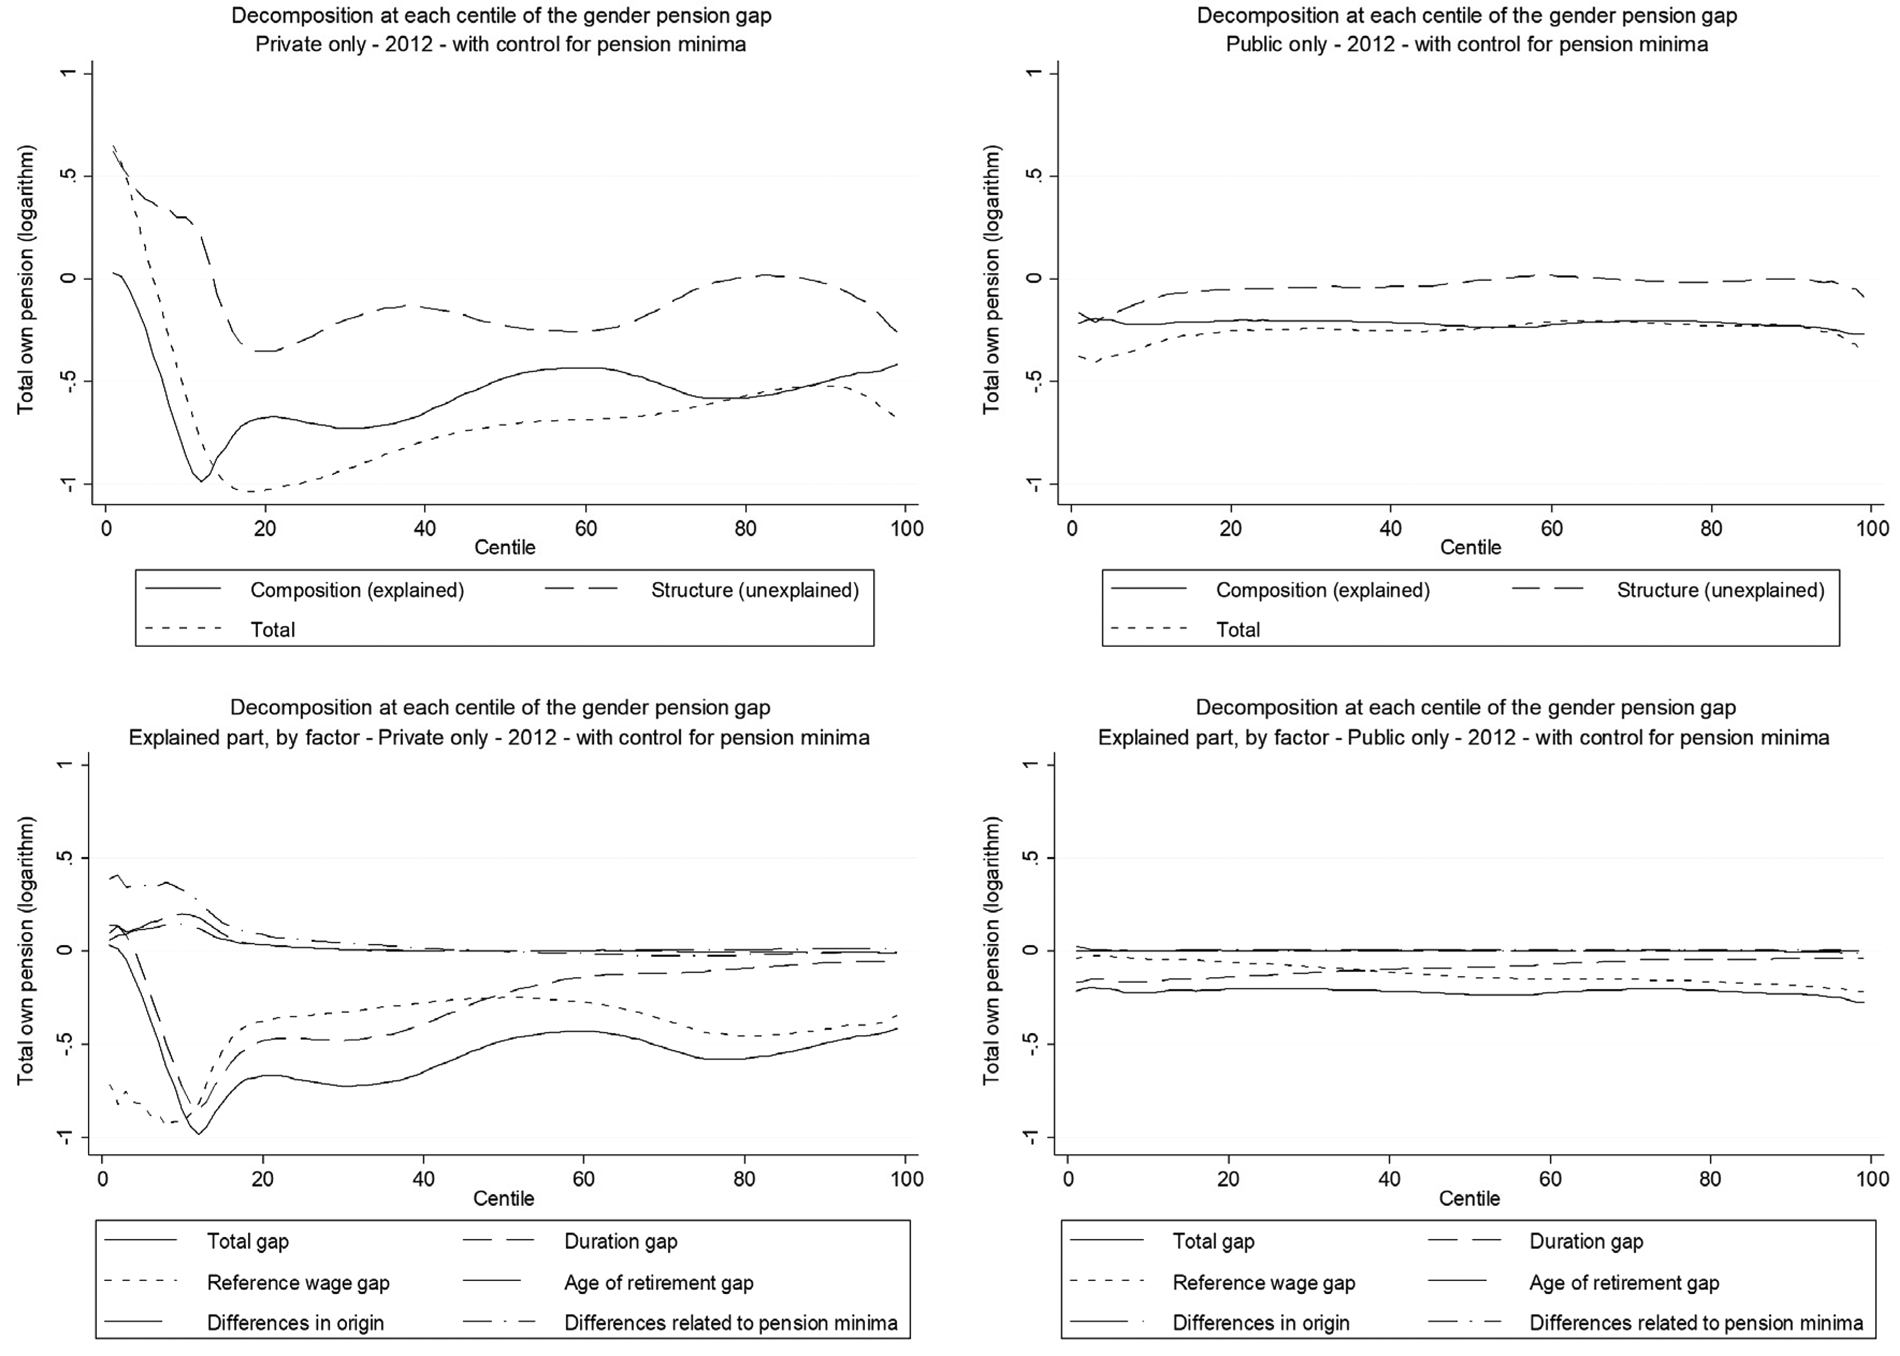
Figure 6. Decomposition of gender pension gaps at different centiles, by sector.
Source: EIR 2012, Retirees with own pensions, as of 31 December 2012.
Note: These graphs only represent the effects of the main factors. However, the estimations take all the factors into account.
Note : This figure represents the gender pension gap, computed as women's pension minus men's pension at different centiles. The more negative the gap, the higher the pension of men compared to women

Figure 7. Decomposition of the effects at different quantiles, private-sector retirees.
Source: EIR 2012, Retirees with own pensions, as of 31 December 2012. Interpretation : at the first quartile in the private sector, the respective contributions of minimum pension, cohort, origin, disability, children, retirement age, wage and duration to the total gender pension gap are −6%, −1%, −2%, −2%, 0%, −2%, 35% and 47%. The contribution of the unexplained part is 31%. These contributions sum to 100%. Positive values indicate that the factor expands the pension gap in favour of men and negative values indicate that the factor shrinks the pension gap.
In line with the decomposition at the mean, wages and contribution periods are the main drivers of the gender pension gap. However, the intensity of the contribution is not the same along the distribution and for the private and public sectors. With the exception of the first decile in the private sector (where differences in reference wage play a more important roleFootnote 29), the contribution periods for both sectors have a larger effect in the lower part of the distribution. These results are in line with those of the German case studied by Hänisch and Klos (Reference Hänisch and Klos2014), indicating that the differences in the number of employment years explain an important part of the gender pension gap in the low quantiles. Then, progressing upwards in the distribution, we observe that contribution of wages is more important. The two sectors differ in the proportion of the population for which the contribution of wages is the most important: it is higher in the private sector. Wages make a greater contribution after the median in the private sector, and after the 3rd decile in the public sector. Above the median, in approximate terms, the contribution of differences in contribution period becomes very low: from the 7th decile, the total explained gap is essentially due to wage-related differences. Once private sector retirees, men and women alike, have completed their full careers (which is the case in the upper part of the pension distribution), the differences in terms of contribution periods become negligible. In the public sector, the contribution of contribution periods decreases regularly from the 3rd decile and up to the end of the distribution (Figures 6 and 8). One interpretation is that careers in the public sector are more homogeneous: there are fewer very long careers because of recruitment constraints (fewer early entries); there is less incentive to pursue one's career after reaching the full pension rate. The latter explanation is especially true for those in the public sector who have reached the top pay grade in their category, a distinct situation from the private sector,Footnote 30 where the complementary schemes allow contributors to increase their pensions. Note also that as people with less than 15 years of service in the public sector are subject to the ‘clause de stage’ (i.e., they receive their pension from the private sector), no one in the sample of public sector retirees has a very short contribution period.

Figure 8. Decomposition of the effects per quantile, public-sector retirees.
Source: EIR 2012, Retirees with own pensions, as of 31 December 2012. Interpretation: at the first quartile in the public sector, the respective contributions of minimum pension, cohort, origin, disability, children, retirement age, wage and duration to the total gender pension gap are 0%, 3%, 0%, 0%, 1%, −2% 26% and 53%. The contribution of the unexplained part is 18%. The contributions sum to 100%. Positive values indicate that the factor expands the pension gap in favour of men and negative values indicate that the factor shrinks the pension gap.
The contribution of all other factors to the gender pension gap is almost zero along the public sector distribution. In the private sectors, the other factors have a negligible effect above the 2nd decile (Figures 6 and 7). For the first decile, they are rather in favour of women, as the distribution of these variables reduces the gender pension gap (Figure 7). As already observed when decomposing the mean differences, the proportion of people born in France has the strongest impact. Our interpretation of this factor's contribution is that it indicates either: measurement errors in the work histories of men born abroad and who receive low pensions; or irregular and unfavourable forms of work histories that are more likely to be observed among foreign-born men. Therefore, retirement ages and disability contribute to reducing the gender pension gap, an interpretation that can equally be applied to the mean differences.
As far as the perception of the minimum contribution is concerned, the differences in the composition of this variable favour women, as they are more likely to receive the contributory minimum pension. Yet, even though this effect can be observed up to a rather high level in the distribution, it is very weak above the first two deciles. Indeed, although receiving the contributory minimum remains in favour of women up to a high level in the pension distribution, the share of pension income provided by the contributory minimum grows smaller and smaller, thus reducing the impact of this variable.
Comparing decompositions at the mean and along the distribution highlights the fact that minimum pension contributions and other composition factors observed for the average gender pension gap are essentially significant contributions in the very first deciles of the pension distribution.
Conclusion
In this paper, using the Firpo et al. (Reference Firpo, Fortin and Lemieux2007, Reference Firpo, Fortin and Lemieux2009) decomposition, we quantify the contribution of the main determinants of retirement pensions (length of working history, reference wage, etc.) to the average gender pension gaps and along the pension distribution in France.
We confirm the intuitive expectation that the composition differences in the gender pension gap are essentially due to differences in working life histories and in reference wages used to compute the pension in both the private and the public sectors. In each sector, contribution periods have a higher effect at the bottom of the distribution. Then, progressing upwards in the distribution, we show that wages play a progressively more predominant role. In the private sector, the contribution of contribution periods is higher than that of wages up to the median of the distribution. This is the case even though the way of computing contribution periods has so far been quite favourable to women. Indeed, the current system counts four quarters as having been acquired during the year once a yearly wage of at least a half-time minimum-wage job is reported. In addition, some periods of contribution result from having children. The link between contribution periods used to compute pensions and the duration of periods worked is thus weaker for women than for men. Additionally, our decomposition highlights that, in the private-sector scheme, the minimum pension contributes strongly to reducing the gender pension gap at the bottom of the distribution, that is, in the first two deciles. In the public sector schemes, the contribution of the guaranteed minimum to the gender pension gap is negligible.
These results may shed some light on the ongoing French debate on pension reforms. Indeed, as in most European countries, France has been undergoing continuous pension reforms since the early 1990s in efforts to insure the financial sustainability of its pensions system (Bozio et al., Reference Bozio, Rabaté, Rain and Tô2018). The successive pension reforms contribute to the lower pension growth for the most recent generations of men. For women, the effects of these reforms are so far more than counterbalanced by their higher pensions resulting from their massive participation in the labour market since the 1950s. This results in a decreasing gender pension gap across cohorts (Aubert, Reference Aubert2012).
However, a new pension reform is currently being prepared in France, although its effects on the gender pension gap remain uncertain at this stage. It is an extensive reform, as the pension system will undergo two major changes. First, the new pension system will be unified and thus result in the disappearance of distinct pension schemes for different occupational branches. In particular, civil servants and private-sector employees will be subject to exactly the same rules. Second, while successive reforms have so far led to changes in the parameters of the different pension schemes, the reform consists of switching to a universal points-based scheme that covers the entire population. This new scheme will be close in spirit to the current private-sector complementary schemes, with a significant contributory component and a closer link between the whole work history (wages and number of years in which wages were received) and the resulting pension. This new system will be completed by some mechanisms corresponding to current caregiver credits and minima. Although the general principle may seem to have been established, the parameters remain yet to be defined. Therefore, without having more information on either the parameters or the eventual change in behaviour, it is not possible at this stage to know exactly what will be the effects of the reforms on the gender pension gap. Our analysis can, however, give some indications on this subject.
Because of the weaker link for women than for men between contribution periods used to compute pensions and the duration of periods, we may expect that the gender pension gap in the private sector will be increased by shifting to the new system, at least in this dimension, as this will more strictly link the period worked with pension level, that is, unless some non-contributory mechanisms (for example linked to children) are simultaneously implemented to counterbalance this trend. In the public sector's current system, the contribution periods used for computing pensions are closer to the periods actually worked. Thus, the impact of changes in the way working history is taken into account on pension gender gaps should be more moderate in the public sector than in the private sector. It should be nevertheless remembered that part-time work is penalising because currently, in the public sector, it directly reduces duration. This will implicitly occur in the future system because part-time work will result in less pay and, therefore, less entitlement. However, it is currently possible to pay additional contributions in order to cancel the penalty from part-time work. Not providing this opportunity could potentially increase the gap between men and women, since (for the time being) women work part-time more often.
The contribution of wages to the gender gap is more important for the private sector above the median and for the public sector above the 3rd decile. In both sectors, pension levels will be reduced by switching from a reference wage computed for particular years (the last 6 months in the public sector and the 25 best years in the private sector) to a reference wage computed for the whole career. This reduction will be more important for workers with upward wage trajectories – that is to say, men – and will then contribute to a reduction in the gender pension gap. It will be even more important in the public sector because in the current system average wages and pensions in the private sector are more closely related than in the public sector. This reduction might be particularly sensitive in the upper part of the pension distribution, due to both the higher contribution of wages and the steeper career slopes in this part of the distribution. As a whole, the reform should likely reduce the gender pension gap in the public sector, mainly due to a large effect from changing the notion of reference wage and to a very moderate effect from changing the notion of work history duration. However, in the private sector, the effects on wages and on contribution periods move in opposite directions, and if they collide, the current reform may result in an uncertain global effect on the gender pension gap.
This uncertainty is reinforced by ignorance about the design of future minimum pensions and the expected caregiver credits. The level of the future minimum pensions and the way they will be designed certainly deserve a lot of attention, at least for the private sector, as minimum pensions contribute to reduce the pension gap at the bottom of the distribution. Lastly, pension credits related to the birth of children allowed a number of women to reach the full rate earlier, namely by increasing their numbers of quarters without increasing their pensions in the complementary schemes. Although the allocation of additional points instead of quarters changes the perspective by changing the terms of the trade-off, it is important to state again that it is very difficult at this stage to know how behaviour will change.
Supplementary material
The supplementary material for this article can be found at https://doi.org/10.1017/S1474747220000177.


