


1. Introduction
In the last few decades, EU countries have implemented a series of pension reforms aimed at reducing public spending on pensions in order to guarantee their future sustainability in view of rising demographic dependency rates. Moreover, the economic recession faced by Europe in recent years has prompted an intensification of these pension reforms in many countries, through the adoption of additional parametric, or even structural, changes, sometimes with short-term impacts.
These sustainability-enhancing reforms have been designed with different measures that have modified retirement rules and parametersFootnote 1. For instance, Finland, France, the Netherlands, and Spain introduced different actions in order to change the retirement incentives, such as making the pathways to early retirement harder, or increasing the number of years of contributions needed to collect a full retirement pension. Spain has also, along with other European countries such as Belgium and Germany, started to gradually increase legal retirement ages. Reducing relative pension benefits is another set of measures aimed at reducing the generosity of the pension system, by which countries like Greece, Finland, and France have modified, for example, the number of years and valorization of pensionable earnings, or the calculation of pensions at retirement. Finally, other countries have implemented measures to increase revenues, such as Denmark, France, Portugal, and the UK, which have increased social contribution rates.
On the other hand, several European countries have implemented structural reforms. Among these structural changes, it is worth mentioning the introduction of new pillars and/or changing the nature of the public pension systems. For example, Italy, Latvia, Poland, and Sweden have converted their Defined Benefit public pillar to a Notional Defined Contributions system, while other European countries have introduced mandatory private accounts. Thus, while countries like Bulgaria, Estonia, and Croatia have implemented individual private schemes, Cyprus, and Slovenia introduced mandatory private occupational accounts, where, in most cases, contributions to the new private pension accounts were financed through shifting part of the payroll taxes raised for the public pension systemFootnote 2.
However, another important element in the aforesaid process of pension reform is the introduction of automatic adjustment mechanisms, aimed at automatically adjusting the main pension system parameters to changes in demographics. Of these mechanisms, three were the most commonly implemented: automatic balancing mechanisms, sustainability factors, and retirement ages linked to life expectancy. Nevertheless, more than half of the countries in the European Union have yet to introduce any of these automatic mechanisms. Italy, in 1995, was the first country to legislate on the introduction of an automatic adjustment that increases the legal retirement ages according with future gains in life expectancy. Since then, several other countries, like Denmark in 2011 or the Netherlands in 2012, have decided to introduce such an adjustment mechanismFootnote 3. As with changes in retirement ages, sustainability factors have also been introduced by several countries (Italy, France, and Sweden being examples), where these factors change the amount of the initial pension benefit according to demographic changes, mainly changes in life expectancy at the time of retirement.
Finally, automatic balancing mechanisms guarantee that the pension system will be financially sustainable during the coming decades by adjusting benefit indexation. Until now, this balancing mechanism has only existed in three countries. In Germany, benefit indexation is reduced through a contribution rate factor and a sustainability factor. In Sweden, this mechanism reduces benefit indexation in the event that the public pension system faces a deficit in the medium term. In Spain (see below), there is a reduced benefit indexation when there is a present or expected deficit in the public pension scheme. Lastly, it is also worth mentioning that only five European countries have introduced two automatic adjustment mechanisms simultaneously. Specifically, Italy, Portugal, and Finland have retirement ages linked both to life expectancy and sustainability factors, while Spain and Sweden have sustainability factors and automatic balancing mechanisms.
The aforementioned pension reforms will have an important impact on containing future pension expenditure trends. Specifically, the average pension benefit to average wage ratio will decline significantly in most EU countries, so that the public pension expenditure as a share of GDP would be no higher in 2060 than at present for the EU28 as a wholeFootnote 4. But note that the role of pension systems is basically twofold: income allocation over the life cycle and poverty protection at older ages. Consequently, these estimates indicate that these reforms may have adverse consequences for future pension adequacy, so that these parametric and structural changes may also contribute to reducing the poverty alleviation role of the public pension systems (see Grech, Reference Grech2015). Therefore, the main obstacles to future pension adequacy coming from these reforms are those that proceed from the decrease in the relative value of pension benefits, and this is due both to a weaker valorization and indexing. Additionally, those pension reforms aimed at ensuring financial sustainability merely by lowering retirement benefits, aside from making it difficult to provide protection against poverty, heighten the risk of policy reversals. Put differently, if pension reforms imply an increasing number of people without acceptable incomes, the future sustainability of public pension systems may also be eroded by the risk of policy reversals.
As stated earlier, in the last few years Spain has also undertaken two major pension reforms. The 2011 and 2013 Spanish pension system reforms addressed the demographic challenge by, among other measures, increasing the legal retirement ages and introducing a Sustainability Factor linking the initial pension to the increase in life expectancyFootnote 5. Furthermore, the 2013 Pension Reform has introduced an automatic adjustment mechanism, the Pension Revaluation Index (PRI), which uncouples annual pension updates from the Consumer Price Index (CPI) increases, which had previously been linked, but sets the annual increase in pensions on the basis of a formula derived from the balance between the system's revenue and expenditure, although such revaluation cannot be lower than 0.25 nor higher than the sum of 0.5 to the CPI increase.
Some previous research papers have studied the quantitative effects of these pension reforms (see, e.g., Díaz-Giménez and Díaz-Saavedra, Reference Díaz-Giménez and Díaz-Saavedra2017; Hernández de Cos et al. Reference Hernández de Cos, Jimeno and Ramos2017; Patxot et al. Reference Patxot, Solé and Souto2017; Sánchez-Martín, Reference Sánchez-Martín2017; De la Fuente et al. Reference De La Fuente, García Díaz and Sánchez-Martín2018), and they all conclude that these reforms substantially improve the sustainability of Spanish pensions, and that they limit the tax increases that would have been necessary to finance the pension system deficitsFootnote 6. The key mechanism from the viewpoint of making headway in the sustainability of the system is the PRI, since it severely limits the growth rate of pensions, so that large reductions in the generosity of public pensions for current and future generations of retirees are expected. For instance, Díaz-Giménez and Díaz-Saavedra (Reference Díaz-Giménez and Díaz-Saavedra2017) find that these reforms will reduce the real value of the average pension by about 33% by 2050, when compared with the values that would have obtained without the reforms.
The projected reduction of the real value of Spanish pensions, however, is so large that it is hard to believe that it will be politically sustainable, even in the near future. Put differently, since these reforms could leave an increasing number of people without adequate incomes, the future sustainability of the Spanish public system may also be affected by the risk of policy reversals. In fact, since the introduction of this adjustment mechanism, the annual nominal revaluation of the pensions in force since 2014 has been 0.25%, but the inflation rate increased from −1.1% in 2014 to 1.2% in 2017. This loss in the purchasing power of pensions, along with the losses projected for the coming decades, has therefore caused growing concern in public opinion. Moreover, the main opposition parties as well as the two main trade union federations have demanded that the Spanish government repeal the PRI and that the pensions in effect be newly revalued with the CPI in order to maintain their purchasing powerFootnote 7.
The risk of policy reversal is also increased because the Spanish pension reforms were not accompanied by other retirement incomes or safety nets to prevent the elderly from falling into poverty. Specifically, a minimum pension or other forms of guarantees could serve as poverty protection in old age, so that, and as is generally advocated, the evolution of this minimum guaranteed level can be observed to see whether it continues to serve its protective purposeFootnote 8. But, and until now, this is not the case in Spain, since the PRI, approved in the 2013 reform, establishes that the minimum pension has to evolve according to the rest of contributory pensions and therefore will be almost constant in nominal terms in the long run (i.e., a 0.25% increase in nominal terms per year). Thus, a change in the revaluation rules for those lower value pensions could both allow the pension system to continue fulfilling its role as poverty protection at older ages and also help to reduce the risk of policy reversal of the aforementioned pension reforms.
In this paper, we therefore analyze the fiscal, aggregate, and welfare consequences of returning to full CPI indexation for part or all of the Spanish public pensions in 2018. To this end, we simulate and compare four model economies. In the first model economy, which we label Model Economy Ben, we simulate the 2011 and 2013 pension system reforms and we use the PRI to revaluate every pension in payment. In all the other model economies, we also replicate the 2011 and 2013 Spanish pension system reforms but we eliminate the PRI on part or all of Spanish pensions. Specifically, in the second model economy, which we label Model Economy Re1, we assume that only disability and minimum pensions are fully indexed with the CPI. In the third model economy, which we label Model Economy Re2, we assume that both the minimum pension and all pensions below 40% of per capita GDP are fully indexed with the CPI. Finally, in the fourth model economy, which we label Model Economy Re3, we assume the full CPI indexation of all Spanish public pensions.
To do this, we use a life-cycle general equilibrium model of labor supply and retirement, where ex-ante educationally heterogeneous workers face idiosyncratic labor income risk. Our model economy is an enhanced version of the general equilibrium, multi-period, overlapping generations model economy populated by heterogeneous households described in Díaz-Giménez and Díaz-Saavedra (Reference Díaz-Giménez and Díaz-Saavedra2017). The main features of this model economy are the following: the households differ in age, education, and employment status, and, consequently, in income, wealth, pension rights, and pensions, and they decide optimally how much to work, consume, and save and when to retire. Production is carried out by a neoclassical representative firm that behaves competitively in its product and factor markets. We also model a government that runs a fully explicit and detailed pay-as-you-go pension system financed with payroll taxes, and which uses consumption, capital, and income taxes to finance exogenous sequences of government expenditure and public transfers other than pensions. Finally, we also assume that the consumption tax rate increases as needed to finance the pension system deficit once the Pension Reserve Fund runs out.
However, the model economy that we study here differs from the one that we used in that article in an important way. We have introduced unemployment as an additional labor status, where unemployment is stochastic and the unemployment risk is age-dependent. Thus, in our model economy, unemployed households also differ in their age, education, asset holdings, and pension rights; they receive unemployment benefits from the government, and they face a survival shock and an employment shock. We also assume that the decision to return to employment, once a job offer is received, is exogenous, and mandatory. They also decide endogenously how much to consume and save, and once they reach the first retirement age, they are forced to retire.
The findings of this paper are fourfold. First, the aforesaid reforms improve the generosity of the pension system, since the average pension increases progressively, and by 2070 is 11%, 21%, and 54% higher in real terms. Thus, the reforms contribute to preventing old-age poverty and at the same time provide a means to smooth lifetime consumption. But this higher generosity is achieved at the expense of increasing pension expenditure, and consequently, pension deficits. On average, yearly pension expenditure increases by 0.8, 1.9, and 3.8 percentage points of output during the ensuing decades. On the revenue side, if the government resorts to indirect taxes, which is also the preferred option among experts proposing alternatives for reforming the Spanish Tax System, the consumption tax rate should be increased on average by 9%, 16%, and 34%. Thus, the return to a price indexation rule of part or all of Spanish pensions essentially implies trading off higher pensions against the higher tax rates that are needed to finance them.
Second, the optimal response of households to this trade-off is to save and work fewer hours in the reformed Model Economies Re2 and Re3. Higher pensions reduce saving rates since they decrease the optimal level of assets needed to support consumption when retired, and labor input also decreases as the higher taxes reduce the average time allocated to market activities. Consequently, both reforms make the growth rates of output smaller; this reduction is progressive and, by 2070, output is 4% and 7% lower in comparison to the benchmark Model Economy Ben. However, this is not the case in the reformed Model Economy Re1, because the lower saving rates are compensated by the longer working lifetime, as workers optimally decide to delay retirement since disability risk is covered by more generous disability pensions. Thus, we find that there is no significant variation in output in comparison to the benchmark model that same year.
Third, we find that most of the households alive at the time these pension reforms start to be implemented prefer the return to a price indexation rule of all Spanish pensions, since this indexation rule brings about sizeable aggregate welfare gains equivalent to 2.7% of aggregate consumption that same year. On the other hand, newborns are better off if both minimum and disability pensions are indexed to CPI, where the individual welfare gains of future cohorts increase until 3.5% of consumption for cohorts born in 2050. That is, future cohorts prefer to pay higher consumption taxes if these additional tax collections are used to increase those pensions aimed at protecting against poverty and disability risk. Fourth, the second reform reduces pension inequality during the ensuing decades, since it keeps the real value of the minimum pension constant, while it continues to revaluate the maximum pension with the PRI. On the other hand, the full price indexation of all Spanish pensions increases pension inequality, in comparison with the current system in Spain. Finally, the reformed Model Economy Re1 presents mixed results during the medium and long term, regarding pension inequality.
The paper is organized as follows: Section 2 describes the Spanish pay-as-you-go pension system; Section 3 presents the model economy; Section 4 describes the calibration procedure; Section 5 describes the simulations; Section 6 presents the results; Section 7 quantifies the welfare consequences; Section 8 discusses the robustness of our results; and, lastly, Section 9 concludes.
2. The Spanish social security
The Spanish contributory pension system is the most important program of social protection in Spain, where public contributory pensions are provided by the following three programs. First, the Régimen General de la Seguridad Social covers the private sector employees and the members of cooperative firms and the employees of most public administrations other than the central governments. Second, the Regímenes Especiales de la Seguridad Social covers the self-employed workers and professionalsFootnote 9. Third, the scheme for government employees, or Régimen de Clases Pasivas covers public servants employed by the central government and its local branches.
In this article, we focus exclusively on the retirement and disability pensions payed by the Régimen General de la Seguridad Social. Consequently, this section describes the key features of this system and its 2011 and 2013 reforms.
Financing and eligibility. The Régimen General de la Seguridad Social is a mandatory pay-as-you-go scheme. The payroll tax rate is proportional to covered earnings, which are defined as total earnings, excluding payments for overtime work, between a floor and a ceiling that vary by broadly defined professional categories. The payroll tax rate is 28.3%, of which 23.6% is attributed to the employer and the remaining 4.7% to the employee.
Entitlement to an old-age pension requires at least 15 years of contributions. The retirement age that entitles workers to receive a full retirement pension is 65 for workers who have contributed at least 36 years and 3 months. Previous to the 2011 Pension reform, every worker aged 61 or older could retire earlier paying an early retirement penalty, as long as they had contributed to the pension system for at least 30 years. Exceptionally, workers who had entered the system before 1967 could retire at age 60. The 2011 Reform of the Spanish pension system delayed the early retirement age from 61 to 63 for those workers who decide to retire on a voluntary basis, and it also delayed the full entitlement retirement age from 65 to 67. The delay in the early retirement age was immediate, and the delays in the normal retirement are gradual: 1 month per year between 2013 and 2018, and 2 months per year between 2019 and 2027. Consequently, the full entitlement retirement age in Spain will be 66 in 2021 and 67 in 2027.
Retirement pensions. The main component of the retirement pension is the Regulatory Base, defined as the average covered earnings of the last 21 years before retirement. Labor income earned in the last 2 years prior to retirement enters the calculation in nominal terms, and the covered earnings of the remaining years are revaluated using the rate of change of the Spanish CPI. The 2011 Reform of the Spanish pension system extended the number of years of earnings used by the Regulatory Base up to the last 25 years before retirement. The extension of the number of years used to compute the pensions was phased in gradually and it will end in 2022. In addition, the Regulatory Base in multiply by a percentage which depends on the age of the retirees and on the number of years of contributions. Each year worked after the full entitlement retirement age increases the Regulatory Base in 2 or 3 percentage points depending on the length of the contributory career. Finally, retirement pensions are bound by a minimum and a maximum pension, where minimum pensions depend on the pensioner's age and on the composition of the household.
The 2013 Reform of the Spanish pension system introduced a Sustainability Factor whose purpose is to adjust the initial pension with the life-expectancy at retirement so that the life-time cost of retirement is approximately the same for every cohort. The Sustainability Factor only affects new pensioners joining the system in 2019 onwards.
Disability pensions. The Spanish pension system rules define pensionable income for workers who qualify for a disability pension as the average covered earnings of the previous 15 years, for workers who are younger than 52, or of the previous 8 years, for workers who are 52 or older, and the standard disability pension is 75% of the pensionable income when the disability is due to an occupational accident or illness. But if the worker is covered by a collective agreement, this percentage can reach the 100% of that amount. Additionally, there are other situations in which disability pensions are only 50% of the pensionable income.
The revaluation of pensions. In 2014, the Spanish pension system moved from a full price indexation of pensions to a partial price indexation achieved updating pensions with a PRI. This index sets the annual increase in pensions on the basis of a formula derived from the balance between the system's revenue and expenditure, although such revaluation cannot be lower than 0.25% nor higher than the sum of 0.5% to the CPI increase.
The Pension Reserve Fund. Since 2000, part of the surpluses generated by the pension system are deposited in a Pension Reserve Fund. The assets accumulated in this fund have been then used to finance the pension system deficits, and at the end of 2017, the total amount of assets accumulated in the Pension Reserve Fund was €8,085 million which corresponded to 0.70% of that year's GDP.
3. The model economy
We study an overlapping generations model economy with heterogeneous households, a representative firm, and a government. Our model economy is an enhancement of the model economy described in Díaz-Giménez and Díaz-Saavedra (Reference Díaz-Giménez and Díaz-Saavedra2017). For the sake of brevity, we offer only a brief summary of its main features here. A detailed description of this model economy can be found in the technical appendix to this paper that is available at https://www.ugr.es/~julianalbertodiaz/research/PEN65-APP-G20.pdf.
3.1 The households
Age and education: The economy is populated by overlapping generations of heterogeneous households of age j = 20, 21, …, 100. Each period the households face an age-dependent and time-varying conditional probability of surviving from age j to age j + 1, which we denote by ψ jt. The households can be either high school dropouts, high school graduates, or college graduates. This educational level, which we denote by h, is exogenous and it is determined forever when they enter the economy.
Labor status and endowments: Households in our model economy are either workers, unemployed, disabled households, or retirees. Every household enters the economy as a worker and with no assets. Workers receive an endowment of efficiency labor units every period. This endowment has two components: a deterministic component, which we denote by εjh, and a stochastic, idiosyncratic component, which we denote by s. The deterministic component depends on the household age and education, and we use it to represent the life-cycle profiles of earnings. The stochastic component is independent and identically distributed across households, it follows a first-order, finite-state Markov chain, and we use it to generate earnings and wealth inequality within the age cohorts. The labor income of workers is  $y_t^l = {\rm \epsilon} _{jh} \times s \times w \times l$, where w is the market wage and l is the time devoted to working in the market, which is endogenous.
Workers of age j at period t face a probability p υ jt of becoming unemployed from age j + 1 onwards. The unemployment shock is temporary, and it is realized at the end of each period, once workers have made all their labor and consumption decisions. When a worker becomes unemployed, she receives unemployment benefits from the government, and she decides endogenously how much to consume and save. Once she reaches the first retirement age, R 0, she is forced to retire.
The decision to return to employment is exogenous and mandatory. Unemployed households of age j at period t receive a job offer with probability p ωjt, and this offer is the productivity shock s. Therefore, its amount is either s 1, s 2, or s 3. Conditional on receiving an offer, the probability of receiving each one of them is the unconditional probability of each realization of that shock. Once a household is re-employed, the future values of s are determined by the process on s Footnote 10.
Workers of age j and educational level h face a probability φjh of becoming disabled from age j + 1 onwards. The disability shock is realized at the end of each period, once workers have made all their labor and consumption decisions. When a worker becomes disabled, she exits the labor market and receives no further endowments of efficiency labor units, but she is entitled to receive a disability pension until she dies.
Workers of age R 0 or older observe their realizations of the two components of their endowment of efficiency labor units and their pensions, and they decide whether to remain in the labor force for that period, or whether to retire and start collecting their retirement pension. Both the disability shock and the retirement decision are irreversible and there is no mandatory retirement age.
Preferences: The households order their sequences of consumption and leisure according to a constant relative risk aversion utility function, u(c, 1 − l), where c denotes consumption and 1 − l denotes leisure.
Technical assumptions: We assume that there are no insurance markets for the stochastic component of the endowment shock and that the households cannot borrow. When insurance markets are allowed to operate, every household of the same age and education level is alike and the income and wealth distributions in our model economy become much more disperse.
3.2 The representative firm
In our model economy, there is a representative firm. Aggregate output, Y t, is obtained combining aggregate capital, K t, with the aggregate labor input, L t, through a Cobb–Douglas, aggregate production function which we denote by  $Y_t = K_t^\theta (A_tL_t)^{1 - \theta} $. In this expression, A t is an exogenous labor-augmenting productivity factor whose law of motion is A t+1 = (1 + γ t)A t, and A 0 >0. We assume that factor and product markets are perfectly competitive and that the capital stock depreciates geometrically at a constant rate, which we denote by δ.
3.3 Government policy
The government in our model economy taxes capital income, household income, and consumption, and it confiscates unintentional bequests. It uses its revenues to consume, and to make transfers to households other than pensions. In addition, the government runs a pay-as-you-go pension system. The consolidated government and pension system budget constraint is
 $$G_t + Z_t + P_t + U_t = T_{kt} + T_{yt} + T_{ct} + E_t + T_{st} + [F_t(1 + r^{^\ast}) - F_{t + 1}].$$
In the expenditure side, G t denotes government consumption, Z t denotes government transfers other than pensions, P t denotes pensions, and U t denotes unemployment benefits. In the revenue side, T kt, T yt, and T ct, denote the revenues collected by the capital income tax, the household income tax, and the consumption tax, E t denotes unintentional bequests, T st denotes the revenues collected by the payroll tax, F t > 0 denotes the value of the Pension Reserve Fund at the beginning of period t, and r* denotes the exogenous interest rate that the government obtains from the Pension Reserve Fund assets. Consequently, [F t(1 + r*) − F t+1] denotes either the revenues that the government obtains from the Pension Reserve Fund or the funds that it deposits into it. The Pension Reserve Fund must be non-negative, and we assume that G t and Z t are thrown into the sea so that they create no distortions in the household decisions. Finally, we assume that the capital income tax rate is constant, that the household income tax rate is progressive, and that, when the Pension Reserve Fund runs out, the government changes the consumption tax rate as needed in order to finance the pensions.
3.4 The pension system
In our benchmark model economy, we choose the payroll tax and the pension system rules so that they replicate as closely as possible the Régimen General de la Seguridad Social of the Spanish pay-as-you-go pension system. The payroll tax is capped and workers older than the full entitlement retirement age, which we denote by R 1, are exempt from paying payroll taxesFootnote 11.
Retirement pensions. A household of age j ≥ R 0, that chooses or is forced to retire, receives a retirement pension, p t, which we compute following the Spanish pension system rules. The main component of the retirement pension is its Regulatory Base which averages labor earnings up to the maximum covered earnings, during the N b years prior retirementFootnote 12. If a household has not reached the full entitlement retirement age, its pension is subject to an early retirement penalty. If the household is older than R 1, its pension claims are increased by 3% for each year worked after this age. The Regulatory Base is multiplied by a pension replacement rate which we use to replicate the pension expenditures to output ratio. Finally, retirement pensions are bounded by a minimum and a maximum pensionFootnote 13.
Disability pensions. To replicate the current Spanish rules, we assume that there is a minimum disability pension that coincides with the minimum retirement pension, and that the disability pension is 75% of the household's Regulatory Base.
The revaluation of pensions. Following the 2013 reform to the Spanish pension system, we assume that both retirement and disability pensions are revaluated using the PRI.
3.5 Equilibrium
A detailed description of the equilibrium process of this model economy can be found in the technical appendix, which can be downloaded from https://www.ugr.es/~julianalbertodiaz/research/PEN65-APP-G20.pdf.
4. Calibration
To calibrate our model economy, we choose 2014 as our calibration year. Then we choose the initial conditions and the parameter values that allow our model economy to replicate as closely as possible selected macroeconomic aggregates and ratios, distributional statistics, and institutional details of Spain in 2014.
More specifically, to characterize our model economy fully, we must choose the values of five initial conditions and 56 parameters. To choose the values of these 56 parameters, we need 56 equations which formalize our calibration targets. We determine the values of 36 of those parameters directly because they involve either a single parameter or a single parameter and our guesses for the values of aggregate capital and aggregate labor. To determine the values of the remaining 20 parameters, we solve a system of 20 non-linear equations. We describe these steps and our computational procedure in the online technical appendix which is available at http://www.ugr.es/~julianalbertodiaz/research/PEN65-APP-G20.pdf.
5. Simulation
We use our model economy to simulate four economies. In our benchmark model economy, which we label Model Economy Ben, we replicate the 2011 and 2013 Spanish pension system reforms with all their details. Specifically, we extend the number of years of earnings that we use to compute the pensions, we delay the retirement ages, and we apply the PRI and the Sustainability Factor. In the remaining model economies, we continue to replicate the 2011 and 2013 Spanish pension system reforms but assume that part or all pensions are fully indexed with the CPI. Specifically, in the first reformed model economy, which we label Model Economy Re1, we analyze a scenario in which only disability and minimum pensions are fully indexed with the CPI. In the second reformed model economy, which we label Model Economy Re2, we assume that all those pensions whose value is <40% of per-capita GDP are fully indexed with the CPI. Finally, in the third reformed model economy, which we label Model Economy Re3, we assume that all pensions in payments are revaluated with the CPI. All model economies have exactly the same initial conditions and share the demographic, educational, growth, inflation, and fiscal policy scenarios that we describe below.
The demographic scenario. The demographic scenario replicates the demographic projections for Spain for the period 2014–2064 estimated by the Instituto Nacional de Estadística (INE) in 2014.Footnote 14 In Panel A of Figure 1 we plot the changes in the 65+ to 20–64 dependency ratio that result from this scenario. This ratio increases from 29.3 in 2014 to 78.4 in 2070Footnote 15.
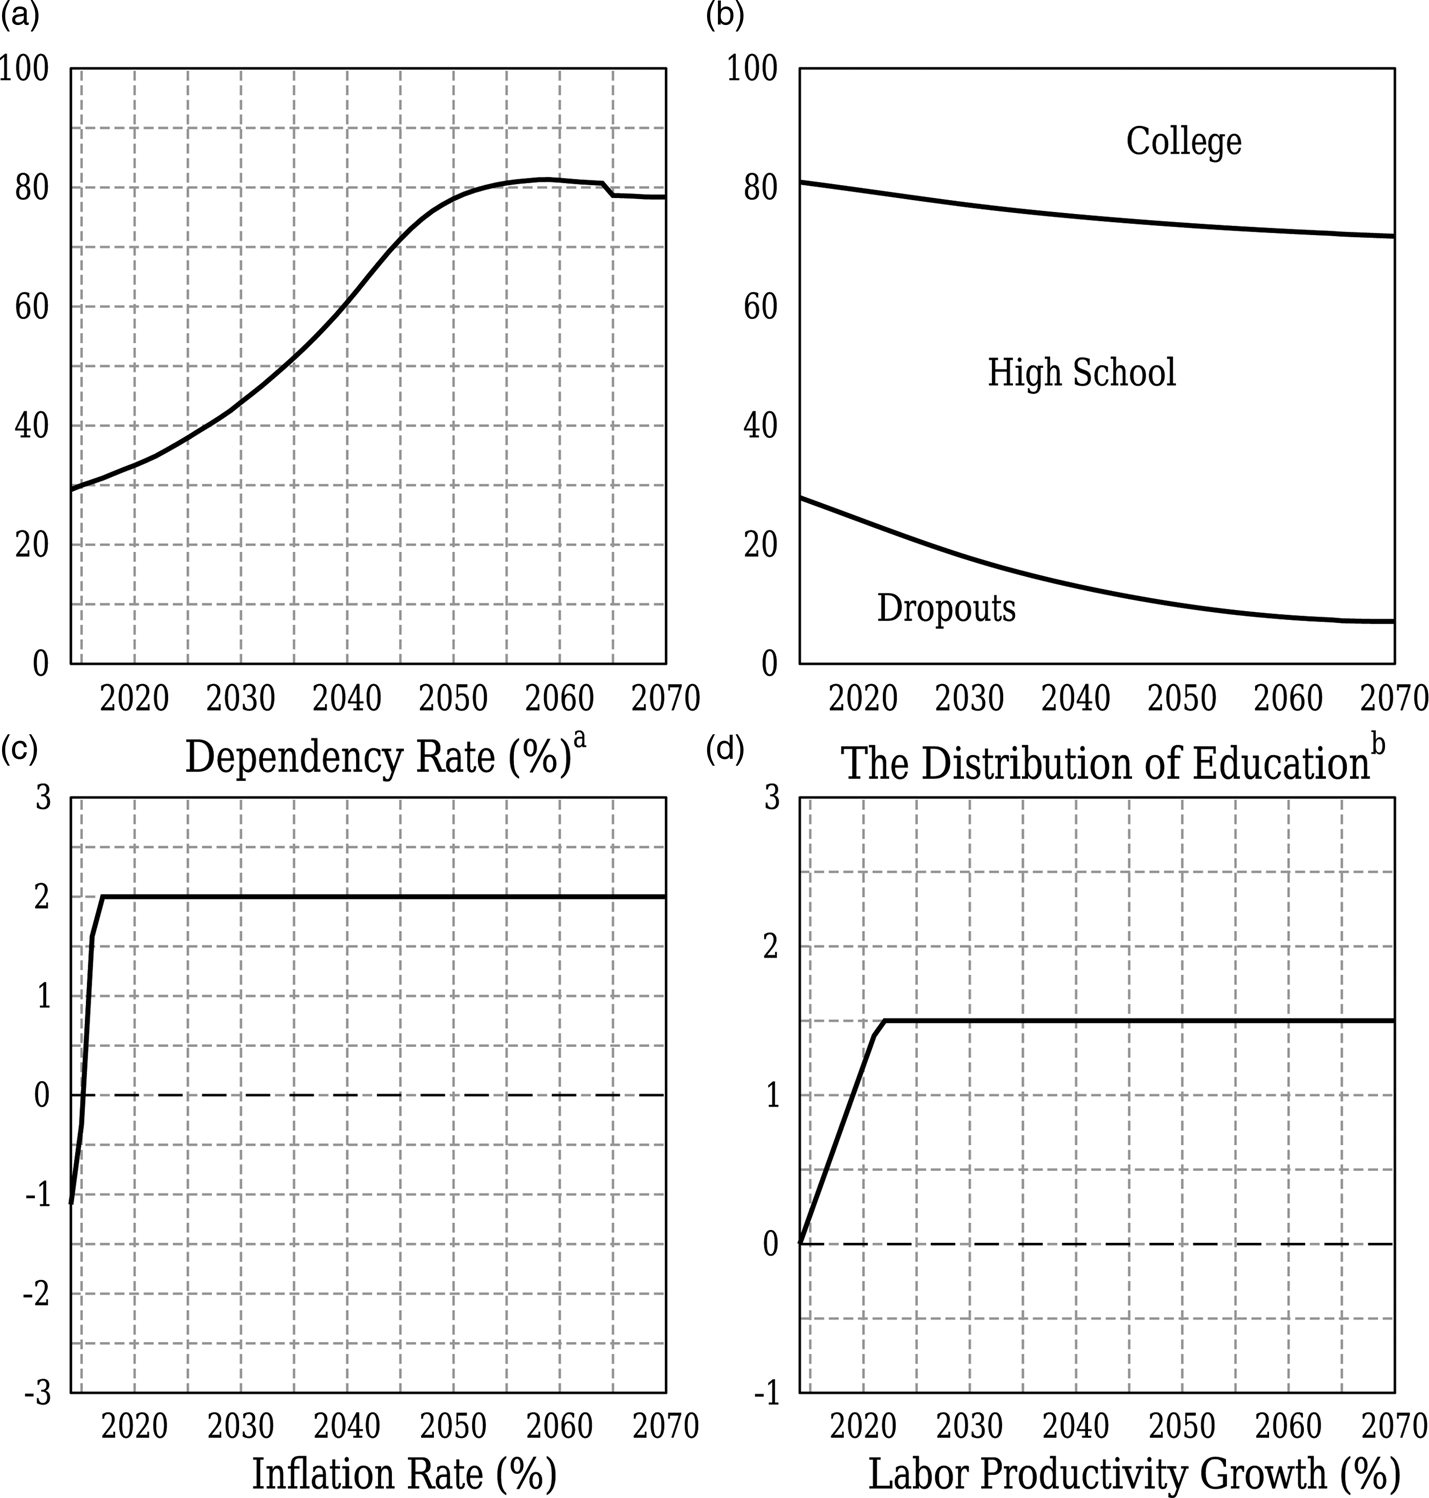
Figure 1. The Simulation Scenarios in All Model Economies. aThis is the ratio between the number of households in the 65+ age cohort and those in the 20–64 age cohort. bThis is the distribution of education of the households in the 20–64 age cohort.
The educational scenario. The initial educational distribution of our model economies replicates the educational distribution of the Spanish population in 2014, as reported by the INEFootnote 16. After 2014, we assume that the educational shares for the 20-year-old entrants are 7.33%, 62.62%, and 30.05% forever for drop-outs, high school graduates, and college graduates. Those shares are the educational shares of the most educated cohort ever in Spain, which corresponds to the 1980–1984 cohort.Footnote 17 In Panel B of Figure 1 we plot the changes in the distribution of education shared by all model economies. The shares of high school drop-outs, high school graduates, and college graduates change from 27.9%, 53.0%, and 19.1% in 2014 to 7.1%, 64.7%, and 28.2% in 2070.
The Growth Scenario. We assume that the labor productivity growth rate increases from 0% in 2014 to 1.5% in 2022, 0.2 percentage points per year. After that year, this rate remains constant at that same value (see Panel C of Figure 1). The rationale for this choice is twofold. First, because, and as stated by Boldrin et al. (Reference Boldrin, Conde-Ruiz and Díaz-Giménez2010), labor productivity growth in Spain has almost disappeared after 1995. Second, because the Spanish average annual labor productivity growth rate between 1980 and 2012 was 1.5%, according to the OECD.
Note that in our model economy, there are three sources of output growth: the changes in the labor-augmenting productivity factor, γ t, the changes in the demographic and educational distributions, which are exogenous; and the changes in labor hours and savings brought about by the changes in the unemployment rate, prices, pensions, and consumption tax rates, which are endogenous. Thus, between 2015 and 2070, these exogenous sequences and the endogenous responses result in average growth rate of output of 1.40% in our benchmark Model Economy Ben.
The inflation rate scenario. The exogenous yearly inflation rates in our model economy for the 2014–16 period are −1.1%, −0.3%, and 1.6%. Since the Spanish Government revaluated the pensions at a yearly 0.25 growth rate during those same years, the real PRI was 1.35 ( = 0.25 − ( − 1.1)), −0.55 ( = 0.25 − ( − 0.3)), and  $( - {\rm 1}.{\rm 35}( = 0.25 - 1.6))\%, $ respectively. After 2016, we assume that the inflation rate in our model economy is 2% because that is the inflation rate targeted by the European Central Bank (see Panel C of Figure 1). This inflation rate scenario implies that from 2017 the real value of the lower bound of the PRI is
  $ - 1.75\;( = 0.25 - 2.00)\% $ thereafter and the real value of the upper bound of the PRI is 0.5%. Finally, we also assume that the CPI increases at a yearly rate of 2%.
The fiscal policy scenario. Recall that the consolidated government and pension system budget constraint in our model economy is given in Expression (1). In that expression, G t is exogenous and the remaining variables are endogenous. In all model economies, the capital income tax rates and the parameters that determine the payroll tax function and the household income tax function are identical and they remain unchanged at their 2014 values. The consumption tax rates differ across the economies because we adjust them to finance the pensions once the Pension Reserve Fund is exhausted. Every other variable in Expression (1) varies with time and differs across both economies because they are all endogenous.
Reform announcement. We assume that all the reforms of Spanish pensions are announced and implemented at the beginning of 2018.
6. Results
We simulate our model economies using the demographic, educational, growth, fiscal, and inflation rate scenarios that we have described in Section 5, we report the main results of our simulations in Table 1, and we illustrate the main results of our simulations in Figures 2–7.

Figure 2. The Sustainability Factor.

Figure 3. The Minimum, Maximum, and Average Pensions. *As a percentage of output.

Figure 4. The Pension System Budget. As a percentage of output.

Figure 5. The Consumption Tax Rate and the Real Pension Revaluation Index (%).

Figure 6. Main Aggregates.

Figure 7. Households Collecting Minimum and Maximum Pensions and the Gini Index of Pensions.
Table 1. Simulation results

Rev, pension revenues (%GDP); Exp, pension expenditures (%GDP); Bal, pension system balance (%GDP); AvP, average pension (2014 = 100); AvA, average retirement age; τ c, consumption tax rate needed to finance the pension system (%). Y, output index (2014 = 100); K, capital index (2014 = 100); L, labor input index (2014 = 100).
The Sustainability Factor. Recall that the 2013 Reform of the Spanish pension system introduced the Sustainability Factor. This factor only affects new pensioners joining the system in 2019 onwards, and it operates in all our model economies. In Figure 2, we represent the values of the Sustainability Factor that we have computed using the 2014 Spanish mortality tables. It turns out that, by 2070, the Sustainability Factor alone will have reduced the real yearly value of new Spanish pensions by 27.8 percentage points.
The minimum, maximum, and average pensions. In Figure 3, we plot the time series of minimum, maximum, and average pensions. Panels A and B of this figure show that both minimum and maximum pensions decrease by 54% in Model Economy Ben between 2014 and 2070, due to the PRI. Conversely, Panel C shows that the average pension increases by 21 during that same period, and this is because of two main reasons: first, due to the educational transition; and second, because labor productivity growth affects average pensions since pension rights track labor income and labor income tracks labor productivity. However, the growth in the average pension is not constant over the ensuing decades. Specifically, until 2030, there is no significant variation as the 2011 and 2013 pension reforms are being phased in. After that year, and once some of those changes have been completely implemented (for instance, the change in the Regulatory Base and the increases in the legal retirement ages), the growth rate of the average pension increasesFootnote 18.
Panels D, E, and F show these same pensions as a proportion of output per capita, and the profiles are similar since the ratios plummet from 20%, 141%, and 42% in 2014 to 4%, 30%, 24% in 2070, respectively. Note also that the ratio of average pension to output per capita can be thought of as a measure of the adequacy or generosity of the pension systemFootnote 19, so that, all other things being constant, a decline in this ratio over time points to a fall in the generosity of public pensions, relative to output per capita. Thus, the projected reduction in this adequacy ratio is expected to contribute to improving public finances but it could also increase poverty risk among older people in the future.
Figure 3 also shows that the differences between the benchmark and the reformed model economies are large. The aforesaid reforms imply that minimum pension stays constant in real terms from 2018, and that the average pension grows by approximately 35%, 46%, and 88% between 2014 and 2070 in Model Economies Re1, Re2, and Re3, respectively. Consequently, and in terms of per capita output, Panel D shows that in 2070, the minimum pension is approximately 5 percentage points higher in the reformed economies than in Model Economy Ben, while Panel F shows that the average pension is 3, 6, and 15 percentage points higher. Finally, the maximum pension falls in all economies except in Model Economy Re3, where all the pensions are indexed to the CPI (see Panel B of Figure 3). Note also that the maximum pension remains constant after 2048 in Model Economy Re2, and this is because in that year this pension falls below 40% of per-capita output, mainly due to both the PRI and the per-capita output growthFootnote 20.
Thus, returning to a full CPI indexation of part or all of Spanish pensions increases somewhat the generosity of the pension system, and this is particularly important for disabled households, since people with disabilities are at much higher risk of poverty and social exclusion than the general populationFootnote 21. However, these reforms are far from eliminating the risk of pension inadequacy in the long run, particularly because such rules are also applied to minimum pensions. That is, indexing minimum pensions to prices instead of wages is problematic, as minimum pensions are a tool to prevent the poverty of people in old age, as stated by Carone et al. (Reference Carone, Eckefeldt, Giamboni, Laine and Summier2016).
The pension system. We plot the sequences of payroll tax collections, pension payments, and pension surpluses in Figure 4Footnote 22. Panel C of Figure 4 shows the sequences of the pension deficit to output ratio. Looking at the fine print of pension deficit in the benchmark Model Economy Ben, we notice three well-differentiated stages. In the first stage, from 2017 to 2027, pension deficit to output ratio decreases, the reason being twofold: first, because of the payroll tax growth brought about by the increase in labor productivity growth and the decrease in the unemployment rate due to output growth (see Panel D of Figure 6); and second, due to the reduced growth in pension expenditure, as the 2011 and 2013 pension reforms are being phased in. After 2027, however, unemployment rate is at its stationary long-term value, and pension expenditure growth increases due to the retirement of baby boomers and also because some of the 2011 and 2013 parametric changes have already been completely implementedFootnote 23. Consequently, pension deficit increases up to 1.9% of output in 2050. After that year, and mainly because baby-boomers have already retired, the pension deficit to output ratio decreases to 0.1% in 2070.
As expected, all these pension reforms increase pension expenditure. Specifically, the reforms would on average increase yearly pension expenditure by 0.74, 1.89, and 3.83 percentage points of output during the ensuing decades in Model Economies Re1, Re2, and Re3, respectively (see Panel B of Figure 4)Footnote 24. Therefore, the pension deficit to output ratio goes from 1.2% in 2018, to 3.3%, 4.0%, and 6.6% in 2050 in Model Economies Re1, Re2, and Re3 (see Panel C of Figure 4). Note that these numbers are 1.4, 2.1, and 4.7 percentage points higher in comparison to the benchmark Model Economy Ben that same year.
The indexation of pensions. In Panel B of Figure 5, we plot the PRI obtained in the Model Economy Ben. We find that, with the exception of the year 2023, the PRI is always at its real lower bound during the next 40 years, from 2018 to 2058Footnote 25. Thereafter, this index increases, becomes positive, and reaches its upper bound over the end of the projection period. Thus, the PRI obtained in our simulations is also in line with those results obtained in other previous research papers (see, e.g., Sánchez-Martín, Reference Sánchez-Martín2014, Reference Sánchez-Martín2017; De la Fuente et al. Reference De La Fuente, García Díaz and Sánchez-Martín2018; Hernández de Cos, Reference Hernández de Cos, Jimeno and Ramos2017)Footnote 26.
The reformed model economies Re1 and Re2 further reduce the real PRI, as they increase pension expenditure. Thus, in the case of Model Economy Re2 where every pension whose value is <40% of per-capita output is fully indexed with the CPI, the PRI is located at its lower limit for every year between 2018 and 2070. In contrast, Model Economy Re3 assumes that all pensions in payments are revaluated according with the CPI, so that the real yearly revaluation rate of pensions is null in this model economy (see Panel B of Figure 5).
Fiscal consequences. Recall that we assume that, once that the Pension Reserve Fund is depleted, the government increases the consumption tax rate, τ ct, to collect additional fiscal revenues in order to balance the pension system budgetFootnote 27. Thus, the consumption tax rate necessary to finance Spanish pensions under Model Economy Ben increases up to 24.3% in 2050 and then decreases to 20.4% in 2070 as the pension deficit almost disappears (see Panel A of Figure 5).
The aforesaid pension reforms would entail an increase of the consumption tax rate. Specifically, this tax is 27.0%, 28.5%, and 33.9% in Model Economies Re1, Re2, and Re3 in 2050, and these numbers are 2.7, 4.2, and 9.6 percentage points higher in comparison to that same number in Model Economy Ben that same year. Note that increasing indirect taxes in order to pay for higher pensions affects the population as a whole, including pensioners as well as workersFootnote 28. Thus, even though the value of pensions increases in all the reformed model economies, retirees would see their adjusted pensions increased by a small amount through the impact of higher indirect taxesFootnote 29. Since there is no significant variation in wage rates across all model economies, workers face a reduction in their adjusted earnings.
Capital, labor, and output. In Figure 6, we plot the time series of factor inputs and outputs. We find that all pension reforms reduce the incentives to save. Panel B of Figure 6 shows that the capital stock is 1.8%, 5.6%, and 9.4% lower in 2070 in Model Economy Re1, Re2, and Re3, and this is mainly because a large share of the population takes advantage of the more generous pensions and reduces its savings for old age.
Total labor input also decreases in Model Economies Re2 and Re3 by 2.9% and 3.7% in 2070 (see Panel C of Figure 6). To gain some intuition about where this drop in total effective hours comes from, Panels D, E, and F show the dynamics of its components. Thus, Panel F shows that the decrease in total labor is mainly accounted for by the reduced average hours worked due to the higher consumption tax ratesFootnote 30. Consequently, Panel A shows that in 2070 output is 4.1 and 6.7 percentage points lower in Model Economies Re2 and Re3, so that these pension reforms reduce the yearly average growth rate of output between 2018 and 2070 from 1.39% in Model Economy Ben to 1.32% and 1.27% in the reformed economies Re2 and Re3.
Total labor input, however, increases in Model Economy Re1. This is because the lower average hours worked due to the higher consumption tax rates is compensated for by the increase in the number of workers that follows from the delay in their retirement ages (see Panel E of Figure 6). Specifically, workers stay longer in the labor market because disability risk is covered by more generous pensions, since only minimum and disability pensions are revaluated with the CPI. Consequently, this reform brings a non-significant variation in output in comparison to Model Economy Ben.
The inequality of pensions. In Panels A and B of Figure 7, we represent the share of the retirees and disabled who collect the minimum and maximum pensions. We find that in 2070 in Model Economy Ben, the share of those collecting the minimum pension is lower in comparison to the reformed economies. The opposite holds for those retirees collecting the maximum pension that same year. To be specific, in 2070 in Model Economy Ben, 6.4% and 54.2% of retirees and disabled collect the minimum and maximum pensions, respectively. In Model Economy Re1, these figures are 11.6% and 42.6%; in Model Economy Re2, these numbers are 10.5% and 46.4%; and in Model Economy Re3, they are 11.3% and 19.6%.
The reductions in the minimum and maximum pensions brought about by the PRI is mainly behind these results. Specifically, note that in the reformed Model Economy Re3, the gap between both the real minimum and maximum pensions remains constant from 2018 onwards. However, this is not the case in Model Economy Be, as both pensions are revaluated with the PRI, so that this gap (in absolute value) decreases over the following decades. Consequently, the return to price indexation of all pensions increases pension inequality in the long run (see Panel C of Figure 7). Conversely, the Re2 reform reduces this gap even further, in comparison to the benchmark Model Economy Be, as the real minimum pension remains constant from 2018 onwards. Henceforth, and differently from the previous case, this pension reform reduces pension inequality.
Finally, the reformed Model Economy Re1 presents mixed results regarding pension inequality. Specifically, the Gini Index first decreases as this reform updates the minimum pension with the price index. However, in the long run, this index increases, mainly because of the increase in inequality of the disability pensions, since these pensions are fully indexed to the CPI.
Overall assessment. The aforesaid pension reforms essentially imply trading off higher pensions against the higher taxes that are needed to finance them. On average, the CPI indexation for part or all Spanish pensions would entail that, on average, annual pension expenditure would be 0.74, 1.89, and 3.83 percentage points of output higher up to 2070. To obtain additional revenues, the Spanish government has a limited menu of tax increases, with changes in indirect taxes being the preferred option among experts proposing alternatives for reforming the Spanish Tax System, mainly for reasons of efficiency. Our results show, however, that consumption tax rates should be increased on average by 1.9, 3.7, and 7.5 percentage points, respectively, during that same period. Moreover, such increases could reduce total hours of work and, consequently, the growth rate of output. As we show below, in social welfare terms, these reforms bring about very different welfare outcomes.
7. Welfare
To quantify the welfare effects of the return to full price indexation of Spanish pensions, we use a Consumption Equivalent Variation measure (CEV). Specifically, we compute the percentage change in a household's yearly consumption that equates its expected lifetime utility in Model Economies Ben and a given pension reform. We start our computations in 2018, which is the year when the reforms are announced and implemented, and we compute the CEV measure for all the households who are alive that year, and for those who enter to the model economies between 2019 and 2070. Since we assume that new-entrants are 20 years old, these cohorts of households would have been born between 1999 and 2050. In Figure 8, we report the results of our welfare comparisons for the households who are alive in 2018 when the reforms are implemented. Panel A of Figure 9 shows the welfare results for the households born between 1918 and 2050. Finally, Panel B of Figure 9 shows the aggregate welfare gainsFootnote 31.

Figure 8. The Welfare Cost of the Reforms: Alive (CEV, %)*. *The three panels of this figure report the welfare gains of the household types organized by year of birth.

Figure 9. The Average and Aggregate Welfare Gains of the Reforms (%).
Alive. Figure 8 shows the average welfare gains of the households alive in 2018 when the pension reforms are implemented. These households were born between 1918 and 1998 and some of the youngest households will survive until 2098. We find that all disabled households gain in all reformed economies because they receive a higher disability pension for longer, and that their welfare gains are larger in Model Economy Re1. This is because under this reform all disability pensions are fully indexed with the CPI, as in Model Economy Re3. However, and unlike Model Economy Re3, this reform limits the tax increases needed to finance the pension system deficits. The gains in Model Economy Re1 are increasing and they range from 1.5% of consumption for the disabled households born in 1918 to 26.7% for those disabled who were born in 1997.
All retirees are better off in the Model Economy Re3; only low-income retirees are better off in Model Economy Re2, and only those retirees who collect minimum pensions are better off in Model Economy Re1. Panel C of Figure 8 shows that welfare gains are higher in the Model Economy Re3, as this reform fully indexes all retirement pensions with the CPI. In this last economy, these gains range from 1.1% for those born in 1918 to 8.4% of lifetime consumption for those born in 1956. Note also that welfare gains decrease with age because old retired households will benefit from higher pensions for a shorter time period.
Older workers, as in the case of retirees, also prefer Model Economy Re3, where their welfare gains increase until 8.3% of lifetime consumption for those born in 1952. Thereafter, welfare gains decrease and become welfare losses that reach 1.9% of lifetime consumption for those born in 1998, so that younger workers like better Model Economy Re1. Put differently, and despite their higher future pensions brought about by the Model Economy Re3, younger workers lose with this reform because they will face higher consumption taxes during the rest of their lifetimes. Finally, most of unemployed households are better off under Model Economy Re2. This is because these households face some periods of unemployment, so that they have to make do with a reduced future retirement pension.
Newborns. In Panel A of Figure 9, we report the average individual welfare gains of the household types. This figure also shows that newborns like better Model Economy Re1, since their average welfare gains range from 0.8% to 3.5%. Newborns are willing to pay more taxes to the point where these higher tax revenues increase those pensions directed to reduce both poverty and disability risk. On the other hand, the return to the full price indexation of all public pensions entails welfare loses that exceed 2% of lifetime consumption.
Aggregate welfare gains. In Panel B of Figure 9, we report the aggregate welfare gains. To compute these sequences, we consider both households alive in 2018, and those cohorts born between 1999 and 2050Footnote 32. We find that the reformed Model Economy Re1 produces an average aggregate welfare gain of 1.53% of total consumption between 2018 and 2070. For the remaining two reformed model economies, these numbers are 1.28% and 0.11% for that same period. Nevertheless, we also find that most of the households alive at the time of these pension reforms prefer the return to a price indexation rule of all Spanish pensions, since this reform brings about sizeable aggregate welfare gains equivalent to 2.7% of aggregate consumption.
8. Sensitivity analysis
In this section, we analyze the sensitivity of our findings to our assumptions regarding the labor augmenting growth rate and the inflation rate scenarios. In Table 2, we report the values of some of the main macroeconomic variables in 2070 under these scenarios, and in Figure 10, we compare the welfare costs of the reforms.

Figure 10. The Welfare Cost of the Reforms (CEV, %)*. *The three panels of this figure report the welfare gains of households organized by year of birth.
Table 2. Main aggregates and ratios in 2070

Rev: pension revenues (%GDP); Exp: pension expenditures (%GDP); Bal: pension system balance (%GDP); AvP: average pension (2014 = 100); AvA: average retirement age; τ c: consumption tax rate needed to finance the pension system (%). Y: output index (2014 = 100); K: capital index (2014 = 100); L: labor input index (2014 = 100).
8.1 Growth rate scenario
Our Baseline scenario assumed that the labor productivity growth rate increases from 0% in 2014 to 1.5% in 2022, and it remains constant at this same value thereafter. To check the robustness of our findings, we simulate all model economies again, assuming that the annual growth rate of labor productivity is only 0.75% from 2018 onwards.
Note that a drop in the labor productivity growth rate translates into decreases in wages and, therefore, in the value of future pensions, which depend on the wages received during the last part of the working lifetime. However, since both earnings included in the Regulatory Base and current pensions do not adjust with the rate of wage growth in all model economies, such a decrease in productivity growth gives rise to increases in the average pension to output per capita ratio, and, consequently, in the generosity of the system and in pension payments as a share of output.
The second block of Table 2 shows that pension expenditure in 2070 increases in all model economies, becoming 10.4%, 12.0%, 14.8%, and 19.2% of output, respectively. This block also shows that there is no significant variation in the payroll taxes to output ratio, so that pension system deficits in 2070 increase to 1.1%, 3.0%, 5.4%, and 9.7% of output, respectively (see fourth column second block of Table 2). Hence, the consumption tax rates needed to finance these deficits are 22.5%, 26.4%, 31.2%, and 39.7% that same year. Finally, Panel B of Figure 10 shows that the profile of welfare gains and losses is similar to that obtained in the Baseline simulations, as shown in Panel A of that same figure. However, older households gain more, in comparison to the Baseline simulations, because the pension reforms increase the generosity of the pension system further, and, conversely, the losses (gains) for newborns are also higher (lower) since the tax increases required to finance pension expenditure are also higher.
In conclusion, although a slower pace for productivity growth reduces the growth of the average pension, it results in a higher generosity of the pension system, so that pension expenditure to output increases. Consequently, a lower labor productivity growth exacerbates the sustainability problems of Spanish Pension System, brought about by these pension reforms.
8.2 Inflation rate scenario
Our Baseline scenario also assumes that both the GDP deflactor and the CPI increase an annual rate of 2% from 2017 onwards. As a final robustness check, we again simulate all model economies under a scenario where both variables grow to an annual rate of 1% from 2017 onwards. Note that this new scenario changes the lower bound of the PRI in real terms, since in this case this bound is now −0.75%Footnote 33. Moreover, the change in the inflation scenario does not affect Model Economy Re3, since this pension reform eliminates the PRI.
Our main findings under this low-inflation scenario are the following: In Model Economy Ben, the average pension increases by 50% between 2014 and 2070, rather than 22% for that same period in our Baseline scenarioFootnote 34. Consequently, the increases in the average pension due to the pension reforms are lower in this case, since these increases in 2070 are reduced from 11.3%, 20.7%, and 54.6% in the Baseline scenario to 6.8%, 8.0%, and 25.7% in this low-inflation scenario (see first and third blocks of Table 2). Thus, these pension reforms increase now the pension deficit by 0.9, 1.3, and 3.3 percentage points of output in 2070, and the consumption tax rate increase in 2.2, 2.8, and 6.6 percentage points that same year. Finally, welfare gain and losses are lower because the lower increases in pensions and tax rates (see Panel C of Figure 10).
9. Conclusions
In this article, we analyze the fiscal and welfare consequences of implementing a full price indexation for part or all Spanish pensions. These reforms increase pensions, pension adequacy, and, consequently, pension expenditures and the pension deficit expected during the ensuing decades. Thus, the government would be forced to obtain additional revenues, either by increasing payroll taxes, or by increasing other taxes to pay for pension expenditure. Our results also show that higher pensions and higher indirect tax rates could entail labor supply and physical capital reductions.
We also find that a desirable alternative to the current pension system would be to implement a price indexation on disability and minimum pensions, since this reform would improve the reinsurance against the earnings and health risk in the Spanish pension system. Moreover, its fiscal cost, assumable in our opinion, would increase pension payments by on average 0.9 percentage points of output during the ensuing decades, so that to finance this higher pension expenditure, the Spanish Government should implement, for instance, an average increase in the consumption tax rate of 1.9 percentage points. According to our results, this indexation rule would entail significant welfare gains both for most of the households alive at the moment of this policy change and also for future cohorts.
However, our results also show that returning to the full price indexation of all Spanish pensions, as currently advocated by certain political and social sectors in Spain, would involve both a substantial increase in the future pension expenditures and also significant tax increases necessary to finance the higher future pension system deficits. Put differently, and even though the return to full price indexation of all Spanish pensions is the preferred option for current retirees, this change in the indexation rule would bring about significant welfare losses for young and future cohorts. In fact, this pension reform would be the least desirable of the pension reforms considered here, in terms of welfare.
Nonetheless, although the pension reforms analyzed here would somewhat increase the generosity of the system, they are far from eliminating the risk of pension inadequacy over time, particularly because CPI indexation is applied to the minimum pension. In other words, the indexation of minimum pensions to prices is problematic, as minimum pensions are an instrument to prevent the poverty of people in old age. Therefore, and independently of a possible change in the indexation rules of Spanish pensions, we conjecture that minimum pensions will be exempted from the PRI, sooner rather than later, and that their real value will be increased to stay aligned, for example, with output per capita.
We think that the current Spanish pension system should be overhauled and replaced by a system that combines targeted minimum pensions, fully contributive pay-as-you-go pensions, and mandatory individual retirement accounts. Specifically, the system could provide focused and reduced minimum pensions that guarantee a minimum level of income for the elderly. This type of pension, granted by nature of assistance, could be subject to the fulfilment of a series of requirements such as the income and the wealth of the beneficiaries. Regarding the second pillar, this reform could reduce the contributory rate by half, and it could also implement a system of defined contribution notional accounts, where the retirement pension would be determined by the annuity corresponding to contributions made during the working life and life expectancy at the time of retirement. Finally, the third pillar would be that provided by the insurance sector, and the system would impose on every worker the obligation to make monthly contributions to an individual capitalization accountFootnote 35.
The introduction of complementary private-pension pillars supports retirement incomes, through a higher accumulation of non-public pension rights, and provides a buffer against adverse shocks by diversifying pensioners’ sources of income. Moreover, the reform that has just been briefly described has a series of advantages in relation to the system that currently prevails in Spain. First, the multiplicity of sources of income introduced by this reform has the advantage that they combine the low cost of insurance against the longevity risks offered by the pay-as-you-go systems, with the possibilities of geographic diversification of the investments offered by the capitalization systems. Second, this mixed system protects pensions from local economic cycles and the effects of these cycles on fiscal policy. Third, mixed systems encourage individual responsibility for pensions and retirement savings. Fourth, the lower payroll tax rates should foster tax collections and discourage the submerged economy. However, we believe that this type of pension reform should be put into place sufficiently early because the build-up of supplementary savings takes time.
Acknowledgement
This paper has benefited greatly from the insights and advice of Javier Díaz-Giménez. I thank Juan Carlos Conesa for an early version of the code. I am also grateful to the editor, two excellent anonymous referees, and Alfonso Sánchez-Martín for valuable suggestions and comments


